Development of molecular simulation methods to accurately represent protein-surface interactions: Method assessment for the calculation of electrostatic effects Galen Collier, Nadeem A. Vellore, and Robert A. Latoura兲 Department of Bioengineering, Clemson University, Clemson, South Carolina 29634
Steven J. Stuart Department of Chemistry, Clemson University, Clemson, South Carolina 29634
共Received 24 September 2009; accepted 27 October 2009; published 13 January 2010兲 The simulation of the interactions of proteins with charged surfaces in a condensed-phase aqueous solution containing electrolytes using empirical force field based methods is predominantly governed by nonbonded interactions between the atoms of the protein, surface, and the solvent. Electrostatic effects represent the strongest type of these interactions and the type that is most difficult to accurately represent because of their long-range influence. While many different methods have been developed to represent electrostatic interactions, the particle mesh Ewald summation 共PME兲 method is generally considered to be the most accurate one for calculating these effects. However, the PME method was designed for systems with three-dimensional 共3D兲 periodicity, and not for interfacial systems such as the case of protein adsorption to a charged surface. Interfacial systems such as these have only two-dimensional periodicity, which may not be appropriate for treatment with PME due to the possibility that the presence of multiple charged image surfaces parallel to the primary simulation cell’s surface, may introduce nonphysical effects on the behavior of the charged molecules in the system. In an effort to address this issue, the authors have conducted a set of nanosecond-scale molecular dynamics simulations to calculate the equilibrium distribution of Na+ and Cl− ions near a charged surface using PME and a range of radial cutoff methods for treating electrostatic interactions, where the cutoffs prevent interaction with the periodic images of the system. The resulting ion concentration profiles were compared to one another and to a continuum analytical solution of the theoretical ion distribution obtained from the Poisson– Boltzmann equation. Their results show that the PME method does not introduce the suspected nonphysical effects in the ion distributions due to the 3D periodic images of the system, thus indicating that it is appropriate for use for this type of molecular simulation. Although their interest is motivated by protein-surface interactions, the conclusions are applicable for the treatment of electrostatics in other aqueous systems with two-dimensional periodicity. © 2009 American Vacuum Society. 关DOI: 10.1116/1.3266417兴
I. INTRODUCTION The surfaces of synthetic biomaterials placed in contact with fluids containing soluble proteins become coated with adsorbed proteins in a matter of seconds, and it is this protein layer that is largely responsible for the reaction that living cells have to the presence of such materials. Generally, cells do not contact the implanted biomaterials directly. Instead, various cell receptor-protein binding events allow cells to interrogate the molecular structure of the exposed portions of the adsorbed proteins, leading to intracellular signaling processes and subsequent cellular responses. The exposed portions of the adsorbed proteins may not necessarily be the same as those found on the exterior of their native conformations. In the process of adsorbing to a biomaterial surface, proteins may undergo significant structural changes1 that can result in the presentation of exposed or otherwise buried bioactive sites to the cellular environment. Overall, it is the particular conformation and orientation of the adsorbed proa兲
Electronic mail:
[email protected]
57
Biointerphases 4„4…, December 2009
teins that govern the way in which cells react to a proteincoated surface. Thus, in order to control the cellular response to a biomaterial, the type of bioactive sites presented by the adsorbed layer of proteins must be controlled through strategic material design. The importance of examining protein adsorption mechanisms in determining the biocompatibility of implanted materials has been well established, but a means of studying these mechanisms at a resolution sufficient to guide material design has yet to be developed. Numerous experimental techniques have been used to explore protein conformations on a surface, but these analyses are generally unable to capture the critical mechanistic details underlying protein adsorption processes at the level that is needed for surface chemistry design to control protein adsorption behavior. Atomic-scale molecular simulation 共e.g., all-atom empirical force field methods兲, coupled with experimental techniques for validation, has the potential to overcome this limitation by providing the ability to predict protein adsorption processes at an atomistic level. However, before this potential
1934-8630/2009/4„4…/57/8/$25.00
©2009 American Vacuum Society
57
58
Collier et al.: Development of molecular simulation methods
can be realized, molecular simulation methods must be carefully evaluated and adapted for this specific type of application. The issues to be addressed are not only those regarding the parametrization of the atomic interactions between a protein, a surface, and the surrounding aqueous solution but also those associated with the general mathematical treatment of these interactions as well.2 This present article serves as the first in a planned series of three articles that address designated issues that are relevant for the development of molecular simulation methods to accurately represent proteinsurface interactions. In this first article, we address the issue of whether using three-dimensional 共3D兲 periodicity and the conventional 3D implementation of the particle-mesh Ewald 共PME兲 summation method for long-range electrostatics results in nonphysical effects due to the image of the charged surface over the top of the primary simulation cell. In follow-up articles, we plan 共i兲 to address the importance of controlling system pressure for simulations of peptide and protein adsorption and 共ii兲 to introduce a new simulation program that we are specifically developing for protein adsorption simulations that enables a separate force field to be used for each of the three phase of the system 共the solution phase, the solid surface phase, and the interphase between them兲. In a molecular simulation, nonbonded interactions involve an accounting for van der Waals 共vdW兲 interactions, which are short-range interactions that diminish as r−6, with the distance r between atoms, and electrostatic effects, which are long-range interactions that diminish as a function of r−1. Because of their short-range nature, vdW interactions are effectively addressed using cutoff methods wherein the vdW attraction between atoms separated by more than a defined distance is neglected without introducing substantial artifacts into the system. Cutoff methods, however, are generally not recommended for use for the calculation of long-range electrostatic effects because of the risk of introducing substantial nonphysical effects3–6 which result from both the abrupt termination of pairwise interactions in the vicinity of the cutoff and the neglect of longer-range electrostatic interactions. While calculation schemes that use smoothing functions have been shown to significantly reduce the presence of nonphysical effects due to the use of abrupt cutoffs,7 the neglect of long-range interactions is still a serious concern. Today, the standard method that is recommended to account for long-range electrostatic interactions for protein folding simulations using empirical force field methods is PME.8 The PME method is one of several variants of Ewald summation, in which contributions to the total energy are decomposed into a short-ranged component that is evaluated in real space, and a long-ranged component, including the interaction with the periodic images, which is summed in Fourier space. These two series converge more rapidly than would be the case if the electrostatic interactions were summed directly. This is the most thoroughly validated and widely used method for computing electrostatic interaction energies for 3D periodic systems. The use of PME thus provides a means to overcome the generation of nonphysical Biointerphases, Vol. 4, No. 4, December 2009
58
effects resulting from the use of cutoffs with a relatively minor increase in computational cost. This characteristic makes PME an excellent candidate for the calculation of long-range electrostatic interactions for highly charged systems, such as those containing proteins, peptides, or DNA in explicit water.9,10 While PME with 3D periodic boundary conditions is the most commonly used method for the treatment of nonbonded interactions for protein folding simulations, it may not be appropriate for the simulation of protein adsorption to a surface. Although periodic replication of the surface is realistic in the plane of the surface, there are concerns that the periodic images of this surface represented above and below the primary unit cell system may introduce nonphysical effects on the adsorption behavior, particularly in cases where the surface is charged or dipolar. Molecular dynamics simulations of systems such as these with slab geometry 关i.e., 3D systems with two-dimensional 共2D兲 periodicity兴 are widely accepted as a means of simulating interfacial systems. However, the use of Ewald summation for handling the electrostatics of a system with slab geometry often requires modifications to the mathematical approach underlying the Ewald method.11–16 An alternative approach for handling 2D periodicity for a 3D Ewald system may also be implemented by the construction of the primary simulation cell with structural features that serve to effectively reduce problematic electrostatic interactions from the periodicity in the third dimension to a negligible level. An example of this type of construction is the use of a fixed layer of explicitly represented bulk solvent at the top of the simulation cell to serve as a barrier between the mobile solution phase and the imaged bottom layer of the solid surface phase of the system. This model design serves the dual purpose of providing a boundary at the top of the simulation cell that more closely approximates bulk solution conditions than the imaged bottom layer of the adsorbent surface and additional separation distance between the mobile molecules in the primary simulation cell and the periodic image of the charged surface that is represented above the primary cell. Using this type of alternative approach, the objective of this work was to evaluate PME and alternative electrostatic methods 共e.g., cutoffs兲 as implemented in the CHARMM suite of simulation tools17 and parameter libraries18 to determine if such nonphysical effects occur, and the extent to which they occur, using a relatively simple but sensitive model system involving the distribution of Na+ and Cl− ions in 150 mM NaCl aqueous solution over a negatively charged surface with a layer of fixed bulk saline solution at the top of the simulation cell. Before conducting our molecular dynamics simulations, we first performed an analytical calculation to theoretically predict the ion concentration profile in a 150 mM monovalent salt solution placed between two negatively charged surfaces separated by a designated distance using the Poisson– Boltzmann equation. In this analytical model, one surface serves to represent the charged surface in the primary unit cell of a molecular dynamics simulation of saline solution over a charged interface and the opposite surface represents
59
Collier et al.: Development of molecular simulation methods
the first periodic image above the primary unit cell system that would be represented when 3D periodic boundary conditions are used. These calculations serve as a basis to demonstrate the possible nonphysical effects that may occur when using the PME method to represent the behavior of charged solutes over a charged surface in a molecular simulation. The obvious limitations of the Poisson–Boltzmann approach,19 such as the neglect of van der Waals interactions, the treatment of atoms as point charges, and the use of a solute dielectric that does not account for arrangements of polar and charged groups in an external electric field, prevent direct comparison between the analytical and simulation results. Thus it must be recognized that these analytical results only serve to provide a means of graphically illustrating the type of nonphysical effects that may occur in a simulation of this type of system when using 3D periodic boundary conditions. To determine if similar types of nonphysical effects resulted from the use of the PME method, and if the use of cutoffs instead of PME may prevent these effects from occurring, we then conducted molecular dynamics simulations of this same type of system using both PME and cutoff methods for the calculation of electrostatic effects. Our model system for our molecular dynamics simulations comprised a 150 mM NaCl aqueous solution with explicitly represented water molecules and Na+ and Cl− ions over a 50% deprotonated COOH-SAM surface 关pKd = 7.4 共Ref. 20兲兴 neutralized by additional Na+ counterions. Nanosecond-scale molecular dynamics simulations were conducted to investigate the effect of the electrostatic method used upon the resulting concentration profiles of the ions in solution over the charged surface using PME and a range of radial cutoff distances. Because the distributions of the ions in solution are strongly influenced by how the electrostatic interactions are calculated during the molecular dynamics 共MD兲 simulation, comparisons between the resulting ion concentration profiles achieved using each method enable conclusions to be drawn regarding the appropriateness of the use of these different methods for the simulation of solute adsorption to a charged surface. II. MATERIALS AND METHODS A. Analytical study of ion distribution between two negatively charged surfaces
In this section we present the analytical approach used to theoretically calculate the ion distribution over a COOHSAM surface based on the Poisson–Boltzmann equation. The developed equations are then applied to predict this distribution to simply demonstrate 共rather than actually model兲 the types of nonphysical effects that may possibly result from the use of 3D periodic boundary conditions for a 2D periodic system and to provide a basis for the assessment of subsequent molecular dynamics simulation results. To calculate the ion distribution between a pair of negatively charged COOH-SAM surfaces 共i.e., representing a charged surface in a simulation and the first periodic image above it兲, we first need an analytical expression for the ion concentration distribution of sodium and chloride ions over a Biointerphases, Vol. 4, No. 4, December 2009
59
charged surface as a function of the ion concentration in bulk solution and the electrostatic potential of the SAM surface. The expression for the molar concentration of each ion type i 共Ci兲 as a function of the perpendicular distance from the surface plane x can be derived based on the thermodynamic principle that at equilibrium the chemical potential of each ion type must be independent of position.21,22 This is also true at large distances from the surface, where the concentration reaches a bulk value and the electrostatic potential approaches zero. This relationship can thus be expressed as
i共x兲 = oi + zie⌿共x兲 + kBT ln兵ai共x兲其 = oi + kBT ln兵abi 其, 共1兲 where i共x兲, oi , and ai共x兲 are the chemical potential, the standard state chemical potential, and the activity of ion species i at position x; zi is the charge on ion i; e is the absolute value of the charge of an electron 共1.602⫻ 10−19 C兲; ⌿共x兲 is the electrostatic potential at position x; kB is Boltzmann’s constant; T is the absolute temperature; and abi is the activity of ion species i in bulk solution where ⌿ = 0. Writing the activity as ai共x兲 = ␥i共x兲 Ci共x兲 / Coi , where Ci共x兲, Coi , and ␥i are the solution concentration, the standard state solution concentration 共1.0 M兲, and the activity coefficient, respectively, of ion species i at position x, and assuming ideal conditions with ␥i共x兲 = 1.0, allows us to write Ci共x兲 = Cbi exp兵− zie⌿共x兲/kBT其.
共2兲
Accordingly, by Eq. 共2兲, the concentration of an ion at a distance x from a charged surface is exponentially related to the electrostatic potential at that distance above the surface. To calculate the electrostatic potential of a COOH-SAM surface, we refer to a previous set of experimental studies conducted by our group in which we measured the pKa of this type of surface to be 7.4 using surface plasmon resonance spectroscopy.20 Based on this value, at a physiological solution pH of 7.4 the COOH groups on the COOH-SAM surface will be 50% deprotonated. Given that an individual alkane chain in an alkanethiol self-assembled monolayer 共SAM兲 surface on a gold substrate occupies a surface area of 21.4 Å,2,23 this provides a surface charge density of = −0.2336e / Å2. The relationship between the electrostatic potential at the surface, ⌿共0兲, and the surface charge density 共兲 is expressed by the Grahame equation20,21 as ⌿共0兲 =
再
冎
2kBT sinh−1 , e 8okBTCbsalt
共3兲
where and o are the relative permittivity of water 共78.5 at 298 K兲 and the permittivity of free space 共8.854 ⫻ 10−12 C2 / J m兲, respectively, and Cbsalt is the concentration of the salt in the bulk solution. Based on the Grahame equation, the Poisson–Boltzmann equation can be solved20,21 to express ⌿共x兲 as
60
Collier et al.: Development of molecular simulation methods
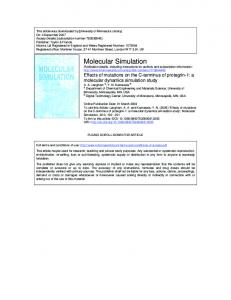
FIG. 1. Plot of Na+ and Cl− ion distributions calculated based on the analytical model. The Na+ ion population in both the 0–5 and 95– 100 Å regions 共the regions closest to the charged surfaces兲 were calculated to be 38.4 ions.
再
冎
2kBT 1 + · exp共− x兲 ln ⌿共x兲 = , e 1 − · exp共− x兲
共4兲
where = tanh兵e · ⌿共0兲 / 4kBT其 and = 共2Cbsalte2 / okBT兲1/2, with being the inverse Debye length. The relationship for ⌿共x兲 expressed in Eq. 共4兲 can now be used in Eq. 共2兲 to express the concentration profiles of the cations and anions in solution as a function of x, Ci共x兲 = Cbi exp兵− z,e⌿共x兲/kBT其
再 冉
= Cbi exp − 2zi ln = Cbi
冉
1 + · exp共− x兲 1 − · exp共− x兲
1 + · exp共− x兲 1 − · exp共− x兲
冊
冊冎
−2z
.
共5兲
Finally, the resulting concentration profiles from Eq. 共5兲 can be integrated over a range of distances from the COOHSAM surface to calculate the number of ions contained in designated layers of solvent, or bins, 共N j共x兲兲, for comparison to the molecular simulation results by Eq. 共6兲, N j共x兲 =
冕
x j+1
Ci共x兲Asdx,
共6兲
xj
where As represents the area of the COOH-SAM surface in the model system, which was set to be 45⫻ 43 Å2 共about 90 SAM chains兲 to match the conditions that were used in the molecular dynamics simulations. In these calculations, the distance between the pair of parallel charged surfaces was set to 100 Å, which is large enough that the ion concentration in the midplane between the two charged surfaces is able to represent bulk solution conditions 共i.e., 150 mM NaCl兲. The resulting distributions for Na+ and Cl− ions in aqueous solution between the two charged surfaces, as expressed by Eq. 共6兲, are presented in Fig. 1. As shown, the presence of Biointerphases, Vol. 4, No. 4, December 2009
60
each of the charged surfaces results in the formation of an electrical double layer with substantially increased concentration of counterions and reduced concentration of the coions adjacent to each surface. Among the significant features of this distribution is the population of Na+ counterions in the first 5.0 Å layer over each of the negatively charged surfaces, where the number of Na+ ions 共38 of them兲 nearly completely neutralizes the surface charges 共45 COO− groups兲. In contrast to this, the Cl− coions are almost absent in these first solvent layers adjacent to each surface. These ion concentrations steadily decay toward the bulk concentration with increasing distance from each surface, with ion concentrations effectively approaching bulk solution conditions within approximately 25 Å from each surface. These results thus theoretically indicate that surfaces with this charge density must be spaced at least 50 Å apart 共whether as distinct surfaces or images under periodic boundary conditions兲 to approach bulklike solution conditions in the midplane of the system.
B. Molecular simulation to determine the ion distribution over a charged surface
The design of our simulated model system was guided by a variety of concerns related to the proper representation of long-range electrostatic interactions. As illustrated by the ion distribution generated from the analytical model, if we constructed the molecular model of an adsorbent surface as a single layer of charged groups with an overlying solution phase, we would expect periodic boundary conditions to cause nonphysical effects with a large counterion concentration gradient developing not only at the bottom of the solution phase 共i.e., over the top of the charged surface兲 but also at the top of the solution phase due to the interactions of the counterions in solution with the periodic image of the charged surface that would be represented above the unit cell system. Additional nonphysical effects would then also be caused from the interactions between the two layers of counterions concentrated on either side of the charged surface, thus not only resulting in nonphysical effects in the ion concentration distribution in the solution phase below the charged surface, but above it as well. These effects could be prevented by constructing the molecular model of the system such that the top of the solution phase of the system was separated from the bottom of the charged surface in the periodic image above and then using a cutoff method for the calculation of electrostatic effects, with the electrostatics cutoff set to truncate interactions within this separation distance. However, it is not obvious whether or not this same strategy would prevent similar nonphysical effects from occurring when using PME, in which case the long-range range electrostatic effects from the surrounding periodic cells may still influence the system in some nonphysical manner. Based on these concerns, we proceeded with modeling this system, but with the model constructed to provide about 25 Å of distance separating the top of the
61
Collier et al.: Development of molecular simulation methods
mobile solution phase with the image of the charged surface that would be represented above the unit cell system when periodic boundary conditions were applied. More specifically, our model system was comprised of an orthorhombic layer of mobile water molecules and ions 共termed the “mobile core”兲 bounded above and below in the x dimension 共normal to the surface plane兲 by layers of fixed atoms. The mobile core of this model system was comprised of a 45⫻ 43⫻ 100 Å3 volume containing 6418 TIP3P 共Ref. 24兲 water molecules with 17 Na+ and 17 Cl− ions, sufficient to provide a 150 mM NaCl aqueous solution. The adsorbent surface, which was modeled below the mobile core of the aqueous solution, was represented as a 10 Å thick, 50% deprotonated 共pKd = 7.4兲 COOH-functionalized alkanethiol self-assembled monolayer 共SAM兲 surface with 45 negatively charged COO− terminal groups. 45 additional Na+ counterions were included in the mobile core for neutralization of the surface charges. All atoms of the 90 alkyl chains were held fixed in position except for the terminal functional group atoms. The top COOH functional groups of each SAM chain thus remained free to move during the simulations. The basis for the specific design of this surface is a combination of experimentally defined structure and previous molecular simulations conducted by our group.25 As noted above, the ion distribution of the analytical model demonstrated the need for special handling of the mobile core water molecules and ions in proximity to the periodic image of the charged surface. In the analytical model, the effect of the charged surface on the ion distribution was attenuated to approximate bulk conditions within a distance of about 25 Å. Therefore, a similar separation distance between the top of the mobile core and the periodic image of the charged surface was deemed necessary. For this reason, in addition to the separation provided by the thickness of the SAM surface, we included a 15 Å thick fixed bulk water layer at the top of the mobile core. This fixed bulk water layer represented a 150 mM NaCl aqueous solution layer comprised of 2 Na+ and 2 Cl− ions within TIP3P water. All atoms of this layer were held fixed during the production simulations so that the free water molecules of the mobile core could interface with a bulk waterlike surface instead of the periodic image of the hydrophobic bottom surface of the SAM’s alkyl chains. Prior to being held fixed during the production simulations, the fixed upper water layer, like the mobile water core, was equilibrated at 298 K and 1.0 atm. The ions in the mobile core were then randomly distributed in the water, held fixed for 100 ps of equilibration, and then all constraints were removed for an additional 500 ps of equilibration. During these procedures, the fixed bulk water layer and the charged SAM surface were moved into position above and below the mobile core, respectively, and the positions of these layers were adjusted through repeated 500 ps equilibration runs until the boundaries at the top and bottom of the mobile core moved by less than 0.1 Å in response to the presence of the inserted SAM and fixed bulk water layBiointerphases, Vol. 4, No. 4, December 2009
61
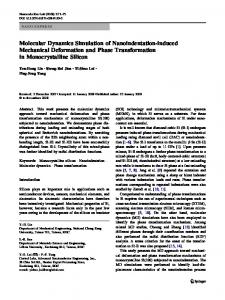
FIG. 2. 共Color online兲 Illustration of the simulated system.
ers. This procedure ensured that the simulated pressure inside the mobile core was maintained as closely as possible to its equilibrated pressure of 1.0 atm. The completed model system, which is shown in Fig. 2, was used as a starting structure for several different MD simulations, each of which employed a different method for calculating electrostatic interactions. The CHARMM 共version c32b2兲 suite of simulation tools17 and parameter libraries 共version 27兲,18 compiled and run on Intel architecture CPUs using Intel compilers 共version 9.1兲, were used for the construction of our model system and for performing molecular dynamics simulations. All systems were simulated under 3D periodic boundary conditions using the explicit-image model. The methods used for handling nonbonded interactions included PME and radial cutoffs of 10, 14, and 16 Å. Parametrization of the PME simulations26 included truncation of the real-space summation at 12 Å, a value of 0.34 Å−1 for the Ewald method’s Gaussian distribution inverse width, and a distance cutoff of 14 Å for generating the pair list. The simulations using radial cutoffs were parametrized so that nonbonded interactions were truncated with a smoothing function set to begin at 2 Å inside of each radial cutoff, accompanied by a pair list cutoff of 2 Å beyond each radial cutoff. The smoothing function used for all truncations was a force-based switching function.27 Van der Waals interactions were also truncated using a force-based switching function. All simulations were conducted in the canonical 共NVT兲 ensemble using the VV2 integrator 共an implementation of the velocity Verlet algorithm28兲. The Nosé–Hoover method29 was used for temperature control, with a target temperature of 298 K and a thermostat time constant of 0.1 ps. Bond lengths involving hydrogens were held fixed
62
Collier et al.: Development of molecular simulation methods
using the SHAKE algorithm,30 which enabled a 2.0 fs time step to be taken during the MD simulations. Simulations were first conducted to enable the initially randomized ion distribution within the mobile core to fully re-equilibrate with respect to the charged surface, resulting in a higher concentration of Na+ counterions near the SAM surface due to the presence of numerous carboxylate groups at this surface. For all seven systems, this final equilibration process required a dynamics period of approximately 6 ns before the ion concentration distributions finally stabilized, with minor differences in equilibration time among the various electrostatic methods 共 ⫾ 1 ns兲. Following this final equilibration stage, a production dynamics period of 4 ns was conducted and used for the analysis of the concentration profiles of the Na+ and Cl− ions over the surface, with the mobile solution phase binned into individual 5.0 Å layers beginning at the interface between the mobile water and the top of the SAM surface. Both Na+ and Cl− ion populations present in each 5.0 Å layer of the mobile water box were monitored as they fluctuated during the production molecular dynamics simulations. Population data were recorded every 2.0 ps during the simulations. The resulting ion population data were used to evaluate the performance of each of the electrostatics calculation methods. These results were compared to one another and to the analytical solution of the ion distribution based on the Poisson–Boltzmann equation. Additionally, the resulting ion distributions were analyzed for indications of nonphysical effects resulting from the use of cutoffs or periodicity. III. RESULTS AND DISCUSSION In order to evaluate possible nonphysical effects from the use of the PME method with 3D periodic boundary for the simulation of solute-surface interactions, a set of molecular dynamics simulations were conducted using PME and a series of cutoff methods for the representation of electrostatic interactions, each resulting in the generation of 4 ns of production data following 6 ns of system equilibration. This enables comparison among the different electrostatic methods, as well as with the analytical distribution obtained from the Poisson–Boltzmann equation. The production trajectories for each system were first analyzed by evaluating the time autocorrelation functions31 of the ion populations in each 5.0 Å bin to determine the time required for the average ion population value within a given layer of the mobile solution phase to become sufficiently uncorrelated to serve as an independent sample. As shown for the autocorrelation plots for PME 共Fig. 3兲, these correlation times are longer for the ion populations near the fixed segments of the molecular system 共i.e., the 0–5 and 95– 100 Å bins兲, indicating that the dynamics is slowed in the vicinity of the SAM surface and the fixed bulk water layer. The autocorrelation results for each electrostatic method indicated that 400 ps was sufficient time for the ion concentration in each bin to become substantially uncorrelated with the previous time period for even the slowest moving regions in each system. Accordingly, the trajectory Biointerphases, Vol. 4, No. 4, December 2009
62
FIG. 3. Plot of autocorrelation results for the Na+ ion distribution calculated using the PME method.
data for each 4.0 ns production run was divided into 400 ps blocks, thus providing ten independent samples of the average ion population in each bin for each simulation. These block averages were then used to generate a mean and 95% confidence interval for the ion count in each layer of solution above the SAM surface. The results of these analyses are plotted in Fig. 4 共Na+ ions兲 and Fig. 5 共Cl− ions兲 for each electrostatic method in comparison with the analytical solution results. The ion distributions presented in Fig. 4 show several important results. First of all, for each electrostatic method considered, the ion concentration profiles decayed to bulk solution conditions much more rapidly near the SAM surface than predicted by the analytical model. The simulation results show a substantially higher counterion concentrations in the first 5 Å from the surface compared to the analytical model, with these ion concentration profiles generally transitioning to bulk solution conditions within 10 Å from the surface. The coion concentrations are likewise higher than predicted and decay more rapidly to bulk conditions. Similar trends have been reported in an early study comparing Monte Carlo simulations to Poisson–Boltzmann equation predictions of ion distributions between two charged surfaces.21,32 We attribute these differences to both the finite-size effects that are present in the molecular simulation and absent from the continuum analytical model, as well as the fact that the continuum model does not take into account van der Waals interactions between the atoms in solution and the surface. It is also possible that these differences may reflect errors in the CHARMM force field for this type of system with the counterions being too strongly attracted to the carboxylate groups on the surface compared to the TIP3P water molecules. Similar types of imbalances in force field parametrization have been identified in other studies.33 This is a major concern for the simulation of protein adsorption behavior over charged surfaces, which can be expected to be dominated by nonbonded electrostatic interactions, and may require force field adjustment for the accurate simulation of protein adsorption behavior on negatively charged surfaces. Further studies are
63
Collier et al.: Development of molecular simulation methods
FIG. 4. Plots of Na+ ion distributions for radial cutoffs, PME, and the analytical model for each of the 5 Å layers 共a兲 within 20 Å of the charged surface or 共b兲 within 20 Å of the fixed bulk water layer, 100 Å from the charged surface in the central unit cell. In plot 共b兲, the analytical model values represent what the ion distribution would be if bulk-solution conditions were obtained.
needed to evaluate this possibility. The results shown in Fig. 4 also show that while the PME method of accounting for electrostatic effects provides ion concentration profiles that differ significantly from each of the cutoff methods, particularly for the 5 Å of solution closest to the interface, PME typically agrees more closely with the populations obtained with longer cutoffs than those obtained with shorter cutoffs, in cases where the differences are statistically significant. Furthermore, the ion concentrations determined for each electrostatics method are generally comparable, with relatively minor differences in the predicted values between each method. Most importantly for the purposes of this study, it is clear from the ion distributions presented in Figs. 4 and 5 that the use of PME for treating long-range electrostatics in the presence of a charged surface in the manner implemented in our molecular dynamics simulations does not produce ion concentration effects at the top of the mobile core of the solution phase of the system due to the presence of a periodic image of the charged surface represented above the primary simulation cell of the system. This is apparent from the fact that the Na+ ion distributions obtained using PME method are not Biointerphases, Vol. 4, No. 4, December 2009
63
FIG. 5. Plots of Cl− ion distributions for radial cutoffs, PME, and the analytical model for each of the 5 Å layers 共a兲 within 20 Å of the charged surface or 共b兲 within 20 Å of the fixed bulk water layer, 100 Å from the charged surface in the central unit cell. In plot 共b兲, the analytical model values represent what the ion distribution would be if bulk-solution conditions were obtained.
substantially different from the distributions provided by cutoff methods in the 5 Å layers of the mobile core of water closest to the rigid water layer. Because all of the cutoffs are shorter than the 25 Å thickness of the fixed water and SAM layers, these model systems include no direct interaction between mobile waters and the periodic image of the charged layer of carboxylate groups. Even for the PME system, however, it is apparent that the structure of the mobile ions was not affected by the images of the COOH surface. The adsorbed Na+ layer effectively neutralizes the charge density at the interface. That, in addition to the 10 Å SAM and 15 Å of rigid water, screens the electrostatic interaction sufficiently to prevent the formation of a second double layer at distances far from the surface in the primary unit cell, and bulk solution conditions are thus maintained in this region of the system. IV. CONCLUSIONS Overall, the comparison among the different ion distributions that result from varying treatments of the electrostatic interactions shows that PME does not result in the production of detectable nonphysical effects due to 3D periodic
64
Collier et al.: Development of molecular simulation methods
boundary conditions for the case where there is sufficient distance between the imaged surface charges and the free ions in solution in the central unit cell. Based on the structure of the simulated system used here, a separation distance of 25 Å between the free ions in TIP3P water in the central unit cell and the image of the charged surface is sufficient to screen the electrostatic interactions between these components such that bulk solution conditions are maintained at the top of the simulation cell. This finding is further supported by the fact that the ion distributions resulting from the use of radial cutoffs, which include no direct interactions with images of charged functional groups, are not substantially different from the distribution resulting from the use of PME, especially for longer cutoffs. However, the ion distributions resulting from both the PME and the radial cutoff methods do show much stronger attraction of the Na+ counterions to the negatively charged surface than suggested by the analytical model, possibly indicating that the force field parameters governing these interactions may require adjustment so that the simulation of interfacial systems in aqueous solution containing these type of ions 共e.g., the simulation of peptide and protein adsorption behavior in physiological saline兲 can be accurately modeled. Further computational and experimental studies are underway to clarify this issue. ACKNOWLEDGMENTS This work was funded under NIH Grant No. R01 GM074511 with additional funding support provided by NIH Grant Nos. R01 EB006163 and P41 EB001046-03. The authors would like to thank Dr. Bernard R. Brooks and Dr. Xiongwu Wu 共Laboratory of Computational Biology, National Institutes of Health兲 for helpful discussions related to our molecular simulations. The authors would also like to thank Dr. J. Barr von Oehsen and Corey Ferrier for support of the Palmetto Cluster computational resources at Clemson University.
Biointerphases, Vol. 4, No. 4, December 2009
64
B. Sivaraman, K. P. Fears, and R. A. Latour, Langmuir 25, 3050 共2009兲. R. A. Latour, Biointerphases 3, FC2 共2008兲. 3 J. B. Klauda, X. Wu, R. W. Pastor, and B. R. Brooks, J. Phys. Chem. B 111, 4393 共2007兲. 4 R. J. Loncharich and B. R. Brooks, Proteins 6, 32 共1989兲. 5 H. Schreiber and O. Steinhauser, Biochemistry 6, 32 共1992兲. 6 H. Schreiber and O. Steinhauser, J. Mol. Biol. 228, 909 共1992兲. 7 H. Schreiber and O. Steinhauser, Chem. Phys. 168, 75 共1992兲. 8 T. A. Darden, D. York, and L. G. Pedersen, J. Chem. Phys. 98, 10089 共1993兲. 9 R. Garemyr and A. Elofsson, Proteins 37, 417 共1999兲. 10 T. E. Cheatham, J. L. Miller, T. Fox, T. A. Darden, and P. A. Kollman, J. Am. Chem. Soc. 117, 4193 共1995兲. 11 I. Yeh and M. L. Berkowitz, J. Chem. Phys. 111, 3155 共1999兲. 12 M. Kawata, M. Mikami, and U. Nagashima, J. Chem. Phys. 116, 3430 共2002兲. 13 A. Arnold, J. de Joannis, and C. Holm, J. Chem. Phys. 117, 2496 共2002兲. 14 J. de Joannis, A. Arnold, and C. Holm, J. Chem. Phys. 117, 2503 共2002兲. 15 A. Brodka and A. Grzybowski, J. Chem. Phys. 117, 8208 共2002兲. 16 D. Bostick and M. L. Berkowitz, Biophys. J. 85, 97 共2003兲. 17 B. R. Brooks, R. E. Bruccoleri, B. D. Olafson, D. J. States, S. Swaminathan, and M. Karplus, J. Comput. Chem. 4, 187 共1983兲. 18 N. Foloppe and A. D. MacKerell, Jr., J. Comput. Chem. 21, 86 共2000兲. 19 F. Fogolari, A. Brigo, and H. Molinari, J. Mol. Recognit. 15, 377 共2002兲. 20 K. P. Fears, S. E. Creager, and R. A. Latour, Langmuir 24, 37 共2008兲. 21 J. N. Israelachvili, Intermolecular and Surface Forces, 2nd ed. 共Academic, New York, 1992兲. 22 J. M. Smith, H. C. Van Ness, and M. Abbott, Introduction to Chemical Engineering Thermodynamics, 6th ed. 共McGraw-Hill, New York, 2000兲. 23 A. Ulman and N. Tillman, Langmuir 5, 1418 共1989兲. 24 W. L. Jorgensen and C. Jenson, J. Comput. Chem. 19, 1179 共1998兲. 25 F. Wang, S. J. Stuart, and R. A. Latour, Biointerphases 3, 9 共2008兲. 26 S. E. Feller, R. W. Pastor, A. Rojnuckarin, S. Bogusz, and B. R. Brooks, J. Phys. Chem. 100, 17011 共1996兲. 27 P. Mark and L. Nilsson, J. Comput. Chem. 23, 1211 共2002兲. 28 W. C. Swope, H. C. Andersen, P. H. Berens, and K. R. Wilson, J. Chem. Phys. 76, 637 共1982兲. 29 D. J. Evans and B. L. Holian, J. Chem. Phys. 83, 4069 共1985兲. 30 J. P. Ryckaert, G. Ciccotti, and H. J. C. Berendsen, J. Comput. Phys. 23, 327 共1977兲. 31 M. E. J. Newman and G. T. Barkema, Monte Carlo Methods in Statistical Physics 共Oxford University Press, Oxford, 1999兲. 32 B. Jonsson, H. Wennerstrom, and B. Halle, J. Phys. Chem. 84, 2179 共1980兲. 33 I. S. Joung and T. E. Cheatham III, J. Phys. Chem. B 112, 9020 共2008兲. 1 2