Atila Novoselac *, Brendon J. Burley, Jelena Srebric. Department of Architectural Engineering, Pennsylvania State University, University Park, PA, USA.
Energy and Buildings 38 (2006) 163–173 www.elsevier.com/locate/enbuild
Development of new and validation of existing convection correlations for rooms with displacement ventilation systems Atila Novoselac *, Brendon J. Burley, Jelena Srebric Department of Architectural Engineering, Pennsylvania State University, University Park, PA, USA Received 17 February 2005; received in revised form 18 April 2005; accepted 30 April 2005
Abstract Building airflow, thermal, and contaminant simulation programs need accurate models for the surface convective boundary conditions. This is, especially, the case for displacement ventilation (DV) systems, where convective buoyancy forces at room surfaces significantly affect the airflow pattern and temperature and contaminant distributions. Nevertheless, for DV, as a relatively new ventilation system, the convective correlations are adopted from more traditional mixing ventilation correlations, or non-existent. In this study, the existing recommended correlations are validated in a full-scale experimental facility representing an office space. In addition, new correlations are developed for floor surfaces because the current literature does not provide necessary correlations, even though, the floor surface is responsible for >50% of the total convective heat transfer at the envelope. The convective correlations are typically functions of a surfaceair temperature difference, airflow parameters, and characteristic room dimensions. Validation results show that the floor convection correlations expressed as a function of volume flow rate are much stronger than the correlations expressed as a function of a temperature difference between the surface and local air. Consequently, the new convection correlation for floor surfaces is a function of the number of hourly room air changes (ACH). This correlation also takes into account buoyant effects from local floor heat patches. Experimental data show that the existing correlation can be successfully applied to vertical and ceiling surfaces in spaces with DV diffuser(s). Overall, the new and the existing convection correlations are tabulated for use in building simulation programs, such as annual energy analyses or computational fluid dynamics. # 2005 Elsevier B.V. All rights reserved. Keywords: Convection correlation; Displacement ventilation; Commercial buildings; Laboratory experiment
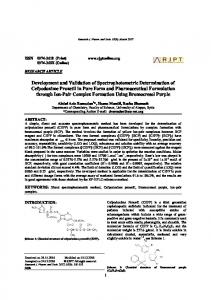
1. Introduction One of the most important factors in designing mechanical systems for buildings is defining accurate thermal boundary conditions. Convection at the internal room surfaces has a large impact on the total heat transfer and varies based on the ventilation system being used. With ventilation systems that utilize displacement diffusers, the temperature field is vertically stratified and the low-momentum supply jet is attached to the floor as shown in Fig. 1. This specific airflow pattern and temperature distribution has several potential advantages related to air quality when compared to distributions in traditional mixing ventilation systems [1]. The popularization of displacement ventilation (DV) systems * Corresponding author. 0378-7788/$ – see front matter # 2005 Elsevier B.V. All rights reserved. doi:10.1016/j.enbuild.2005.04.005
creates an incentive to validate existing convection correlations or develop new correlations specifically for these systems. In the past decade, several simplified models were developed for the temperature stratification calculations in rooms with DV [2,3]. Furthermore, Chen et al. [1] developed design guidelines for calculation of the temperature difference between the occupants’ head and ankles. The design guidelines also give an equation for calculating ventilation effectiveness at the breathing level. Even though, temperature stratification and ventilation effectiveness models are very sensitive to wall convection coefficients, they do not include correlations for their calculations. Chen et al. [1] used average convection coefficients, such as 4 W/ (m2 K) for floor surfaces. Other researchers recommend similar average values or use of convection correlations developed for room surfaces with all natural convection in
164
ACH c cL CL cT CT Dh h k m n Nu Pr q Re T DT vair Vroom Vsupply
A. Novoselac et al. / Energy and Buildings 38 (2006) 163–173
air changes per hour [h�1] coefficient for determining forced convective heat transfer coefficient coefficient for determining convective heat transfer coefficient under laminar flow coefficient for determining Nusselt number under a laminar flow coefficient for determining convective heat transfer coefficient under turbulent flow coefficient for determining Nusselt number under a turbulent flow hydraulic diameter [m] convective heat transfer coefficient [W/ (m2 K)] conductivity of the air [W/(m K)] exponent coefficient for forced convection exponent coefficient in Churchill and Usagi equation Nusselt number Prandtl number heat flux [W/m2] Reynolds number temperature [8C] characteristic temperature difference [8C] viscosity of the air [m2/s] volume of the room [m3] supply flow rate from the diffuser [m3/s]
the room [4], isolated surfaces and free edge heated plates [5], or room surfaces with well mixed air and heated room surfaces [6]. Currently, these correlations have not been experimentally validated for use in rooms with displacement ventilation systems, rather they are recommended based on the surface flow similarities to the flow condition in the original experiments. The use of constant convective coefficients creates inaccuracies, especially for floor surfaces where a major part of the convective heat flow at the room envelope occurs (>50%). The existing correlations for natural convection do not take into account effects from the DV diffuser jet. On the other hand, existing forced convection correlations are not suitable because they are developed for a standard ceiling diffuser [7], or for diffusers where the jet discharge velocity has a large impact on convection at the floor [8], which is not the case with DV diffusers. Accordingly, the first objective of the present study is to develop a new convection correlation for the floor surface in rooms with the sidepositioned DV diffuser. The second objective is to validate the existing wall surface correlations for application with the DV system. To accomplish these two objectives, full-scale experiments were conducted in test chambers with displacement ventilation.
Fig. 1. A characteristic airflow pattern and temperature stratification in a room with displacement ventilation.
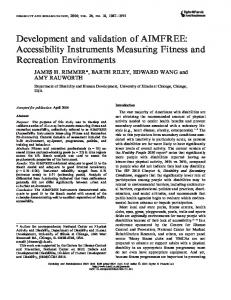
2. Methodology for deriving convection correlations The experiments in the full-scale environmental chamber followed a methodology based on the conservation of energy at room surfaces. This methodology is similar to the methodology used by Khalifa and Marshall [9], Spitler et al. [10], and Awbi and Hatton [4]. All of these studies developed convection correlations for application with different heating and cooling systems that create relatively uniform room temperature distribution. Fig. 2 presents the conservation of energy at internal room surfaces, under steady-state heat flow, for determining the convective heat fluxes. The conservation of energy results in the convective heat flux (qconvective) as a function of the radiative (qradiation) and conductive fluxes (qconduction): qconvective ¼ �qradiation � qconduction
(1)
The conductive heat flux qconduction is calculated based on the thermal resistance of the wall and the temperature difference between the internal wall surface and the outdoor air. For
Fig. 2. The energy balance at an internal wall surface used to develop convection correlations.
A. Novoselac et al. / Energy and Buildings 38 (2006) 163–173
surfaces with small thermal resistances, the conductive heat flux was directly measured using a system of heat flux meters. Furthermore, the radiative heat flux qradiation is calculated based on the surrounding wall surface temperatures and view factors using a computer program for building energy and airflow (BEAF) simulations [11]. For this calculation, all of the enclosure surfaces need the long-wave emissivity (e) and temperatures (T) as input data. To precisely calculate radiative heat fluxes, the enclosure was divided into a large number of smaller sub-surfaces where the temperature of each sub-surface was precisely measured. Knowing the convective heat flux (Eq. (1)), surface (Tsurface), and air (Tair) temperatures, the convection coefficient (h) is calculated as: � � � qconvective � �: h ¼ �� (2) Tsurface � Tair � Based on Eq. (2), calculations of h need measured temperatures and heat flux data. This way calculated convection coefficient often combines both natural and forced convection effects. For example, the jet velocity at the floor surface is very low, but it still produces effects of forced convection on a large portion of the floor surface, which is combined with natural convection effects created by surface-air temperature difference. In our study, the correlation for floor surfaces is developed as a function of supply volume airflow rate, normalized by room volume. Spitler et al. [12] provided justification for this approach. Their study has shown that the heat transfer coefficient is relatively insensitive to supply jet velocity and supply jet momentum. Furthermore, Fisher and Pedersen [7] suggested that convection correlations require a physical understanding in terms of the room control volume, rather than in terms of the surface boundary layer. Therefore, for the floor surface, h is given as a function of the room number of air changes per hour (ACH). A simplified relation between h and ACH can be obtained by considering general relationships between Nusselt (Nu), Prandtl (Pr), and Reynolds numbers (Re). These relations define forced convection along a plate [13]: for laminar flow : Nu ¼ CL Re1=2 Pr 1=3 ;
(3)
for turbulent flow : Nu � CT Re4=5 Pr 0:43 ;
(4)
Nusselt and Reynolds numbers can be expressed as functions of room volume (Vroom) and supply volume airflow rate (Vsupply): Nu ¼ Re ¼
1=3 hVroom
kair Vsupply 1=3
(5) (6)
vair Vroom
Substituting Eqs. (5) and (6) into expressions (3) and (4) and substituting values for constant Prandtl number (Pr),
165
air conductivity (kair), and dynamic viscosity (vair ), the following expressions are obtained for laminar and turbulent flows: ¼ cL � ACH1=2
hforced
laminar
hforced
turbulent
(7)
1=5 ¼ cT � Vroom � ACH4=5
(8)
1=5
The room volume term (Vroom ) in Eq. (8) is usually neglected, so the forced convection at a flat room surface is a function of volume flow rate [7]: hforced ¼ c � ACHm
(9)
There are a large number of previously developed convection correlations for natural convection in a room. Therefore, the intention of this study is to identify an appropriate existing correlation for wall surfaces in a room with displacement ventilation. Alamdari and Hammond [5], Awbi and Hatton [4], and Min et al. [6] developed natural convection correlations typically used in building design and research practice. All these correlations express natural convection as a function of temperature difference between the wall surface and air (DT = Tsurface � Tair). In addition, some correlations use a characteristic length scale, such as height of the vertical surfaces or hydraulic diameter for horizontal surfaces. In this study, the local air temperature (Tair_local) is used. It is defined as the average temperature of the air layer close to the surface. Karman’s correlation for the ratio between boundary layer thickness and characteristic length [14] shows that for typical room dimensions and temperature differences (DT) boundary layer thickness is almost always Tair.
A. Novoselac et al. / Energy and Buildings 38 (2006) 163–173
Analysis of the overall results shows that the largest difference between measured and predicted heat flux (by Eq. (13)) is Tair).
171
Table 3 Correlations for natural convection developed by Awbi and Hatton [4] Surface and regime
Convection correlation
Floor when Ts > Tair or ceiling when Ts < Tair Ceiling when Ts > Tair or floor when Ts < Tair Walls
2.175�DT0.308/D0:076 h 0.704�DT0.133/D0:601 h 1.823�DT0.293/D0:121 h
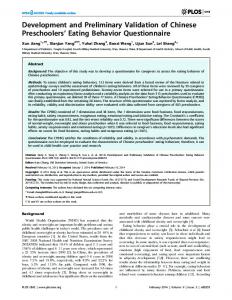
5.3. Validation of existing natural convection correlations To account for the convective heat transfer at the other room surfaces besides the floor, existing convection correlations may be appropriate if a rigorous validation process justify their use. Due to the low air velocities in rooms with DV, the assumption is that the airflow at room surfaces is driven by the temperature difference between the local air and surface. To confirm this assumption, DV was ‘‘on’’ and ‘‘off’’ in tests conducted in environmental chamber. In both types of test, the Grashof (Gr) and Reynolds (Re) numbers were calculated in the vicinity of the surfaces to obtain the ratio Gr/Re2. In all experiments, with and without DV, the ratio Gr/Re2 for vertical surfaces was considerably above 1. This ratio indicated that natural convection is the dominant heat transfer phenomenon at vertical wall surfaces in rooms with a DV diffuser. Therefore, additional test measurements were conducted to determine which of the three previously developed natural convection correlations: (1) Alamdari and Hammond [5], (2) Awbi and Hatton [4], or (3) Min et al. [6], was the most appropriate for application at vertical surfaces in rooms with DV. Fig. 10 shows the result of these tests. In all of the correlation equations, the height of the chamber walls (2.35 m) was the characteristic length. Fig. 11 show that correlations developed by Awbi and Hatton [4] have better agreement with measured results than correlations developed by Alamdari and Hammond [5] and Min et al. [6]. The most likely reasons for these results are the experimental set-ups used in the previous and current
Fig. 11. Validation of the existing natural convection correlations with the measured data for vertical wall surfaces in a room with DV.
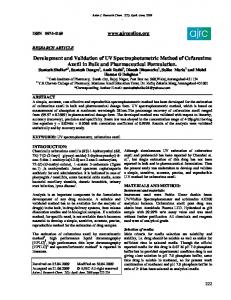
studies. Awbi and Hatton’s natural convection correlations were developed in a similar environmental chamber to the one used in the present study, while the Alamdari and Hammond natural convection correlations were created based on a series of experiments that were primarily conducted with isolated surfaces. The correlations developed by Min et al. were also developed using a full-scale testing room, relatively similar to our environmental chamber. The slightly better performance of the Awbi and Hatton’s correlations than Min et al.’s correlation is probably due to the definition of the air reference temperature. The Awbi and Hatton’s correlations use local air temperature at 0.1 m from the wall surface as the reference temperature, which is the same reference temperature used in our experiments presented in Fig. 11. On the other hand, Min et al. defined the reference temperature as the temperature in the central part of the room (1.5 m above the floor). Considering the validation results, Awbi and Hatton’s correlations are recommended for the calculation of natural convection in rooms with DV. Table 3 presents Awbi and Hatton’s correlations for different surface types and flow regimes. For wall surfaces, the temperature stratification in the air could lead to heat transfer from the lower part of the wall to the air and from the air to the upper part of the wall. Fig. 12 shows the result of experiments with this phenomenon on the left wall that represents an internal wall in a room. In situation like this, use of the equations from Table 3 with average values for surface and air temperatures (DT) can create a certain error in the convection coefficient (h) calculation. In the example presented in Fig. 12, the difference between the measured and calculated h was >40%. However, total heat flux at surfaces like this is small (19 W in the presented example) and has small effect on overall energy flow in rooms. It is much more important that
Fig. 12. Measured temperature and heat fluxes in the experimental facility with the hot window surface and the internal wall on the opposite side.
172
A. Novoselac et al. / Energy and Buildings 38 (2006) 163–173
the convection correlation predicts precisely the heat flux at surfaces with large DT, which create large total heat fluxes. At surfaces with a large DT heat fluxes have the same direction in the lower and upper part of the surface and the equation from Table 3 is appropriate. In the experiment presented in Fig. 12, the right wall surface represents a hot external window surface. For this surface, the measured flux is 165 W while the equation from Table 3 calculates 150 W. For ceiling surfaces, the temperature stratification with DV often causes higher local air temperatures than ceiling surface temperatures as shown in Fig. 1. At these surfaces, the convective heat transfer is similar to the one with cooled ceiling panels. Therefore, the correlation for cooling ceiling (CC) panels [11] is recommended at these surfaces when Ts < Tair. The correlation for cooled ceiling has the following form: hcooled
ceiling
¼ 2:12 � DT 0:33 :
(14)
When the ceiling surface has only a slightly lower temperature than the local air, Eq. (14) gives similar h values as the Awbi and Hatton’s correlation for ceilings, where Ts < Tair. Therefore, for these surfaces, both correlations are appropriate. In the case when Ts > Tair, such as surfaces close to lamps or ceiling surfaces in rooms with large solar heat gains, Table 1 gives the appropriate Awbi and Hatton’s correlation. 5.4. Recommended convection correlations for all envelope surfaces in a room with DV Table 4 summarizes the recommended convection correlations for all different surfaces in a room with displacement ventilation. The recommended correlations include newly developed correlations and the correlations developed by Awbi and Hatton [4] and Novoselac [11]. All of these correlations use the local air temperatures defined as the air temperature in the surface vicinity (0.1 m from the surface). Models developed by Mundt [2], Rees and Haves [3], and boundary condition models used in CFD programs [11,18] can calculate temperature distribution and local air Table 4 Recommended convection correlations h for a room with displacement ventilation Surface
Regime
Floor
Ts > Tair
Convection correlation "� # �6 � �6 1=6 jTs �Tsupply j 0:8 2:175�DT 0:308 þ � 0:48 � ACH DT D0:076
Ts < Tair
"�
Ts > Tair CC panel T