the LGN (Daniels et al., 1978) and of simple cells in the striate cortex (Blakemore ... onstrated behaviorally with the jumping-stand method (Mitch- ell et al., 1976).
The Journal
Development of Spatial and Temporal Visual Cortex of the Cat Thomas
Zumbroich,
Selectivity
of Neuroscience,
August
1988,
8(8): 2713-2728
in the Suprasylvian
David J. Price,a and Cohn Blakemore
University Laboratory of Physiology, Oxford OX1 3PT, England
We have studied the development of the spatial and temporal properties of neurons in the medial bank of the suprasylvian visual cortex (PMLS) in kittens aged between 9 d and 8 weeks. Quantitative measurements were made of the responses to drifting high-contrast gratings of optimum orientation and direction of motion, but varying in spatial and temporal frequency. The spatial resolution (“acuity”) of cells increased rapidly and was fully mature (over 2 cycles/deg for the best cells) at 3 weeks of age. The optimum spatial frequency also tended to improve and reached adult values (around 0.5 cycles/deg for the best cells) at about the end of the third week. In younger kittens, the spatial resolution of neurons was not obviously correlated with the eccentricity of their receptive fields, but in older animals acuity was clearly elevated for receptive fields in the central visual field. The proportion of “low-pass” cells (showing no obvious attenuation of response for gratings of low spatial frequency) decreased with age and simultaneously there was a slight increase in the mean spatial bandwidth of “bandpass” cells. Responses to drifting sinusoidal gratings were generally dominated by an unmodulated elevation of discharge at all ages. In tests with stationary, contrast-modulated gratings presented at different spatial positions, cells in the youngest kittens behaved nonlinearly and showed mainly an unmodulated increase in discharge, whereas in older kittens, as in adult cats, most neurons responded to contrast-modulated gratings with a small, phase-dependent response at the temporal frequency of modulation and a larger component at twice the fundamental frequency. None of the cells recorded at any age had a true “null position.” As in adult PMLS, the widths of receptive fields in kittens were, on average, about twice the size of the preferred spatial period (4 times the preferred bar width). At all ages, therefore, neurons in PMLS resembled striate complex cells with respect to the nonlinearity of their responses and the spatial structure of their receptive fields. The preferred temporal fre-
Received Mar. 24, 1987; revised Oct. 20, 1987; accepted Nov. 27, 1987. These experiments were funded by a Programme Grant from the Medical Research Council to C.B. and by grants from the Science and Engineering Research Council and the Wellcome Trust to D.J.P. and C.B. T.Z. received support from the German National Scholarship Foundation, Bonn (FRG), and Wolfson College, Oxford, D.J.P. is a Beit Memorial Fellow. We thank John Eldridge, Duncan Fleming, John Mittell, and Pat Cordery for technical help. May & Baker Ltd. kindly provided the gallamine triethiodide (Raxedil) used in these experiments. Correspondence should be addressed to Cohn Blakemore, University Laboratory of Physiology, Parks Road, Oxford OX1 3PT, UK. ” Present address: Department of Zoology, University of California, Berkeley, CA 94720. Copyright 0 1988 Society for Neuroscience 0270-6474/88/082713-16$02.00/O
quency and high-temporal-frequency cutoff also improved, on average, during the first 3 weeks of life, and the range of temporal frequencies over which cells responded continued to increase until at least 8 weeks. Although the lowspatial-frequency inhibition that creates spatial bandpass characteristics probably depends on cortical mechanisms, the postnatal development of both temporal and spatial resolution might well be limited by maturation at the level of the retina.
The use of drifting and stationary gratings has provided important information about the spatial structure of the receptive fields of neurons at various levels of the adult visual pathway, from retinal ganglion cells (e.g., Enroth-Cugell and Robson, 1966) to simple and complex cells of areas 17 and 18 (e.g., Movshon et al., 1978a, b). The responses of neurons to drifting gratings of different spatial frequencies can be interpreted in terms of the dimensions and distribution of spatially summating excitatory and inhibitory components within their receptive fields. The majority of cells at all levels of the retinogeniculocortical pathway have spatial frequency tuning functions with bandpass characteristics: the occurrence of peak responsiveness at a certain optimal spatial frequency and the decline in response at high spatial frequencies depend on the excitatory component or components in the receptive field, while the degree of attenuation of response at lower spatial frequencies reflects the presence and strength of a larger antagonistic area or areas (e.g., Enroth-Cugell and Robson, 1966). In general, low-frequency attenuation becomes progressively greater from retina to lateral geniculate nucleus (LGN) to cortex, suggesting a successive reinforcement of surround antagonism (see Maffei and Fiorentini, 1973). The temporal patterns ofdischarge to a stationary grating, modulated in contrast at different positions across the receptive field, can also provide information about whether summation within the excitatory and inhibitory regions is linear or nonlinear (Hochstein and Shapley, 1976a, b). The posteromedial lateral suprasylvian area (PMLS) is an extrastriate visual zone that receives direct input from the C-laminae of the LGN and the pulvinar/lateralis posterior complex, as well as association input from other areas of visual cortex (see Sherk, 1986). Neurons in PMLS of the adult cat have relatively large receptive fields, usually show a preference for moving stimuli, and are very often selective for one direction of motion (e.g., Hubel and Wiesel, 1969; Wright, 1969; Spear and Baumann, 1975). Analysis with grating stimuli has shown that cells in this region are nonlinear in spatial summation and have receptive fields consisting of a number of smaller “subunits” that determine the optimal spatial frequency (Morrone
2714
Zumbroich
et al. - Development
of Spatial and Temporal
Selectivity
in PMLS
et al., 1986; Zumbroich and Blakemore, 1987). In this respect they resemble complex cells in areas 17 and 18 (Movshon et al., 1978b), but their spatial resolutions and optimal spatial frequencies are relatively low, indicating that the subunits within the receptive field are larger than those of striate complex cells. Their spatial properties may, then, be determined by direct or indirect input from geniculate Y-cells or W-cells, rather than by input from X-cells, which have smaller receptive fields (Stone, 1983; Berson, 1985; Lee et al., 1986). A number of studies of the visual cortex of kittens have established that there is rapid maturation of the orientation and direction selectivity of neurons during the first few weeks of postnatal life, not only in areas 17 and 18 (e.g., Blakemore and Van Sluyters, 1975; Buisseret and Imbert, 1976; Bonds, 1979; Albus and Wolf, 1984; Braastad and Heggelund, 1985; Blakemore and Price, 1987) but also in PMLS (McCall et al., 1985; Price et al., 1988). However, only one study, on the striate cortex, has addressed the question of the development of selectivity for the spatial content of the visual image (Derrington and Fuchs, 198 1). The spatial resolutions and optimal spatial frequencies of cells in area 17 increase gradually over at least the first 6 weeks of postnatal life and there is a concomitant decrease in bandwidths. Now the spatial resolution of many cells in the striate cortex is so high that it is likely to be determined by input from X-cells. It would be interesting to learn whether the time course of development of spatial properties is similar in extrastriate areas, such as PMLS, where the maximum resolution of cells in the adult is lower than that in striate cortex (Berardi et al., 1982; Blakemore and Zumbroich, 1985; Di Stefano et al., 1985; Morrone et al., 1986; Zumbroich and Blakemore, 1987) and where spatial properties may be determined by Y-cell and W-cell input (Zumbroich and Blakemore, 1987). We have therefore studied the postnatal development of spatial selectivity in PMLS. The responses of cortical cells to drifting sinusoidal gratings can also be critically dependent on the temporal frequency of the stimulus (Tolhurst and Movshon, 1975; Movshon et al., 1978~; Morrone et al., 1986; Zumbroich and Blakemore, 1987). It seemed particularly important to investigate the development of temporal properties in the suprasylvian visual cortex, since neurons in this region are thought to play a role in the visual processing of motion. In adult cats most cells in PMLS have broad temporal tuning, and some respond up to extremely high temporal frequencies and hence to very high velocities of movement (Zumbroich and Blakemore, 1987). Our findings indicate that the spatial properties of cells in PMLS, like their direction selectivity (Price et al., 1988) improve in parallel with maturation of the striate cortex, though perhaps over an even shorter period. Some aspects of the temporal characteristics of cells may continue to develop beyond 3 weeks of age. Some of the results presented here have been published previously in abstract form (Blakemore et al., 1986; Price and Zumbroich, 1986).
Materials Animals
and Methods
Nine kittens aged between 9 d and 8 weeks were used in these experiments. Their ages at the start of the experiment were 9, 10, 12, 15, 16, 19, and 22 d, and 8 weeks (2 kittens). All animals were obtained from an isolated laboratory colony, where they were kept in an artificial daynight cycle of 18 hr light-6 hr darkness.
Surgical preparation Anesthesia was induced with ketamine hydrochloride (22 mg kg- I, i.m.) and continued with the steroid anesthetic Saffan (alphaloxone/alphadolone acetate, i.v., as required). Atropine sulfate (100 pg, s.c., with additional doses if needed) was given to reduce salivation, Streptopen (procaine penicillin and dihydrostreptomycin sulfate, 0.1 ml, i.m.) as antibiotic prophylaxis, and prednisolone acetate (2.5 mg, i.m.) to minimize cerebral edema. During the actual recording, the animals were paralyzed by an intravenous infusion of Flaxedil (gallamine triethiodide, 10 mg kg-’ hr-I) in Ringer’s solution and anesthetized by hyperventilation (at 33 strokes/ min) through a tracheal cannula with a mixture of about 78% N20, 20% 02, and 2% CO,. The electrocardiogram and electroencephalogram (EEG) were continuously displayed on an oscilloscope for assessment of the state of anesthesia, which was judged to be satisfactory if there was virtually continuous slow-wave activity in the EEG and if mild noxious stimulation, such as pinching a paw, failed to desynchronize the EEG or change the heart rate. When necessary, Saffan was added to the intravenous infusion to supplement the N,O and maintain the state of anesthesia; we saw no obvious effect of such low additional doses of Saffan on the responsiveness of neurons in the suprasylvian cortex. Expired CO1 was monitored with a gas analysis meter (Beckman LB2) that drew samples from inside the tracheal cannula, and the percentage of CO, in the inspired gas mixture was adjusted to maintain the end-expiratory CO, at a level similar to that measured before paralysis, always about 4.5-5%. Rectal temperature was monitored and maintained at 37.5”C. After application of local anesthetic to all pressure points, the animal was positioned in a stereotaxic frame (Eldridge, 1979b) that left the visual field unoccluded and permitted the head to be rotated to any desired angle. Complete stability of the head was achieved by cementing a bolt to the skull and attaching it to the stereotaxic frame.
Electrophysiological
recordings
A small craniotomy of about 4 mm in diameter was made over the posterior part of the middle suprasylvian sulcus, always on the right side. All penetrations lay in coronal planes located between stereotaxic coordinates Al and A5 and ran through the medial bank of the suprasylvian sulcus, just rostra1 to the point at which the sulcus turns laterally to become the posterior suprasylvian sulcus, and thus within the area defined as PMLS by Palmer et al. (1978). We positioned a stepping-motor microdrive over the craniotomy and lowered a tungsten-in-glass microelectrode (Merrill and Ainsworth, 1972) with an exposed tip about 10 pm long, through a tiny durotomy. To prevent pulsations and drying, the recording site was sealed with agar and paraffin/petroleum jelly. Spikes were conventionally amplified, displayed on an oscilloscope screen, and used to trigger pulses that were led to a PDP 1 l/34 computer for counting. Penetrations in kittens were angled about 25“ medially in the coronal plane so that they ran obliquely through the cortex of the medial bank, rather than parallel to the surface, in an attempt to sample from all cortical laminae. We aimed to isolate single units at regular intervals of about 100 urn. The overall samnle included cells from all layers of the cortex (except that very few cells were ever recorded in layer I). As in the adult (Zumbroich and Blakemore, 1987) there were no striking differences in the stimulus specificities ofcells recorded in different layers of the cortex or at different anteroposterior coordinates. We therefore felt justified in pooling data from all recording sites except when specifically comparing the spatial resolutions of receptive fields at different eccentricities (Fig. 2).
Optical preparation The pupils were dilated by means of topical application of atropine sulfate, and the lids and the nictitating membranes retracted with phenylephrine hydrochloride. Zero-power contact lenses protected the corneas, and artificial pupils of 3 mm diameter were used to improve optical quality. We judged the refractive state of each eye by direct ophthalmoscopy and used spherical spectacle lenses to focus the eyes on a dome or a tangent screen 28.5 or 57 cm, respectively, from the eyes. In animals of about 2 weeks or older, the projection of the area centralis of each eye could be plotted on the screen by means of a reversible ophthalmoscope (Eldridge, 1979a). In kittens younger than about 2 weeks, persistent hyaloid vascularization and the reticular network at the back of the lens made it impossible to assessthe position of the area centralis
The Journal
with accuracy, and so only the optic disc of each eye could be plotted. In these very young animals, the position of the area centralis relative to the projection of the center of the optic disc was calculated from Olson and Freeman’s (Fig. 2, 1980) data on the change in separation of these landmarks during growth of the eye.
Visual stimulation and data collection Qualitative data collection We initially judged the responses of each isolated neuron by listening to its discharges on an audio monitor. We plotted the receptive field through each eye as a “minimum response field” (Barlow et al., 1967), i.e., a rectangle touching the extreme boundaries of the central area within which a moving light bar or spot produces a response. (For a simple cell in the striate cortex, such a plot would define the “discharge center,” which corresponds well to the central summating zone of the receptive field, Kulikowski and Bishop, 198 1.) After plotting the receptive field we systematically investigated the response properties through each eye by back-projecting various conventional stimuli, including flashed and moving bars and spots of light of various sizes, on the translucent dome or the tangent screen. We assessed the ocular dominance (Hubel and Wiesel, 1962) and then determined other parameters, including response quality, degree of habituation, preferred direction and preferred velocity, through the dominant eye (usually the contralateral eye) alone.
Quantitative assessments We performed quantitative tests in essentially the same way as in adult cats (Zumbroich and Blakemore, 1987), the only differences being that we often increased the interstimulus interval to allow for the stronger habituation, and occasionally presented stimuli up to 25 times each (more often than the 10 trials used in adult cats) in order to compensate for the reduced responsiveness and greater variability of discharge of neurons in young kittens. After qualitatively characterizing a neuron’s response properties, we centered a Joyce display screen (20” x 24”) on the receptive field at a distance of 57 cm from the animal. This display was larger than the entire response field for every neuron analyzed, and, in most cases, covered a substantial area around the response field. Gratings of sinusoidal luminance profile were generated on the screen (which had a white P4 phosphor and a mean luminance of 280 cd.m ?) and spikes were counted under the control of the computer. In all experiments the contrast was held constant at 0.80 [contrast = (L,,,,, - &,,,,,)I&,,, + L ,,,,,, ), where L,,,,, is the maximum luminance and L ,,,,,1 the minimum luminance of the spatial sinusoid]. Spatialfrequencyselectivity.First we measured the responses of each cell to drifting gratings of varying orientation and direction of motion (the results of those tests have been reported elsewhere; Price et al., 1988). Then, for the determination of a spatial frequency “tuning” curve, the computer presented gratings of fixed contrast (OX), optimum orientation, and optimum direction and temporal frequency of drift, varying in spatial frequency in steps of 0.03 cycles/deg of visual angle for spatial frequencies below 0.4 cycles/deg, and in larger steps for higher spatial frequencies. Spatial frequency was pseudorandomly varied in an interleaved series, each presentation consisting of 2 periods of the temporal frequency of drift (i.e., 2 cycles of the grating). Each spatial frequency was usually presented 10-25 times, as was a blank trial of the same duration with the screen at the same mean luminance, but with no grating present. The computer could assess the cell’s firing in terms of either the mean overall change of discharge or the Fourier component modulated in synchrony with the passage of bars of the drifting grating. The responses of these neurons at the optimal spatial frequency, just as in the adult cat (Zumbroich and Blakemore, 1987), were nearly always dominated by the unmodulated Fourier component f, and we therefore generally assessed the responses on the basis of this overall elevation of discharge, rather than on that of any other Fourier component of the histogram. In order to establish a threshold above which data points were included in curve-fitting to determine tuning characteristics and so on, we employed a statistical criterion (Zumbroich and Blakemore, 1987), rather than simply subtracting mean background discharge from response. A cell was considered to respond to a particular stimulus when the spike rate, averaged over all test trials, was elevated more than 2 SEs above the mean background measured during the same number of blank trials with no grating present. This criterion is close to a signifi-
of Neuroscience,
August
1988, 8(8) 2715
cance level of p = 0.05 when the variance of the response is similar to that of the background, which is usually the case near threshold. Linearity test.We assessed linearity of spatial summation with Hochstein and Shaalev’s (1976a. b) version of the “null nosition test.” The contrast of a staiionary sine-wave grating was modulated sinusoidally in time, between zero and 0.8 contrast, at the optimum temporal frequency for the cell. The computer produced a set of 12 such contrastmodulated gratings of optimal spatial frequency and orientation, but varied in position in 12 equal 30” steps ofphase angle across the receptive field. The 12 phase positions and a blank trial with no grating were each presented a total of 10 times (2 temporal cycles each time) in pseudorandom order. For the spike counts, the computer calculated the mean discharge frequency Cr;,Fourier component), as well as the amplitude of modulation of the cell’s discharge rate at the temporal frequency of modulation of the grating (fundamental frequency = f,), and at twice that frequency (second harmonic = f,). Temporalfrequencyselectivity.We measured temporal characteristics by presenting a grating of the optimal orientation, spatial frequency, and direction of motion, but at different temporal frequencies of drift, from 0.16 to 41 Hz, in octave steps. Each stimulus was presented at least 10 times for 2 or 4 temporal cycles. Other details of the assessment were the same as for the measurement of spatial selectivity.
Histology At the end of the electrophysiological recording session, the animal was given a lethal intravenous injection of Nembutal and perfused transcardially with Ringer’s solution followed by 10% formalin. The brain was removed and allowed to sink in 30% sucrose solution, and 50 pm coronal sections were cut on a freezing microtome. Sections containing the track were stained with cresyl violet. Electrode penetrations were identified from small electrolytic lesions (3 PA for 6 set, electrode tip negative) made along each track; each recording site was localized and assigned to a particular cortical layer. Since no unequivocal physiological or cytoarchitectonic differences have been reported between PMLS and the adjacent posterolateral lateral suprasylvian area (PLLS), we simply took the fundus of the middle suprasylvian sulcus as the border between the 2 areas, as in previous studies (e.g., Palmer et al., 1978). All the neurons reported here were recorded in the medial bank of the middle suprasylvian sulcus.
Results Onset of visual responsiveness in PMLS of kittens We have described elsewhere the emergence of visual responsiveness, selectivity for orientation and direction of motion, and functional architecture in PMLS (Price et al., 1988), and will merely summarize the findings here. In very young kittens, less than 12 d of age, much of PMLS appeared to be unresponsive to any of our stimuli (conventionally projected or generated on the display oscilloscope). Most neurons were identified only by occasional spontaneous spikes or by an injury discharge as the electrode was advanced. In the 9 d animal, only one clearly responsive unit was isolated, in layer IV, during 3 long penetrations through PMLS. In the lo-d-old kitten, we found small clusters of responsive cells, separated by unresponsive zones; they were all located in the lower cortical layers (IV, V, and VI). At 12 d of age, a substantial fraction of neurons recorded were responsive, some of them located in the superficial layers; and by the end of the third week, virtually every cell isolated could be visually excited. In general, cells in PMLS of young kittens, even those that responded to visual stimuli, had little or no spontaneous activity. Responses to high-contrast drifting gratings of optimum orientation, direction of motion, spatial frequency, and temporal frequency were also weak compared to those of cells in the adult (see Price et al., 1988). At all ages we attempted to isolate units in steps of about 100 pm along each track. Every cell was tested with a wide repertoire of conventionally projected stimuli and all responsive units were then studied with grating patterns. Not all responded reliably
2716
Zumbroich
et al. - Development
of Spatial
and Temporal
Selectivity
in PMLS
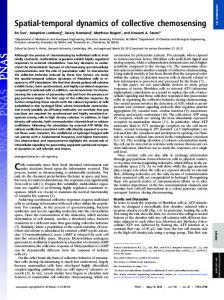
enough to permit quantitative analysis; those that did were first tested with drifting and modulated gratings to assessdirection and orientation selectivity (Price et al., 1988). Orientation and direction were then optimized for the analysis of spatial and temporal properties. All units that were held long enough for this extensive protocol to be completed are reported here. Responses to stationary flashed stimuli We assessed by ear the responses to stationary spots and bars of various sizes flashed at different positions in the receptive field. In all kittens older than 12 d, the proportion of visually responsive cells that were clearly responsive to stationary as well as moving stimuli was very close to that in adults (about 40%; Zumbroich and Blakemore, 1987; Price et al., 1988). In the youngest kittens, aged lo-12 d, a smaller fraction (4/l 7 = 24%) gave responses that could easily be detected by ear for flashed stimuli (although the subsequent quantitative analysis, involving averaging of responses to many presentations, revealed that almost 40% responded reliably to stationary flashed gratings). In these very young animals we found that cells responded only at light onset (“ON response”) or offset (“OFF response”), whereas in animals older than 12 d (as in adults) a limited proportion (up to 20% of the responsive cells) responded to both light onset and offset (“ON-OFF response”). None of the cells recorded at any age had spatially separated ON and OFF regions, characteristic of simple cells in areas 17 (Hubel and Wiesel, 1962) and 18 (Tretter et al., 1975). Development of spatial selectivity The results reported here are based on a sample of 95 neurons recorded in kittens aged between 9 d and 8 weeks, for which a full quantitative analysis was performed (for the exact sample sizes at each age, see figure legends). They are compared with results from 53 cells recorded in PMLS of adult cats (Zumbroich and Blakemore, 1987). As in adult PMLS, most cells in kittens that were excited by single spots or bars also responded to drifting gratings. For every well-isolated, visually responsive neuron we attempted to perform a full analysis of responses to drifting, high-contrast gratings generated under computer control on the display oscilloscope. The majority of visually responsive cells, even at the youngest ages, were selective for one direction or axis of motion (Price et al., 1988) and we therefore optimized the orientation and direction of drift of the grating for the determination of spatial and temporal properties. Spatial frequency tuning functions Figure 1 shows spatial frequency response functions of representative units recorded in PMLS of kittens at different ages. In Figure 1, A, B, we have plotted both the mean spike rate (i.e., the f, Fourier component of the discharge pattern-filled circles) and the amplitude of modulation of the discharge at the temporal frequency of the drifting grating (fundamental, or f,, Fourier component-open circles). The cell illustrated in Figure 1A was recorded in a 12-d-old kitten; it had no spontaneous activity, and gave weak but reliable responses to drifting gratings. Just like the great majority of cells in PMLS of adult cats (Zumbroich and Blakemore, 1987) this cell showed spatial bandpass characteristics; it had a clear optimum spatial frequency (0.16 cycles/deg) and responses declined in strength both above and below this optimum, so that a bandwidth at half the response amplitude (0.3 log units below the peak) could be measured.
The second example (Fig. 1B) is of a cell recorded in PMLS of a kitten aged 15 d, whose responses decreased with increasing spatial frequency, but were not attenuated at the lowest spatial frequency presented (0.03 cyclesideg); this neuron was therefore classified a “spatial low-pass cell,” a type that is also present, but not common, in adult PMLS (Zumbroich and Blakemore, 1987). The one visually responsive unit isolated in the 9 d animal had a low-pass spatial tuning function. For these 2 cells (Fig. 1, A, B), just as for units in adult PMLS (Zumbroich and Blakemore, 1987), the major component ofthe response to drifting gratings was an unmodulated elevation of discharge. We chose to use the mean firing frequency, or f, component, to provide a description of the response to different spatial frequencies, rather than using the amplitude of modulation of discharge at the temporal frequency of the drifting grating. Thisf, component was generally low and often showed considerable variability, even at very low spatial frequencies. In this respect, cells in kitten PMLS behaved highly nonlinearly. The cell of Figure 1C, recorded in a 16-d-old kitten, had the highest optimum spatial frequency (almost 0.5 cycles/deg) and high-frequency cutoff (“acuity”) of any neuron we studied at this age. The maximum response was still relatively small (less than 7 spikes/set) but quite consistent, and so the elevation in mean discharge rate to spatial frequencies as high as 1.2 cycles/ deg was highly significant. The criterion acuity of this cell (the frequency for which the tuning curve fell to 2 SEs above the mean spontaneous discharge; see Zumbroich and Blakemore, 1987) was nearly 1.5 cycles/deg. The final example (Fig. 1D) shows the responses of a neuron from an 8-week-old kitten that responded with firing rates comparable to those typically seen in adults, and with very little variability. Its optimal spatial frequency was relatively low, but was well within the adult range. Spatial resolution and optimum spatial frequency In adult PMLS there is, despite great scatter, a significant negative correlation between the eccentricity of the receptive fields of cells and their high-spatial-frequency cutoffs: the closer the receptive field center is to the area centralis, the higher its acuity is likely to be (Blakemore and Zumbroich, 1985; Di Stefano et al., 1985; Zumbroich and Blakemore, 1987). We were interested to know whether this regional variation in acuity develops only gradually. In Figure 2A we have plotted the acuities ofthe pooled sample of units from kittens 9-l 2 d old against the eccentricity of their receptive-field centers. Comparison with the linear regression line calculated for data from adult cats (interrupted line) reveals that, in these very young animals, all cells with receptive fields in the central 30” had acuities lower than the average acuity of cells with fields at the same eccentricity in adult animals, and there was no consistent change of acuity with eccentricity. For comparison, the same analysis is shown for the sample from PMLS of 8-week-old kittens (Fig. 2B). Some cells with receptive fields near the area centralis had spatial resolutions close to the highest values found in adult PMLS, and there was a significant negative correlation between eccentricity and cutoff spatial frequency (p < 0.001) as in the adult. At intermediate ages (15-22 d), acuity was not significantly correlated with eccentricity, but the mean acuity of cells with receptivefield centers located within 25” of the area centralis was clearly higher than that of neurons with receptive-field centers located further peripherally. Although the position of the area centralis in the youngest kittens had to be inferred from the location of
The Journal
A
of Neuroscience,
August
1988,
8(E) 2717
B 15 12
days
days
SA
I
I
I”,
0.03 0.05 SPATIAL
+ 2 S.E.
,,I
0.1
FREQUENCY
0.3 (c/deg)
D
C
16
days
56
4 ,
30-
5 3
days
50 -
f 10:
1
0.5
53-
0.3 i-A
Figure I. A, Spatial frequency tuning curve of a unit recorded in PMLS of a I2-d-old kitten (eccentricity of the geometric center of the receptive field = 6”). For this and B-D, each symbol represents the mean value of discharge (in spikes/set) for 10 presentations of 2 cycles of a grating drifting at a temporal frequency of 1.5 Hz. Filled circles indicate the overall elevation of discharge (J;), and unfilled circles plot the component of the response modulated in time with the drifting grating (fundamental, or f, component). In this and other figures, the error bars correspond to f 1 SE; for graphical convenience, only one SE is shown in some cases, and no error bars are plotted when the SE is smaller than the radius of the symbol representing the mean. The smooth curve was fitted by eye. This cell had no spontaneous activity (&I). The bandwidth (B W = 1.16 octaves) at half-amplitude is indicated by filled urrows. B, Spatial frequency tuning function of a unit recorded in PMLS of a 15-d-old kitten (eccentricity = 9.5”). It was classified as a spatial low-pass cell because it showed no low-spatial-frequency attenuation in the range tested, even down to 0.03 cycles/deg. The arrow shows the mean level of spontaneous activity (SA = 0.2 f 0.14 spikes/set), and the interrupted line lies at a threshold criterion equal to mean background discharge plus 2 SE, above which f, responses were considered to exceed the background. C, Spatial frequency tuning function of a unit recorded in a 16-d-old kitten (eccentricity = 14”). This cell had the highest optimum spatial frequency (0.48 cycles/deg) and acuity (1.37 cycles/deg) that we found at this age. Its spontaneous activity was 0.4 (kO.15) spikes/set and its spatial bandwidth 1.27 octaves. D, Spatial frequency response function of a unit recorded in an 8-week-old kitten (eccentricity = lo”). This neuron responded considerably more vigorously than those in younger animals and more reliably too (as indicated by the small error bars, which were less than the radius of the filled circle for 2 data points). Its spontaneous activity was 1.7 (kO.5) spikesfsec and its spatial bandwidth 2.27 octaves.
the optic disc (Olson and Freeman, 1980), this could only lead
to a systematic (and small) error in the assumed position of all receptive-field centers for each individual animal; any such error could not, therefore, account for the lack of correlation between eccentricity and spatial resolution found in all of the youngest kittens. Even though the acuity of cells with peripheral receptive fields does not change substantially with age, the mean acuity of the total sample at each age (all samples from a similar range of eccentricities) appeared to increase during the first 3 weeks of
postnatal life (open triangles in Fig. 3). To investigate further the development of spatial resolution we have plotted the highest acuity found in the sample of cells from each kitten versus age. The resulting graph (Fig. 3, filled squares) indicates that the highest acuity in PMLS rises sharply between 9 d and the end of the third week of life when it reaches the adult value of just over 2 cycles/deg. The rise in the mean and best values of acuity was not accounted for by any progressive increase with age in the proportion of centrally placed receptive fields in the sample. In any case, the lack of correlation between acuity and eccen-
2718
Zumbroich
et al. - Development
A
of Spatial
9-12
0.5
and Temporal
Selectivity
in PMLS
tricity observed in the youngest kittens (Fig. 2A) makes it very unlikely that such an increase in the highest acuity could simply
DAYS
---____ ----------.
0.3
----__ .
. .
l *
i
-----------
----__l
.
l
------------
. ADULT
be due to a bias in sampling. The same analysis was performed for the optimum spatial frequency by plotting the highest optimum seen in each animal versus age. Again,
Spatial
increase during
the
tuning
The percentage of spatial low-pass cells (those for which the response did not fall below half-maximum even at the lowest spatial frequency, 0.03 cycles/deg; e.g., Fig. 1B) was highest in the youngest animals, aged between 9 and 12 d (7117 = 4 1.2%) but in all the other kittens the value was around 20%, which is not very different from that found in adults (14%; Fig. 4, open circles, right ordinate). For those cells that acted as spatial bandpass filters (e.g., Fig. IA), we measured the spatial bandwidth at half amplitude in octaves; mean bandwidth at each age is also shown in Figure 4 (filled squares, left ordinate). Interestingly, there was a small, but consistent, increase in the spatial bandwidth from around 1.5 octaves in kittens aged 3 weeks or less to the adult value of 2.2 octaves (see Discussion).
8 WEEKS
Linearity
0
there was a considerable
second and third week of life after which values of around 0.5 cycles/deg were reached (Fig. 3, filled circles).
I
1
10
I
20
30 ECCENTRICITY
I 50
40 (deg)
Figure 2. Acuity of units in 9-12-d-old kittens (n = 16; A) and &week-old kittens (n = 26; B) plotted against eccentricity, i.e., the radial distance of the response field center from the area centralis. The linear regression between spatial resolution and eccentricity was significant only for the data from the &week-old kitten (B, r = -0.61, p < 0.001 in a t test; so/id line). For comparison, the linear regression line calculated for data from adult PMLS (interrupted line; p < 0.01) is shown in both plots. 910 II
Figure 3. Mean acuity (unfilled triangles) plus 1 SE plotted versus age. The highest acuity (filled squares) and the highest optimum spatial frequency (jilled circles) found among the entire sample at different ages are also plotted, to indicate our estimate of the upper limit of the performance of PMLS at different ages. There is a sharp rise between 10 and 20 d of age in all these indicators of spatial performance. There was no tendency for cells included from older kittens to have receptive-field centers located closer to the area centralis than those from younger kittens. Note that the one visually responsive cell recorded in the 9-d-old animal was a spatial low-pass cell, and therefore could not be included in this analysis of optimal spatial frequency nor in that of the derived parameters in Figure 6.
3
12 I
of spatial
summation
Using the “null position test” (Enroth-Cugell and Robson, 1966; Hochstein and Shapley, 1976a, b) we found no cells in the suprasylvian visual cortex of adult cats that behaved completely linearly: it was impossible to find a null position of a contrastmodulated grating such that there was not only no first harmonic cf,) component in the response, but also no second harmonic cfi) component nor an increase in mean (Q discharge (Zumbroich and Blakemore, 1987). To study whether changes in the manner of spatial summation occur during the maturation of PMLS, we applied the same test to neurons recorded in kittens of different ages. We presented stationary gratings of a spatial frequency at or above the optimum, whose contrast was modulated sinusoidally between zero and 0.8, at 12 positions covering the complete 360” cycle ofphase displacement (i.e., varying
151619 II I
22 I
56 I
II II
ADULT I
-
B
HIGHEST
MEAN HIGHEST
d 0.1
I, 8
,,
I
I
I
I
I
910
20
30
40
50
60
AGE
(days)
I,,II 70
ADULT
‘ACUITY’
‘ACUITY’ OPTIMUM
The Journal
11 I
15 I
19 II
22
56 I
II II
n
2.5
E z
2.0
.50
rn II 8
40
8 % i
,30
9 $
so
1.5
a
.20
-w-----o,,
___----17
17
I
6
910
,
I
I
I
I
I
20
30
40
50
60
AGE
II 111
I
8 ap
-0
ADULT
(days)
over a range equal to one full spatial cycle of the grating pattern). Figure 5A shows the responses of a cell recorded in PMLS of a 19-d-old animal; it was typical of neurons in kittens less than 3 weeks of age. The cell gave a definite, though small, response to contrast-modulated gratings, but it was almost entirely in the form of an unmodulated increase in the mean discharge, as is apparent in the spike histograms. Fourier analysis ofthe patterns of response (Fig. 5B) shows that the unit had an elevated mean discharge rate (&), clearly above the level of spontaneous activity, at all positions, though its amplitude did vary a little with phase. There was very littlef, or f2 component in the responses at any phase position, and these small components had no convincing phase dependence. The second example (Fig. 5, C, D) illustrates the responses of a neuron recorded in an &week-old kitten and typical of cells studied at that age. In many respects its properties resembled those found for adult cells. There was a clearf> response present at all spatial phases (unfilled arrows, Fig. SC) and an f, component that, though very small, appeared to exhibit the phasedependent characteristic of a single, spatially summating unit within the receptive field: the temporal phase of this f, component shifted with the spatial position of the grating, with null positions about 180” apart (at about 0” or 360” and 180” on the abscissa of Fig. 5D). The increase in mean discharge cf,) was still the largest component in the response and was essentially independent of spatial phase. In summary, cells that responded to stationary stimuli in the younger kittens showed little or no modulated response in either fi or f2 when presented with contrast-modulated gratings, but simply a weak, unmodulated increase in their discharge rate, which was virtually independent of spatial phase. Neurons in older kittens, as in adult cats, often had a small, phase-dependent f, component and a phase-independent f2 component of similar or higher amplitude. No neuron recorded in PMLS of kittens (or adult cats) had a true null phase at which there was no response at all. in position
$ 8 v)
-10
I
August
1988, 8(8)
2719
ADULT 1
3$3 3.0 s .8
of Neuroscience,
4. Percentage of spatial lowpass cells plotted versus age (open circles,interrupted line, ordinate on righthand side). For this graph, data from kittens aged between 9 and 12 d and between 15 and 16 d were pooled and plotted at 11 and 15 d, respectively, on the abscissa. The sample sizes are indicated below the circles.In the very youngest kittens, there was a much higher proportion of low-pass cells. The mean spatial bandwidth (*SE), measured in octaves for all cells acting as spatial bandpass fillers, is plotted at different ages (filled squares,continuous line, ordinate on left-hand side). In kittens younger than 3 weeks, the mean bandwidths were around 1.5 octaves, and the value increased slightly to the adult mean of 2.2 octaves.
Figure
Spatial structure of receptivejields For neurons in adult PMLS, comparison of the size of the receptive field with its preference for spatial frequency has revealed that spatial selectivity typically cannot be accounted for by linear summation across the weighting function of the entire receptive field, since, on average, 1.5-2 complete cycles of a grating of optimum spatial frequency fit across the discharge center of the field (Zumbroich and Blakemore, 1987). To perform the same analysis in kittens, we calculated the spatial index for each bandpass neuron by multiplying the neuron’s optimum spatial frequency (in cycles/deg) by the width of the response field (in degrees), measured along the preferred axis of motion (which was used for the determination of spatial frequency tuning). This spatial index is, then, the number of periods of an optimal grating that fit across the width of the response field. At each age the mean spatial index for neurons in kitten was close to, or even slightly above, the mean value for adult PMLS (1.68). The lowest spatial index we found for any neuron in the kittens was 0.6-slightly above the value (0.5 cycles; i.e., the width of a single bar of the grating) to be expected for neurons that sum linearly across the width of their receptive-field discharge center (Movshon et al., 1978a). Figure 6A shows in detail the results of this analysis for kittens aged 1O-l 2 d (filled blocks; mean spatial index = 1.88) and for kittens aged 8 weeks (unfilled blocks; mean spatial index = 2.12). Most cells had a spatial index between 1 and 2.5; the overall distribution was similar in both age groups and closely resembled that previously found in adults (Zumbroich and Blakemore, 1987). In Figure 6B a direct comparison is made between the response field width (measured along the preferred axis of movement) and the spatial frequency preference of the same samples of neurons analyzed in Figure 6A from kittens aged 10-12 d (filled symbols) and 8 weeks (unfilled symbols). This plot of preferred bar width (half the optimal spatial period, where spatial period
is the inverse
of spatial
frequency)
versus response
2720
Zumbroich
et al.
l
Development
of Spatial
and Temporal
Selectivity
A
in PMLS
*pontaneous
SPATIAL
actwity
PHASE (deg) 0
30
90
150
180
SPATIAL
PHASE
(deg)
240
270
300
330
I
field width reveals that, in every case, the diameter of the response field was larger than the optimal bar width (half the optimal spatial period). For units whose spatial frequency preference results from linear summation across the discharge center of the receptive field (e.g., striate simple cells; Movshon et al., 1978a), one would expect a slope of + 1 in this plot; at no age does this seem to be the case for cells in PMLS. Development
of temporal selectivity
Temporal frequency tuning functions In all visual areas of the cat cortex so far investigated, cells have some degree of selectivity for the temporal frequency of a drift-
ing grating (Tolhurst and Movshon, 1975; Movshon et al., 1978~; Bisti et al., 1985; Morrone et al., 1986; Zumbroich and Blakemore, 1987). To study the development of temporal selectivity, we collected data on the variation of responses to gratings of different temporal frequency from 75 neurons in PMLS of kittens aged between 10 d and 8 weeks. (The one cell studied in the 9 d animal was not held long enough for the analysis of temporal properties to be completed.) Despite the general sluggishness of cells in kitten PMLS, their responses were clearly dependent on the temporal frequency of a drifting grating, and Figure 7 shows characteristic examples of such temporal frequency tuning functions for neurons re-
The Journal
of Neuroscience,
August
1988, 8(8) 2721
C
spontaneous L
activity --
60
90
160
SPATIAL
PHASE
(deg)
240
270
corded in kittens of different ages. The first example, from a 1Od-old kitten (Fig. 7,4), was bandpass in its temporal characteristics; it responded best at quite a low temporal frequency (around 1 Hz) and had a bandwidth at half-amplitude of 2.1 octaves. The total range of temporal frequencies over which this cell responded stretched from below 0.16 Hz, the lowest frequency presented, to 4.1 Hz. The cell from a 19-d-old kitten, illustrated in Figure 7B, had an optimum temporal frequency of just below 3 Hz and gave significant responses to 10 Hz. Figure 7C shows the responses of a cell from a 22-d-old kitten; it had an optimum frequency of about 4 Hz. The final examples, from an S-weekold kitten, illustrate the responses of a cell with a very high
Figure 5. A, Histograms resulting from a null position test on a cell in PMLS of a 19-d-old kitten. The first spike histogram in the column (spontaneous activity) shows the response when no modulated stimulus was present, and successive histograms, below, are the averaged responses to 10 stimulus presentations, each of 2 temporal cycles, of a stationary grating contrast-modulated at 1.5 Hz and presented at different spatial phases spaced at 30” intervals, from 0” to 360” (i.e., shifted across the screen in steps, orthogonal to the orientation of the grating, through one complete spatial cycle of the grating). The sinusoid below the bottom histogram shows the temporal waveform of contrast modulation. The bin width of the histograms is 12 msec. Calibration bars, 100 spikes/set (vertical); 500 msec (horizontal). Spatial frequency was 0.1 cycles/deg. B, Unmodulated elevation of discharge (fO component; filled circles), and the amplitudes of modulation of the firing rate at the temporal frequency of modulation of the grating (fi ; jilled squares) and at twice that frequency (fi; unfilled triangles) are plotted as a function of spatial phase for the same cell as in A. Negative values of thef, component are used to indicate that the very small f, responses in this cell all occurred during the temporal half-period corresponding to grating offset, whatever its spatial phase. For this neuron, as for the majority of units in young kittens, both the f, and f2 components were small compared to they, at all spatial phases: there was no obvious modulated component in the discharge. The solid arrow on the ordinate indicates the level of spontaneous activity. C, Histograms of responses for another cell recorded in PMLS of an S-week-old kitten. Conventions and calibrations as in A. Spatial frequency was 0.16 cycles/deg; temporal frequency was 1.5 Hz. Open arrows indicate the phase-independent f2 response. D, Amplitudes off,, f,, and f2 plotted as in B for the same cell as in C.
preferred temporal frequency of about 10 Hz (Fig. 70) and of a very broadly tuned cell with a half-width at half-amplitude of 4.3 octaves (Fig. 7E). High-temporal-frequency frequency
cutofland
optimal
temporal
It was quite obvious that cells in PMLS of young kittens could not detect very rapidly drifting gratings, and inspection of individual temporal frequency tuning functions showed that they responded best to temporal frequencies lower than those preferred in adults. To analyze this trend quantitatively, we plotted the mean high-temporal-frequency cutoff (temporal acuity) for
2722
Zumbroich
et al. * Development
of Spatial and Temporal
Selectivity
in PMLS
below the proportion found in the adult sample (56%). The mean temporal bandwidth of bandpass units increased with age from 1.7 octaves in the youngest kittens to the adult value of about 2.7 octaves, the major change occurring by 3 weeks of age (Fig.
A
9).
0
0.5
1
SPATIAL
1.5
2
INDEX
lb RESPONSE
FIELD
2.5
3
3.5
>3.5
(cycles)
li WIDTH
(deg)
Figure 6. A, Histogram plotting the spatial index (the product of peak snatialfreauencv and resuonsefield width) for neurons in PMLS of loi2-d-old (filled blocks;n= 10) and 8-week-old (unjilled blocks; n = 17) kittens. B, Plot of half the value of the preferred spatial period (i.e., the optimal bar width) versusthe receptivefield width for the samesamples of neurons from IO-12-d-old (jilled circles) and 8-week-old (unfilled triangles)kittens. The line with a slope of 1 is the expectedrelationship for neurons whose receptive-field width is the size of the summating unit determining selectivityfor spatial frequency. neurons recorded at each age (Fig. 8, filled squares). There is indeed a more than 3-fold increase in the mean high-frequency cutoff between the second and eighth postnatal week of the kitten’s life, but the major change is accomplished by 3 weeks of age, by which time the mean cutoff is not significantly different from the adult value (about 14 Hz). The mean optimum temporal frequency, calculated for those units that showed temporal bandpass characteristics (i.e., had a clear peak, with the response falling to half-amplitude on either side within the range measured), also increased gradually, from about 1 Hz in the youngest kittens to the adult value of 4 Hz (Fig. 8, filled circles). Although most of this change occurred in the first 3 weeks of life, the increase seemed to continue to 8 weeks and beyond. However, neither the improvement between 3 and 8 weeks, nor that from 8 weeks to the adult, actually reached statistical significance. Temporal frequency tuning Some neurons in PMLS of kittens showed little or no lowtemporal-frequency attenuation. and were classified as temporal low-pass cells. In all the kittens, even those 8 weeks old, the proportion of these low-pass cells was smaller than 15%, well
Since the proportion of bandpass cells was roughly constant in kittens, but their mean bandwidth increased with age, the absolute range of temporal frequencies to which cells responded became considerably larger, on average, with age. We analyzed this by calculating, at each age, the proportion of neurons in the sample that responded above criterion at each particular temporal frequency over the entire range tested. The resulting histograms (Fig. 10) give an indication of how well-represented different temporal frequencies are at different ages. In the kittens aged between 10 and 12 d, most neurons responded to gratings drifting at temporal frequencies between 0.7 and 3.5 Hz, but frequencies below 0.5 and above 5 Hz caused very few cells to respond. In older kittens, there was a progressive increase in the proportion of cells responding to the lowest temporal frequencies, and in those responding to frequencies above 5 Hz. In adult animals all units studied (not only the temporal lowpass cells) gave responses above threshold criterion to temporal frequencies below 3 Hz, and many neurons responded to high frequencies of more than 20 Hz (Zumbroich and Blakemore, 1987). Velocity preferences Our previous results (Zumbroich and Blakemore, 1987) suggested that cells in adult PMLS are sensitive to the local change in luminance rather than to velocity (temporal frequency/spatial frequency) per se. Morrone et al. (1986, their figure 12C) have reported a mutual dependence of spatial and temporal tuning for a small sample of PMLS neurons, but the interaction that they described was not only limited in extent but was actually a decrease in optimum spatial frequency with increasing temporal frequency, rather than the increase that would be needed to preserve constant optimum velocity. For 10 cells in animals of the present study between 12 d and 8 weeks of age, we determined complete spatial frequency tuning functions at 2 different temporal frequencies, 1 octave apart. In no case was there a clear shift of preferred spatial frequency. Taking all the evidence into account, it seems that spatiotemporal coupling is not a striking property of neurons in PMLS and certainly does not provide a velocity-selective mechanism. Nevertheless, knowledge of the selectivity for both spatial and temporal frequency allowed us to determine the best velocity for a grating of optimal spatial frequency. We calculated this optimal velocity (temporal frequency/spatial frequency), using the peak spatial and temporal frequencies for cells with bandpass characteristics and the point of highest response, just before the high-frequency rolloff, for those that were either spatial or temporal low-pass cells. The mean optimal velocity at the best spatial frequency clearly increased from about 10 deg/sec in the youngest kittens to more than 50 deg/sec in adults (Fig. 11). The expansion with age in the range of temporal frequencies over which neurons responded (Fig. 10) necessarily led to a corresponding increase in the range of stimulus velocities that units responded to at the optimum spatial frequency. This is illustrated in detail in Figure 12, which shows the full range of velocities over which each unit gave a response above the threshold criterion for a drifting grating of optimal spatial frequency; results are shown separately for the youngest (lo-12 d; upper
The Journal
of Neuroscience,
Augusf
1988, 8(8)
2723
19 days
A 22 days 10 days
SA + 2 S.E.
0.3 J 0.3 0.5 TEMPORAL
I 1
-
FREQUENCY
8 ~~~~~~1 3 5 10 (Hz)
8 weeks
8 weeks
Figure 7. Representative temporal frequency tuning curves for neurons in PMLS of kittens of different ages, measured with drifting gratings of optimum spatial frequency, orientation, and direction of movement. Response (elevation of mean discharge in spikes/set +- SE) is plotted against temporal frequency in cycles/set (Hz). The arrow on the ordinate shows the mean level of spontaneous activity and the interrupted line is the threshold criterion equal to maintained discharge plus 2 SE. A, Results for a cell from a IO-d-old kitten with spontaneous activity of 0.4 spikes/ sec. The spatial frequency of the grating was 0.06 cycles/deg. The full temporal bandwidth at half-amplitude (BW = 2.1 octaves) is indicated. BE, Using the same conventions as in A, other representative temporal frequency tuning curves are plotted for cells recorded in a 19-d-old (B), a 22-d-old (C), and an 8-week-old (D, E), kitten.
half) and the oldest (8 weeks; lower half) age group. Data from intermediate ages showed a progressive change in the velocity range.
Discussion The extrastriate area PMLS appears to be specialized for the detection of image motion and its direction, and may play a role in visuomotor coordination, in the analysis of motion in 3-dimensional space, and in the control of oculomotor stabilization (e.g., Komatsu et al., 1983; Toyama et al., 1985; Ventre, 1985). Cells of this region in the adult cat have relatively large receptive fields (e.g., Hubel and Wiesel, 1969; Wright, 1969; Zumbroich et al., 1986). They are frequently narrowly tuned for the direction of motion of stimuli (Camarda and Rizzolatti, 1976; Spear and Baumann, 1975) and for the orientation of elongated stimuli (Blakemore and Zumbroich, 1987); and a high proportion of them have a strong direction preference (e.g., Hubel and Wiesel, 1969; Wright, 1969; Spear and Baumann, 1975; Blakemore and Zumbroich, 1987). Although this region receives a corticocortical input from area 17 (see Sherk, 1986), it is unlikely to continue a process of relatively fine-grain spatial analysis of the visual scene, started in the striate cortex. The spatial characteristics of the receptive fields of cells in PMLS
are coarse and their optimal spatial frequencies low compared with those of striate neurons (Zumbroich and Blakemore, 1987). These findings are compatible with the notion that the major functional input to PMLS comes directly from either W-cells or Y-cells in the C-laminae of the LGN, the medial interlaminar nucleus, or the pulvinar/lateralis posterior complex, or arrives indirectly via the association input from area 18 (Raczkowski and Rosenquist, 1983; Stone, 1983; Lee et al., 1986). Now, it could be argued that the simple, early forms of visuomotor behavior that first appear during the third postnatal week of a kitten’s life (Norton, 1974, 198 1) are likely to depend on the kinds of functional properties possessedby cells in PMLS. Our aim in this study was, thus, to follow the emergence of visual responsiveness in the suprasylvian cortex. We have described elsewhere the development of selectivity for orientation and direction of motion, and the emergence of “columnar” organization (Price et al., 1988). Here we have concentrated on the maturation of spatial and temporal characteristics that might be important in motion detection. At 9 d (the age of the youngest animal in this series), when the eyes are just about to open, PMLS is largely silent and visually unresponsive. Before 2 weeks of age, responsive cells are found in small clusters in the deeper layers of the cortex.
2724
Zumbroich
et al. * Development
of Spatial
and Temporal
Selectivity
in PMLS
IO-12
MEAN
days
22
days
CUT-OFF
dmlL MEAN
OPTIMUM
0.5
I
03
,,, 6
910
I
I
!
20
30
40
AGE
rl,II 50
I 60
70
ADULT
(days)
Figure 8. Mean high-temporal-frequency cutoff (*SE, Jilled squares) and mean optimum temporal frequency (&SE; jilkd circles) plotted for each age. Sample sizes are indicated above the error bars for the mean cutoffs and below them for the mean optimum temporal frequency. For cells with little or no obvious low-temporal-frequency attenuation (lowpass cells), no optimum temporal frequency could be determined. For this and the following graphs, data from kittens aged between 10 and 12 d and between 15 and 16 d are pooled. Note the gradual increase both of mean cutoff and mean optimum, possibly extending even beyond the first 8 weeks for the mean optimum temporal frequency. Between 2 and 3 weeks of age there is a rapid increase in the proportion of responsive units, including cells in the upper layers, and spontaneous activity and peak responsiveness increase to adult levels (Price et al., 1988). Despite the general sluggishness of cells in young animals, the majority of visually responsive neurons could be stimulated and studied quantitatively with drifting gratings. The fraction of visually responsive cells producing responses that could be detected by ear for stationary flashed stimuli was slightly lower in very young kittens than in adult cats, but quantitative methods revealed that a fairly constant fraction (40-50%) responded to stationary contrast-mod-
11 I
OJ,
,
6
,
9 10
15 1
19 22 I I
56 I
II II
ADULT I
,I I
I
I
I
20
30
40
50
AGE
III
60
I
ADULT
(days)
Figure 9. Mean temporal bandwidth (*SE) plotted for the temporal bandpass units at each age. Sample sizes are the same as indicated for the mean optimum temporal frequency in Figure 8.
-In 0.5
111111,I1 I111111, I In 1 510 50
TEMPORALFREQUENCY
I 0.5
(Hz)
TEMPORAL
1
8 I~~~~~~, r ‘I( 510 FREQUENCY
50 (HZ)
Figure 10. For each age we calculated the proportion of the total sample of cells that responded significantly above the criterion (background activity + 2 SE) at each particular temporal frequency in order to find out how well-represented different temporal frequencies were as a function of age. Each histogram plots the fraction of units in the sample responding at each temporal frequency. The bin width for the temporal frequencies in the histograms is 0.67 octaves (0.2 log units). The sample sizes are as follows: lo-12 d, n = 11; 15-16 d, n = 12; 19 d, n = 14; 22 d, n = 14; 8 weeks, n = 18; adult, n = 9. ulated gratings at all ages. We were therefore able to use all the methods of analysis of spatial and temporal properties that we had applied previously to the adult (Zumbroich and Blakemore, 1987). Development
of spatial properties
in PMLS
Spatial acuity. The maximum spatial resolution ofcells in PMLS improves very quickly and reaches the adult value of more than 2 cycles/deg at the end of the third week of life. We also found an increase with age in the highest optimum spatial frequency, with the best cells also reaching the adult value at 3 weeks of age (Fig. 3). The improvement of spatial resolution is mainly restricted to cells whose receptive fields lie in the central visual field. It is interesting to consider the factors that might contribute to this improvement in the spatial resolution of neurons in PMLS. The optical quality of the kitten’s eye is certainly worse than that in adult cats (Bonds and Freeman, 1978; Derrington, 1979) and major changes in image quality probably occur between 10 and 20 d, during which time the highest acuity in PMLS increases by a factor of 10. However, the range of spatial frequencies in question is so low that the change in optical contrast
transfer with age is unlikely to contribute substantially to the improvement in neuronal performance. In the central retina, the dendritic fields of ganglion cells of all classes achieve
their full linear dimensions
by 3 weeks of age
(Rusoff and Dubin, 1977). Between birth and 8 weeks, the eye increases in length (Thorn et al., 1976) and the surface area of the retina expands (see Rusoff, 1979) although most of this
The Journal
11
15
19 22
ADULT
56
1
3
nl 4=
’
5
of Neuroscience,
10
’ ’ ““I
August
30 50 100 ’ ’ ““‘I
v
+-
300 ’
11
1988, 8(8) 2725
’ 1I’a-l
days
v
+
v cc *
20 AGE
30
40
50
60 70
8 weeks
ADULT
(days)
Figure Il.
Mean optimal velocity (&SE) at the optimal spatial frequency (velocity = temporal frequency/spatial frequency) is plotted for each age group. For temporal or spatial low-pass cells the optimal velocity was determined by using the point of highest response, just before the high-frequency rolloff of the tuning curve. The sample sizes are the same as indicated for the mean temporal cutoff in Figure 9.
growth occurs in the peripheral retina (Mastronarde et al., 1984). The net effect of all these changes is a magnification of the retinal image and probably a substantial decrease in the angular dimensions of the centers of receptive fields of ganglion cells in the central retina (Rusoff, 1979). Indeed, there is neurophysiological evidence that the centers of both X- and Y-cells in the central retina do shrink by a factor of about 2 between 3 weeks and adulthood (Rusoff and Dubin, 1977). Unfortunately, we know very little about the maturation of W-cells, and nothing about changes in the dimensions of retinal receptive fields before 3 weeks of age, when the major changes take place in the resolution of cells in PMLS. All in all, it seems likely that the rapid and early increase in the spatial resolution of cells in PMLS with central receptive fields is due, in part, to the effects on the receptive fields of retinal Y- and W-cells of a combination of growth of the eye, improvement in optical quality, relative angular shrinkage of the central retina, and even changes in synaptic connectivity in the retina (e.g., Cragg, 1975; Morrison, 1977). The general increase in responsiveness of cells in the visual pathway during early postnatal development could also contribute a small increase in the spatial resolution of individual cells (seeBlakemore and Vital-Durand, 1986). Spatial tuning. The proportion of visually responsive cells that were selective for spatial frequency (in the sense that they had bandpass characteristics and could be assigned a bandwidth and a peak spatial frequency) increased from about 55% in the youngest kittens to about 80% in older kittens, close to the adult value of 85% (though it must be emphasized that the apparent substantial change between about 11 and 15 d is based on small samples). In general, the tuning of neurons for spatial frequency becomes progressively narrower through the visual pathway, from retina to visual cortex (e.g., Maffei and Fiorentini, 1973) and intracortical inhibitory mechanisms contribute substantially to the low spatial-frequency-attenuation in area 17 (Vidyasagar et al., 1985). The inhibitory surrounds of X- and Y-cells in the kitten LGN certainly increase in strength during the first few weeks oflife (Daniels et al., 1978; Ikeda and Tremain, 1978) but maturation of cortical inhibitory mechanisms (Wolf et al., 1986) presumably also contributes to the considerable decrease of spatial bandwidth of striate neurons, which are more narrowly
v .cc
*
c c c +-
v v v
4= +4-h + + +
v v v v v V V V V
cc A llll 1
’ ’ ‘11U1’ 3 5 10 VELOCITY
’ ’ ‘1111” 3050 100
’ ’ ‘U 300
(deg/sec)
Figure 12. The total range of velocities to which each cell responded at its optimum spatial frequency, plotted for units recorded in kittens aged about 11 d, i.e., pooling data from lo-12 d (upper halt n = 11) and 8 weeks (lower half, n = 22). Unjilled arrows show optimum velocities for temporal bandpass cells. For the temporal low-pass cells, stars refer to the velocity corresponding to the inflection point of the temporal tuning function before the high-frequency rolloff. Filled arrows on the left indicate that the minimum velocity to which the neuron would respond lay below the range tested.
tuned than LGN cells at all ages (Ikeda and Tremain, 1978; Derrington and Fuchs, 198 1). We found that the mean bandwidth of cells in PMLS actually increases slightly with age (Fig. 4), but this might well be largely due to the gradual recruitment into the population of bandpass cells of very broadly tuned neurons that used to be low-pass or even visually unresponsive. The reduction in the proportion of low-pass cells, which is presumably due to the development of low spatial-frequency attenuation, may well be primarily dependent on maturation of inhibitory processeswithin the cortex (Wolf et al., 1986) though this question remains open until we have knowledge of the development of spatial tuning in those thalamic nuclei that project to PMLS in the kitten (Kato et al., 1986) and the adult cat (e.g. Raczkowski and Rosenquist, 1980, 1983). If there is a genuine broadening of bandwidth for individual cells that start with bandpass characteristics, as well as a rise in their optimal and cutoff spatial frequencies, this would imply that the excitatory weighting functions underlying their spatial selectivity decrease in size without a parallel reduction in the dimensions of the inhibitory weighting functions.
2726
Zumbroich
et al. * Development
of Spatial
and Temporal
Selectivity
in PMLS
Development of patterns of responses to gratings. Previous work has suggested that the development of linear X-cells in the LGN (Daniels et al., 1978) and of simple cells in the striate cortex (Blakemore and Van Sluyters, 1975) precedes that of nonlinear Y-cells and complex cells. Neurons in the suprasylvian visual cortex of adult cats are highly nonlinear in many aspects of their responses and are very unlikely to depend on functional input from the X-system (Morrone et al., 1986; Zumbroich and Blakemore, 1987). We were therefore interested in examining the time course of maturation of spatial nonlinearities in PMLS and, in particular, in discovering whether the receptive fields initially consist of only a single spatial subunit, gradually adding others and thus becoming more nonlinear with age. In kittens aged 12 d or younger, those cells in PMLS that were responsive to stationary, flashed stimuli all had receptive fields consisting of a single ON or OFF region; none of them gave mixed ON-OFF responses over the whole receptive field. At no age did we find neurons with spatially segregated ON and OFF regions, characteristic of simple cells (Hubel and Wiesel, 1962; Henry, 1977). Cells giving either pure ON or pure OFF responses have also been observed in areas 17 and 18 of young kittens (Albus and Wolf, 1984; Blakemore and Price, 1987), but in those areas such cells are thought to be immature simple cells, which take some time to develop strong antagonistic surrounds. Despite the prevalence of receptive fields consisting of pure ON or OFF areas (which could be an indication of single spatially summating subunits), the responses of cells in PMLS of young kittens to drifting gratings were nevertheless highly nonlinear and, if anything, were even less distinctly modulated than those of cells in adult PMLS. The fundamental frequency cf,) component was always very small or negligible in cells from kittens lessthan 19 d of age, even at very low spatial frequencies, and the response to a drifting grating usually consisted of an unmodulated t&) elevation of mean discharge, as in complex cells (Movshon et al., 1978a, b; Dean and Tolhurst, 1983). In PMLS of kittens of all ages, the preferred spatial period (i.e., the inverse of the preferred spatial frequency) was, on average, 1.5-2 times as large as the diameter of the response field; i.e., about 3-4 bars of a grating of optimum spatial frequency would fit across the receptive field. This result, which is essentially the same as that found for cells in adult PMLS (Zumbroich and Blakemore, 1987), clearly indicates nonlinear summation across the receptive field, and suggests that even at the earliest stages, as soon as cells become visually responsive, their receptive fields consist of a number of noncoincident spatial subunits. The patterns of discharge to stationary, contrast-modulated gratings confirmed this impression of spatial nonlinearity even at the youngest ages,although the exact forms of response showed some change with age. In the youngest kittens, responses to such stimuli were usually weak and consisted almost entirely of a continuous elevation of mean discharge for all phase positions of the grating, with no obvious modulation at any temporal frequency (Fig. 54). In older kittens (Fig. 5B), there was usually a distinct, phase-independent fi component in the responses, and some cells also had a clear first harmonic response with a null phase. No cell at any age showed evidence of truly linear summation with a null position for all its response components. In summary, the response patterns ofcells in PMLS of kittens, like those of complex cells in areas 17 and 18, display strong nonlinearity of spatial summation, which seems in some aspects even more pronounced than in adult cats.
Comparison with previous physiological and behavioral studies The one previous study that has dealt with the development of spatial tuning in the kitten cortex (Derrington, 1978; Derrington and Fuchs, 1981) revealed an increase in the optimum spatial frequency and acuity of striate cells during the first 6 weeks or more of the kitten’s life. Derrington and Fuchs (198 1) determined the contrast sensitivity of cells, whereas we measured the responses to high-contrast stimuli; therefore, the absolute values of acuity and optimal spatial frequency in the 2 studies cannot be precisely compared. However, comparison of the time courses of development of spatial resolution for area 17 and PMLS shows a close similarity during the initial phase, up to the end of the third postnatal week, After that, however, neurons in PMLS no longer increase their acuity, whereas cells in striate cortex continue to improve (see Derrington, 1978, Fig. 1). A generally similar developmental increase in visual resolution has been inferred from measurements of visually evoked potentials in kittens (Freeman and Marg, 1975) and was demonstrated behaviorally with the jumping-stand method (Mitchell et al., 1976). However, these studies reported a time course of maturation of acuity even more prolonged than that of cells in area 17. And, surprisingly, the acuity measured by these techniques was lower at each age than that of not only the best cells in striate cortex (Derrington and Fuchs, 198 1) but of even the cells with highest resolution in PMLS, and was more similar to the mean resolution of cells in the 2 areas. It is conceivable, then, that PMLS plays a part in determining the behavioral acuity of young kittens even if it is unlikely to do so in adult cats. Development of temporal selectivity Both the mean optimum temporal frequencies of cells in PMLS and their mean high-temporal-frequency cutoffs increased markedly over the first 3 weeks of life, and possibly continued to improve slightly. The proportion of temporal low-pass cells was substantially lower in kittens, even up to 2 months old, than in adults. Immature neurons were unable to sustain responses either to very rapidly or to very slowly modulated patterns. The gradual increase in high- and low-frequency responsivenessled to a broadening, on average, of temporal bandwidth, which increased the absolute range of temporal frequencies to which the population of cells responded at older ages. These changes in temporal properties were most pronounced during the first 3 weeks of the kitten’s life, like the maturation of spatial selectivity, but some aspects of temporal characteristics, especially responsiveness at low frequencies, were still not completely mature even in the 8-week-old kitten. The overall rise in optimal spatial frequencies should, of itself, have resulted in a fall in optimal velocity at the preferred spatial frequency. However, that tendency was more than compensated for by the rise in optimal temporal frequencies. Consequently, velocity preference (calculated at the optimum spatial frequency) increased considerably, on average, with age, and velocity tuning became broader (Fig. 12). To our knowledge, the postnatal maturation of temporal selectivity for drifting gratings has not previously been studied at any level of the visual pathway. However, Hamasaki and Flynn (1977, Fig. 10) found that retinal ganglion cells in 3-week-old kittens could not follow intermittent flash stimulation above 15 Hz, and that the maximum firing rates were lower than in adults at any stimulus frequency. Similarly, Albus and Wolf (1984)
The Journal
found that the mean cutoff velocity of cells in the striate cortex for conventional dot and bar stimuli approximately doubled between 10 d and the beginning of the fourth week of life (recalculated from Table 3, Albus and Wolf, 1984). Since little comparable work has been done on the development of temporal properties in other parts of the visual system, it is difficult to decide whether peripheral or central factors play the major role in the development of temporal selectivity in PMLS. It seems plausible, though, that the properties of retinal ganglion cells, which take about 16 weeks to achieve mature intensity-response functions and temporal resolutions (Flynn et al., 1977) could be responsible for the slow time course of development of temporal properties in PMLS. General conclusions Major changes in the spatial and temporal properties of neurons in PMLS occur during the first few weeks of the kitten’s life, over roughly the same period as the rapid postnatal maturation of their direction selectivity and orientation selectivity (Price et al., 1988). Some aspects of temporal selectivity seem to take longer to develop, and it would be interesting to see whether any of the visuomotor functions for which PMLS might be responsible take a similar period of time to develop fully mature temporal characteristics. Neurons in PMLS exhibit marked spatial nonlinearity at all ages. Unlike area 17, where the development of simple cells seems to precede that of nonlinear complex cells (Blakemore and Van Sluyters, 1975; Buisseret and Imbert, 1976), the nonlinear cells of the suprasylvian visual cortex, which in many respects resemble complex cells in areas 17 and 18, are, according to our results, not delayed in their development and do not go through an initial stage in which their receptive fields have only a single summating subunit. It is likely, then, that the connections responsible for the several subunits in each receptive field are largely constructed before cells in PMLS become responsive to visual stimuli. References Albus, K., and W. Wolf (1984) Early post-natal development of neuronal function in the kitten’s visual cortex: A laminar analysis. J. Physiol. (Lond.) 348: 153-185. Barlow, H. B., C. Blakemore, and J. D. Pettigrew (1967) The neural mechanism of binocular depth discrimination. J. Physiol. (Lond.)
193: 327-342.
Berardi, N., S. Bisti, A. Cattaneo, A. Fiorentini, and L. Maffei (1982) Correlation between the preferred orientation and spatial frequency of neurones in visual areas 17 and 18 of the cat. J. Physiol. (Lond.) 323: 603-618. Berson, D. M. (1985) Cat lateral suprasylvian cortex: Y-cell inputs and corticotectal projection. J. Neurophysiol. 53: 544-556. Bisti, S., G. Carmignoto, L. Galli, and L. Maffei (1985) Spatial-frequency characteristics of neurones of area 18 in the cat: Dependence on the velocity of the visual stimulus. J. Physiol. (Lond.) 359: 259268. Blakemore, C., and D. J. Price (1987) The organization and post-natal development of area 18 of the cat’s visual cortex. J. Physiol. (Lond.) 384: 263-292. Blakemore, C., and R. C. Van Sluyters (1975) Innate and environmental factors in the development of the kitten’s visual cortex. J. Physiol. (Lond.) 248: 663-7 16. Blakemore, C., and F. Vital-Durand (1986) Organization and postnatal development ofthe monkey’s lateral geniculate nucleus. J. Physiol. (Lond.) 380: 45349 1. Blakemore, C., and T. J. Zumbroich (1985) Spatial frequency selectivity in the lateral suprasylvian areas (PMLSPLLS) of the cat visual cortex. J. Physiol. (Lond.) 369: 40P.
of Neuroscience,
August.1988,
B(8)
2727
Blakemore, C. and T. J. Zumbroich (1987) Stimulus selectivity and functional organization in the lateral suprasylvian visual cortex of the cat. J. Physiol. (Lond.) 389: 569-603. Blakemore, C., D. J. Price, and T. J. Zumbroich (1986) The postnatal development of the postero-medial suprasylvian area of the cat: A quantitative electrophysiological study. Sot. Neurosci. Abstr. 12: 784. Bonds, A. B. (1979) Development of orientation tuning in the visual cortex of kittens. In Developmental Neurobiology of Vision, R. D. Freeman, ed., pp. 3 l-4 1, Plenum, New York, London. Bonds, A. B., and R. D. Freeman (1978) Development of optical quality in the kitten eye. Vision Res. 18: 391-398. Braastad, B. O., and P. Heggelund (1985) Development of spatial receptive-field organization and orientation selectivity in kitten striate cortex. J. Neurophysiol. 53: 1158-l 178. Buisseret, P., and M. Imbert (1976) Visual cortical cells: Their developmental properties in normal and dark reared kittens. J. Physiol. (Lond.) 255: 5 1 l-525. Camarda, R., and G. Rizzolatti (1976) Visual receptive fields in the lateral suprasylvian area (Clare-Bishop area) of the cat. Brain Res. 101: 427-443. Cragg, B. (1975) The development of synapses in the visual system of the cat. J. Comp. Neurol. 160: 147-166. Daniels, J. D., J. D. Pettigrew, and J. L. Norman (1978) Development of single-neuron responses in the kitten’s lateral geniculate nucleus. J. Neurophysiol. 41: 1373-l 393. Dean, A. F., and D. J. Tolhurst (1983) On the distinctness of simple and complex cells in the visual cortex of the cat. J. Physiol. (Lond.) 344: 305-325. Denington, A. M. (1978) Development of selectivity in kitten striate cortex. J. Physiol. (Lond.) 293: 46-47P. Derrington, A. M. (1979) Direct measurements of image quality in the kitten’s eve. J. Phvsiol. (Land.) 29.5: 16-17P. Derrington, A. &I., and A. F. Fuchs (198 1) The development of spatialfrequency selectivity in kitten striate cortex. J. Physiol. (Lond.) 316: l-10. Di Stefano, M., M. C. Morrone, and D. C. Burr (1985) Visual acuity of neurones in the cat lateral suprasylvian cortex. Brain Res. 331: 382-385. Eldridge, J. L. (1979a) A reversible ophthalmoscope using a comercube. J. Physiol. (Lond.) 295: l-2P. Eldridee. J. L. (1979b) Bi-axial stereotaxic head holder. J. Phvsiol. (Lond.) 295: 2-3P. Enroth-Cugell, C., and J. G. Robson (1966) The contrast sensitivity of retinal ganglion cells of the cat. J. Physiol. (Lond.) 187: 517-552. Flynn, J. T., T. E. Flynn, D. I. Hamasaki, 0. Navarro, V. G. Sutija, and G. S. Tucker (1977) Development of the eye and retina of kittens. In Frontiers in VisualScience,S. J. Cool and E. L. Smith III, eds., pp. 594-603, Springer, New York. Freeman, D. N., and E. Marg (1975) Visual acuity development coincides with the sensitive period in kittens. Nature 254: 614-6 15. Hamasaki. D. I.. and J. T. Flynn (1977) Phvsiolosical moaerties of retinal ganglion cells of 3-week-old kittens. Vision Res. i7: 275-284. Henry, G. H. (1977) Receptive field classes of cells in the striate cortex of the cat. Brain Res. 133: l-28. Hochstein, S., and R. M. Shapley (1976a) Quantitative analysis of retinal ganglion cell classifications. J. Physiol. (Lond.) 262: 237-264. Hochstein, S., and R. M. Shapley (1976b) Linear and nonlinear spatial subunits in Y cat retinal ganglion cells. J. Physiol. (Lond.) 262: 265284. Hubel, D. H., and T. N. Wiesel (1962) Receptive fields, binocular interaction and functional architecture in the cat’s visual cortex. J. Physiol. (Lond.) 160: 106-154. Hubel, D. H., and T. N. Wiesel (1969) Visual area of the lateral suprasylvian gyrus (Clare-Bishop area) of the cat. J. Physiol. (Lond.) 202: 25 l-260. Ikeda, H., and K. E. Tremain (1978) The development of spatial resolving power of lateral geniculate neurones in kittens. Exp. Brain Res. 31: 193-206. Kato, N., S. Kawaguchi, and H. Miyata (1986) Postnatal development of afferent projections to the lateral suprasylvian visual areain the cat: An HRP studv. J. Camp. Neurol. 252: 543-554. Komatsu, Y., K. Shibuki, and K. Toyama (1983) Eye movementrelated activities in cells of the lateral suprasylvian cortex of the cat. Neurosci. Lett. 41: 271-276. Kulikowski, J. J., and P. 0. Bishop (1981) Linear analysis of the “/-
\
,
2728
Zumbroich
et al. - Development
of Spatial
and Temporal
Selectivity
in PMLS
responses of simple cells in the cat visual cortex. Exp. Brain Res. 28: 386-400. Lee, C., J. G. Malpeli, and T. G. Weyand (1986) Simple cells of cat area 18 mediate input from layer A of the lateral geniculate nucleus to the Clare-Bishop area. Sot. Neurosci. Abstr. 121 384. Maffei. L.. and A. Fiorentini (1973) The visual cortex as a snatial frequency analyser. Vision Res. 13.’ 1255-1267. Mastronarde, D. N., M. A. Thibeault, and M. W. Dubin (1984) Nonuniform postnatal growth of the cat retina. J. Comp. Neurol. 179: 223-244. McCall, M. A., L. Tong, and P. D. Spear (1985) Development of response properties of posteromedial lateral suprasylvian visual cortex neurons in the cat: Implications for functional compensation. Sot. Neurosci. Abstr. I I: 807. Merrill, E. G., and A. Ainsworth (1972) Glass-coated platinum-plated tungsten microelectrodes. Med. Biol. Eng. 10: 662-672. Mitchell, D. E., F. Giffin, F. Wilkinson, P. Anderson, and M. L. Smith (1976) Visual resolution in young kittens. Vision Res. 16: 363-366. Morrison. J. D. (1977) Electron microsconic studies of developina _ kitten retina. J. Physiol. (Lond.) 273: 91-92P. Morrone, M. C., M. Di Stefano, and D. C. Burr (1986) Spatial and temporal properties of neurons of the lateral suprasylvian cortex of the cat. J. Neurophysiol. 56: 969-986. Movshon, J. A., I. D. Thompson, and D. J. Tolhurst (1978a) Spatial summation in the receptive fields of simple cells in the cat’s striate cortex. J. Physiol. (Lond.) 283: 53-77. Movshon, J. A., I. D. Thompson, and D. J. Tolhurst (1978b) Receptive field organization of complex cells in the cat’s striate cortex. J. Physiol. (Lond.) 283: 79-99. Movshon, J. A., I. D. Thompson, and D. J. Tolhurst (1978~) Spatial and temporal contrast sensitivities in areas 17 and 18 of the cat’s visual cortex. J. Phvsiol. (Land.) 283: 101-120. Norton, T. T. (1974) Receptive held properties of superior colliculus cells and development of visual behavior in kittens. J. Neurophysiol. 37: 674-690. Norton, T. T. (198 1) Development of the visual system and visually guided behavior. In Development of Perception, vol. 2, R. N. Aslin, J. R. Albert, and M. R. Petersen, eds., pp. 113-l 56, Academic, New York. Olson, C. R., and R. D. Freeman (1980) Resealing of the retinal map of visual space during growth of the kitten’s eye. Brain Res. 186: 5565. Palmer, L. A., A. C. Rosenquist, and R. J. Tusa (1978) The retinotopic organization of lateral suprasylvian visual area in the cat. J. Comp. Neurol. 177: 237-256. Price, D. J., and T. J. Zumbroich (1986) Post-natal development of spatial selectivity in the lateral suprasylvian cortex of the cat. J. Physiol. (Lond.) 377: 22P. Price, D. J., T. J. Zumbroich, and C. Blakemore (1988) Development of stimulus selectivity and functional organization in the suprasylvian visual cortex of the cat. Proc. R. Sot. [Biol.] 233: 123-163.
Raczkowski, D., and A. C. Rosenquist (1980) Connection of the parvocellular C laminae of the dorsal lateral geniculate nucleus with the visual cortex in the cat. Brain Res. 199: 447-45 1. Raczkowski, D., and A. C. Rosenquist (1983) Connections of the multiple visual cortical areas with the lateral posterior-pulvinar complex and adjacent thalamic nuclei in the cat. J. Neurosci. 3: 19121942. Rusoff, A. C. (1979) Development of ganglion cells in the retina of the cat. In Developmental Neurobiology of Vision, R. D. Freeman, ed., pp. 19-30, Plenum, New York, London. Rusoff, A. C., and M. W. Dubin (1977) Development of receptivefield properties of retinal ganglion cells in kittens. J. Neurophysiol. 40: 1188-l 198. Sherk, H. (1986) Location and connections of visual cortical areas in the cat’s suprasylvian sulcus. J. Comp. Neurol. 274: l-3 1. Spear, P. D., and T. P. Baumann (1975) Receptive-field characteristics of single neurons in lateral suprasylvian visual area of the cat. J. Neurophysiol. 38: 1403-1420. Stone, J. (1983) Parallel Processing in the Visual System, Plenum, New York, London. Thorn, F., M. Gollender, and P. Erickson (1976) The development of the kitten’s visual optics. Vision Res. 16: 1145-l 149. Tolhurst, D. J., and J. A. Movshon (1975) Spatial and temporal contrast sensitivity of striate cortical neurones.Nature 257: 674-675. Tovama. K.. Y. Komatsu. H. Kasai. K. Fuiii. and K. Umetani 0985) Responsiveness of Glare-Bishop ‘neurons to visual cues associated with motion of a visual stimulus in three-dimensional space. Vision Res. 25: 407-4 14. Tretter, F., M. Cynader, and W. Singer (1975) Cat parastriate cortex: A primary or secondary visual area? J. Neurophysiol. 38: 1099-l 113. Ventre, J. (1985) Cortical control of oculomotor functions. II. Vestibulo-ocular reflex and visual-vestibular interaction. Behav. Brain Res. 17: 221-234. Vidyasagar, T. R., A. Muller, and B. B. Lee (1985) Effects of bicuculline on the responses of cat striate cortical cells to moving sine-wave gratings. Neurosci. Lett. (Suppl.) 22: 297. Wolf, W., T. P. Hicks, and K. Albus (1986) The contribution of GABA-mediated inhibitory mechanisms to visual response properties of neurons in the kitten’s striate cortex. J. Neurosci. 6: 2779-2795. Wright, M. J. (1969) Visual receptive fields of cells in a cortical area remote from the striate cortex in the cat. Nature 223: 973-975. Zumbroich, T. J., and C. Blakemore (1987) Spatial and temporal selectivity in the suprasylvian visual cortex of the cat. J. Neurosci. 7: 482-500. Zumbroich, T. J., M. von Grunau, C. Poulin, and C. Blakemore (1986) Differences of visual field representation in the medial and lateral banks of the suprasylvian cortex (PMLSPLLS) of the cat. Exp. Brain Res. 64: 77-93.