of age, aiming to determine the temporal and spatial development of axonal ... of age. All subjects were imaged asleep without sedation. FA and axial and radial ...
ORIGINAL RESEARCH W. Gao W. Lin Y. Chen G. Gerig J.K. Smith V. Jewells J.H. Gilmore
Temporal and Spatial Development of Axonal Maturation and Myelination of White Matter in the Developing Brain BACKGROUND AND PURPOSE: Diffusion tensor imaging (DTI) has been widely used to investigate the development of white matter (WM). However, information about this development in healthy children younger than 2 years of age is lacking, and most previous studies have only measured fractional anisotropy (FA). This study used FA and radial and axonal diffusivities in children younger than 2 years of age, aiming to determine the temporal and spatial development of axonal maturation and myelination of WM in healthy children. MATERIALS AND METHODS: A total of 60 healthy pediatric subjects were imaged by using a 3T MR
imaging scanner. They were divided into 3 groups: 20 at 3 weeks, 20 at 1 year of age, and 20 at 2 years of age. All subjects were imaged asleep without sedation. FA and axial and radial diffusivities were obtained. Eight regions of interest were defined, including both central and peripheral WM for measuring diffusion parameters. RESULTS: A significant elevation in FA (P ⬍ .0001) and a reduction in axial and radial diffusivities (P ⬍ .0001) were observed from 22 days to 1 year of age, whereas only radial diffusivity showed significant changes (P ⫽ .0014) from 1 to 2 years of age. The region-of-interest analysis revealed that FA alone may not depict the underlying biologic underpinnings of WM development, whereas directional diffusivities provide more insights into the development of WM. Finally, the spatial development of WM begins from the central to the peripheral WM and from the occipital to the frontal lobes. CONCLUSIONS: With both FA and directional diffusivities, our results demonstrate the temporal and spatial development of WM in healthy children younger than 2 years of age.
T
he understanding of early human brain development, especially the maturation process of white matter (WM), is both of great scientific and clinical importance.1-4 Several studies have specifically focused on the development of WM in pediatric subjects by using MR imaging. Although it has been suggested that the most rapid pace of maturation of WM occurs during the first 2 years of life,2,5 the majority of the studies to date have been carried out on either the preterm neonate,3,4,6,7 older children,8,9 or a relatively small sample size during this critical period of time from birth to 2 years of age.1,5,10-13 Therefore, information on normal development of WM in very young children is insufficient. To this end, quantitative assessments of the WM in healthy children up to 2 years of age are highly desirable for the understanding of early WM maturation. Due to its sensitivity to the microscopic motion of water molecules, diffusion tensor imaging (DTI) has become the method of choice for the measurement of local water diffusion characteristics.14-16 The underlying physical mechanism is that the relative angle () between the direction of the applied Received July 31, 2008; accepted after revision September 16. From the Departments of Biomedical Engineering (W.G.), Radiology and Biomedical Research Imaging Center (W.L.), Radiology (Y.C., J.K.S., V.J.), and Psychiatry (J.H.G.), University of North Carolina at Chapel Hill, Chapel Hill, NC; and Scientific Computing and Imaging Institute (G.G.), Utah University, Salt Lake City, Utah. This work was supported by National Institutes of Health Grants R01NS055754 (W. Lin) and R01MH070890 (J.H. Gilmore). Please address correspondence to Weili Lin, PhD, University of North Carolina at Chapel Hill, Department of Radiology, CB #7515, Chapel Hill, NC 27599; e-mail: weili_lin@ med.unc.edu Indicates open access to non-subscribers at www.ajnr.org DOI 10.3174/ajnr.A1363
290
Gao 兩 AJNR 30 兩 Feb 2009 兩 www.ajnr.org
diffusion gradients and the direction of water diffusion determines the extent to which MR signal intensity is altered in the presence of diffusion gradients; the maximum signal-intensity reduction occurs at ⫽ 0 (parallel), whereas no signal-intensity change is anticipated at ⫽ 90° (perpendicular). Therefore, applying diffusion gradients along noncollinear directions, one can use a tensor matrix to characterize the directions of water diffusion. Subsequently, the 3 eigenvalues (1, 2, and 3) obtained through matrix diagonalization of the tensor matrix can be used to derive diffusion indices such as relative anisotropy, fractional anisotropy (FA), and volume ratio. Although these indices, especially FA, have been widely used to characterize diffusion anisotropy in various brain tissues, they lack the ability to provide more insights into the underlying microstructural changes of WM. Recently, Song et al and Budde et al17-19 proposed to separate the 3 eigenvalues (1, 2, and 3) into 2 parameters that may have different physiologic implications: parallel (1) and perpendicular (2 and 3), also known as axial diffusivity (储 ⫽ 1) and radial diffusivity (⬜ ⫽ (2 ⫹ 3)/2), respectively. With animal models of neurodegenerative diseases, Song et al and Budde et al17-19 demonstrated that a reduction of axial diffusivity may be indicative of axonal injury, whereas an elevation of radial diffusivity may reflect demyelination. Therefore, they concluded that using both the axial and radial diffusivities may provide more specific physiologic underpinnings of the microstructural changes in WM than those available through FA. In this study, axial and radial diffusivities with FA were used to characterize temporal and spatial developments of axonal maturation and WM myelination in healthy pediatric subjects during the first 2 years of life. Rapid axonal growth
and elongation and formation of new barriers to water mobility such as microtubules and myelination in WM are likely to affect both axial and radial diffusivities in different ways.17-19 Characterizing the changes of these directional diffusivities should shed new light on our understanding of the underlying microstructural development in WM during this essential developmental period. Materials and Methods Subjects
Region-of-Interest Analysis
Statistical Analysis The analysis of variance for multiple comparisons with age as the single factor was used for statistical analyses. A P ⬍ .05 was considered significant.
MR Imaging Acquisition All imaging was performed on a head-only 3T MR imaging unit (Allegra; Siemens Medical Systems, Erlangen, Germany). One image without diffusion gradients together with diffusion-weighted images along 6 gradient directions with a b-value of 1000 mm2/s was obtained. The acquisition was repeated 5 times for averaging. Other imaging parameters were the following: TR/TE ⫽ 7500/73 ms; section thickness ⫽ 2 mm with an intersection spacing of 2 mm; matrix size ⫽ 64 ⫻ 64; and an in-plane resolution ⫽ 2 ⫻ 2 mm2.
Postprocessing Diffusion-weighted images were transferred off-line for postprocessing by using software developed in-house. Six elements of the diffusion tensor were determined by multivariate least-squares fitting. Three eigenvalues and eigenvectors were obtained by tensor diago-
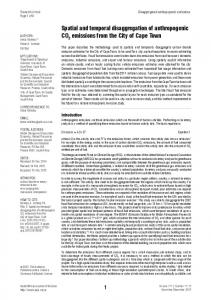
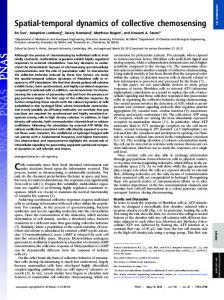
Results Representative examples of the axial and radial diffusivities and FA for the 3 age groups are shown in Fig 1, demonstrating the excellent image quality. It is apparent that marked changes in all 3 parameters are seen between neonates and 1-year-olds, whereas the differences between 1- and 2-year-olds are more subtle. A direct comparison of the 3 diffusion parameters among the 3 age groups is shown in Fig 2, where the values represent the mean of all regions of interest of each age. Consistent with the reported results in the literature, FA increases as a function of age; a significant increase in FA is observed from neonates to 1-year-olds (P ⬍ .0001), whereas the FA is comparable between 1- and 2-year-olds (P ⬎ .05). In contrast, both axial and radial diffusivities decrease with age. Similar to AJNR Am J Neuroradiol 30:290 –96 兩 Feb 2009 兩 www.ajnr.org
291
ORIGINAL RESEARCH
Eight regions of interest were placed on the mean FA maps for each age group by a board-certified neuroradiologist (V.J.). Attention was given to place the regions of interest at the center of the structure of interest so as to minimize variation. These regions of interest included the following: the genu of corpus callosum (GCC); splenium of corpus callosum (SCC); body of corpus callosum (BCC); posterior limb of internal capsule (IC); cortical-spinal tract (CST); optic radiation (OR); frontal peripheral WM (FPW); and posterior peripheral WM (PPW). These regions of interest were chosen such that both central and peripheral WM areas were included so as to assess the temporal and spatial alterations of diffusion anisotropy and directional diffusivities across different WM regions. The region-of-interest sizes varied between different groups, owing to the changes in brain size. For the neonate group, the number of voxels in each region of interest ranged from 8 to 20 with a median of 10, whereas the region-ofinterest sizes were similar between the 1- and 2-year-old groups and ranged from 10 to 45 with a median of 18 voxels. The values of FA and axial and radial diffusivities for each region of interest were then obtained for each individual subject, which were then used for subsequent group analysis.
PEDIATRICS
The study subjects were part of a large ongoing study of brain development in healthy and high-risk children.20 Pregnant women were recruited during the second trimester from the outpatient obstetrics and gynecology clinics at the University of North Carolina hospitals. Exclusion criteria were the presence of abnormalities on fetal sonography or major medical or psychotic illness in the mother. Informed consent was obtained from the parents, and the experimental protocols were approved by the institutional review board. None of the subjects were sedated for MR imaging. Before neonates were imaged, they were fed, swaddled, and fitted with ear protection. In contrast, for the children 1 and 2 years of age, the parent or a study coordinator held them and sat on a rocking chair inside the MR imaging scanner until the subject fell asleep. Headphones were put on the subject who was then placed in the head coil. With these procedures, most of the subjects slept during the imaging examination. We retrospectively identified 60 healthy subjects, including 20 neonates (12 male and 8 female; mean age, 22 ⫾ 10 days), 20 children 1 year of age (8 male and 12 female; mean age, 13 ⫾ 0.5 months), and 20 children 2 years of age (10 male and 10 female; mean age, 24 ⫾ 0.5 months) who met the following criteria: Inclusion criteria were birth between the gestational ages of 35 and 42 weeks, weight that was appropriate for gestational age, and the absence of major pregnancy and delivery complications as defined in the exclusion criteria. Exclusion criteria included maternal pre-eclampsia, placental abruption, neonatal hypoxia or any neonatal illness requiring ⬎1-day stay in the neonatal intensive care unit, a mother with human immunodeficiency virus, any mother actively using illegal drugs/narcotics during pregnancy, or any chromosomal or major congenital abnormality. In addition, all DTI images were visually inspected, and subjects with apparent motion in DTI images were excluded. Finally, a board-certified neuroradiologist (J.K.S.) reviewed all images to verify that there were no apparent abnormalities in the acquired MR images.
nalization, and subsequently, the axial and radial diffusivities were calculated. FA was calculated to measure the degree of anisotropy.21-23 The brain extraction tool algorithm of the FMRIB Software Library (Oxford Centre for Functional MRI of the Brain, Oxford University, UK) was applied to exclude all voxels outside the brain for further analysis. Subsequently, 1 subject in each age group was chosen as the template and bidirectional B-spline coregistration was performed, which ensured symmetry between source images and template images. The distance between knots of the 3D B-spline model was gradually decreased by half, leading to an increase of grid size of the 3D control point array from 5 ⫻ 5 ⫻ 5, 7 ⫻ 7 ⫻ 7, 11 ⫻ 11 ⫻ 11, and finally to 19 ⫻ 19 ⫻ 19. This allowed registration of individual subjects to their corresponding templates by using the FA maps. The transformation matrices were saved for each individual with subsequent coregistration of the axial and radial diffusivity maps to the templates. After registration, mean FA maps were calculated for each age group.
Fig 1. Representative examples of axial diffusivity, radial diffusivity, and FA from 3 subjects; 1 subject for each age group is shown. All images are scaled to the same window and level settings to allow a direct comparison across subjects. Both the axial and radial diffusivities decrease, whereas the FA increases with age.
Fig 2. The main values of the axial diffusivity, radial diffusivity, and FA from all 8 regions of interest are shown. A significant reduction (P ⬍ .0001) of both axial and radial diffusivities and elevation (P ⬍ .0001) of FA are observed from neonates to 1-year-olds. The changes from 1- to 2-year-olds are more subtle for both axial diffusivity and FA, whereas a significant reduction (P ⫽ .0014) in radial diffusivity is observed. The labels for the left and right y-axis represent the directional diffusivities and FA, respectively.
that observed in FA, the major changes of axial and radial diffusivities occur between neonates and 1-year-olds (P ⬍ .0001), whereas only the radial diffusivity exhibits significant reduction from 1- to 2-year-olds (P ⫽ .0014). For further examination of how WM maturation differs with age across different anatomic regions, the Table summa292
Gao 兩 AJNR 30 兩 Feb 2009 兩 www.ajnr.org
rizes the 3 diffusion parameters of all regions of interest. The general pattern follows that observed in Fig 2; FA increases and both axial and radial diffusivities decrease with age for all regions of interest. However, there is a substantial variability across different anatomic regions. Figure 3 provides more detailed analysis on anatomic locations exhibiting statistical differences among groups. All 3 diffusion parameters are highly significantly different between neonates and 1-year-olds for all regions of interest. In contrast, anatomic regions exhibiting statistical changes differ among the 3 diffusion parameters between the 1- and 2-year-old groups. For the axial diffusivity, only the FPW and OR show significant changes. Most interesting, with the exception of SCC, all regions of interest exhibit significant changes for radial diffusivity from 1- to 2-yearolds, albeit the statistical significance levels are different. Finally, with the exception of the FPW and SCC, the FA is statistically different between 1- and 2-year-olds for all remaining regions of interest. The rates of increase/decrease of diffusion parameters with age are shown in Fig 4 for different anatomic regions. The axial and radial diffusivities and FA of 1- and 2-year-old groups are normalized to the corresponding values at each region of interest of the neonatal group. A rapid decrease in both axial and radial diffusivities with a marked increase in FA is observed from neonates to 1-year-olds, followed by relatively stable axial and radial diffusivities and FA from 1- to 2-year-olds. Radial diffusivity reveals a much larger reduction than axial diffusivity from neonates to 1-year-olds. The reduction of axial diffusivity between neonates and 1-year-olds ranges from almost no change (94.5%) for CST to 76% in neonates for FPW. In contrast, the smallest reduction of radial diffusivity is 79% (OR) and the largest is 44% (SCC) for neonates. The most substantial increase in FA from neonates to 1-year-olds is in the FPW, whereas the smallest is in the CST. Finally, the comparisons of the 3 diffusion measures at the same age but in different anatomic areas reveal the spatial behaviors of WM maturation (Fig 5). Fig 5 is shown in such a way that the values of axial diffusivity and FA are sorted in a descending order, whereas the radial diffusivity is sorted in an ascending order on the basis of the values of the 2-year-old group. Generally speaking, the results from the 1- (pink line) and 2-year-old groups (green line) show a consistent trend, whereas the neonate group (blue line) is more variable and does not follow the same patterns as those shown in 1-and 2-year-old groups. The general trend indicates that the corpus callosum (GCC, SCC, BCC) has the highest axial diffusivity and FA, followed by the CST, OR, IC; and the lowest is in the peripheral WM area (PPW, FPW). The radial diffusivity increases follow a pattern similar to that of the axial diffusivity with the exception that the development of the IC appears more advanced compared with that of the GCC and BCC. Discussion DTI has been widely used to assess WM maturation in pediatric subjects.1-12,24,25 However, few studies thus far have specifically focused on the age range investigated in our study, particularly with a large sample size. In addition, most of the studies to date have mainly used FA to delineate WM maturation, which may not provide the underlying microstructural changes with age. In this study, both axial and radial diffusivi-
Measurements of FA, axial, and radial diffusivities* Axial Diffusivity (10⫺3 s/mm2) SCC
3 weeks 2.30 ⫾ 0.1
BCC
2.06 ⫾ 0.1
GCC
2.26 ⫾ 0.14
CST
1.81 ⫾ 0.09
OR
1.86 ⫾ 0.09
IC
1.76 ⫾ 0.04
PPW
1.89 ⫾ 0.13
FPW
1.76 ⫾ 0.17
1 year 1.90 ⫾ 0.09 (0.83) 1.91 ⫾ 0.07 (0.81) 1.82 ⫾ 0.07 (0.93) 1.71 ⫾ 0.07 (0.89) 1.60 ⫾ 0.05 (0.94) 1.56 ⫾ 0.04 (0.86) 1.47 ⫾ 0.09 (0.78) 1.33 ⫾ 0.05 (0.76)
2 years 1.93 ⫾ 0.1 (0.84) 1.93 ⫾ 0.06 (0.8) 1.80 ⫾ 0.05 (0.94) 1.75 ⫾ 0.06 (0.88) 1.58 ⫾ 0.05 (0.97) 1.54 ⫾ 0.04 (0.85) 1.43 ⫾ 0.08 (0.76) 1.22 ⫾ 0.06 (0.69)
Radial Diffusivity (10⫺3 s/mm2) 3 weeks 0.79 ⫾ 0.1 1.0 ⫾ 0.1 0.89 ⫾ 0.13 0.88 ⫾ 0.06 0.90 ⫾ 0.08 0.64 ⫾ 0.04 1.14 ⫾ 0.08 1.28 ⫾ 0.13
1 year 0.35 ⫾ 0.06 (0.44) 0.58 ⫾ 0.09 (0.53) 0.47 ⫾ 0.07 (0.58) 0.57 ⫾ 0.05 (0.67) 0.71 ⫾ 0.05 (0.65) 0.43 ⫾ 0.02 (0.79) 0.78 ⫾ 0.05 (0.68) 0.78 ⫾ 0.04 (0.61)
2 years 0.33 ⫾ 0.06 (0.42) 0.4 ⫾ 0.03 (0.45) 0.40 ⫾ 0.08 (0.4) 0.49 ⫾ 0.12 (0.98) 0.51 ⫾ 0.08 (0.56) 0.63 ⫾ 0.04 (0.57) 0.7 ⫾ 0.04 (0.61) 0.70 ⫾ 0.05 (0.55)
FA 3 weeks 0.60 ⫾ 0.05 0.44 ⫾ 0.05 0.54 ⫾ 0.05 0.44 ⫾ 0.03 0.43 ⫾ 0.03 0.57 ⫾ 0.03 0.32 ⫾ 0.03 0.22 ⫾ 0.02
1 year 0.8 ⫾ 0.03 (1.33) 0.65 ⫾ 0.05 (1.3) 0.7 ⫾ 0.04 (1.48) 0.62 ⫾ 0.03 (1.18) 0.49 ⫾ 0.03 (1.41) 0.67 ⫾ 0.02 (1.14) 0.4 ⫾ 0.05 (1.25) 0.34 ⫾ 0.03 (1.55)
2 years 0.81 ⫾ 0.03 (1.35) 0.71 ⫾ 0.07 (1.37) 0.74 ⫾ 0.05 (1.61) 0.67 ⫾ 0.04 (1.19) 0.53 ⫾ 0.03 (1.52) 0.68 ⫾ 0.03 (1.23) 0.44 ⫾ 0.04 (1.38) 0.36 ⫾ 0.05 (1.64)
Note:—FA indicates fractional anisotropy; SCC, splenium of corpus callosum; BCC, body of corpus callosum; GCC, genu of corpus callosum; CST, corticospinal tract; OR, optic radiation; IC, posterior limb of internal capsule; PPW, posterior peripheral white matter; FPW, frontal peripheral white matter. * The values are expressed as mean ⫾ SD. Both the 1- and 2-year-old values are normalized to the corresponding values of the neonates for each region, and the results are provided in the parentheses.
Fig 3. Statistical comparison results overlaid on FA maps are shown. Note that the red/yellow/green regions of interest are shown for illustration. The body of the corpus callosum should be located on a different section, but it was shown on the same section for visualization.
ties along with FA were used, aiming to gain more insight into the underlying biologic developments associated with WM maturation, namely axonal growth and myelination. Consistent with the results reported in the literature,2,5,26-30 a marked increase in FA from neonates to 1-year-olds is observed, followed by a more subtle increase from 1- to 2-year-olds. The region-of-interest analysis offers additional details regarding the spatial pattern of WM maturation. Specifically, all 8 regions of interest exhibit a highly significant (P ⬍ .0001) elevation of FA from neonates to 1-year-olds (Fig 2), indicating a rapid development of WM during the first year of life. However, with the exception of CST and OR, which exhibit highly significant elevation of FA from 1- to 2-year-olds (P ⬍ .001), the level of statistical significance is reduced (P ⬍ .05) in GCC, BCC, and PPW. In addition, the FA values in the SCC, IC, and FPW are comparable between the 1- and 2-year-old groups, though the physiologic underpinnings for the lack of FA changes in SCC, IC, and FPW may differ. It is plausible that
both SCC and IC are well developed by 1 year of age and thus exhibit subtle changes in FA (Table). In contrast, the FA values are approximately 0.3 at the FPW at 1 and 2 years of age and thus most likely reflect the slow pace of WM development in the frontal lobe from 1 to 2 years of age. However, caution should be taken in interpreting these results on the basis of FA findings alone and consideration should be given in the context of both axial and radial diffusivities. In addition to FA measurements, both axial and radial diffusivities, reflecting axonal growth and formation of new barriers and myelination,17-19 respectively, were used in our studies to provide potentially additional insights into WM development from 3 weeks to 2 years of age. Haynes et al4 used GAP43, a marker of axonal growth and elongation, to analyze parietal central WM tissues. They showed a high level of GAP43 staining from 24 to 64 postconceptional (PC) weeks, which span the pre- and postnatal periods, implying rapid axonal development, which progressed to a slower adultlike level of axonal development beyond 17 postnatal months (⬃1.5 postnatal year). In contrast, myelination begins from 54 PC weeks (⬃2.5 postnatal months) to 72–92 PC weeks (⬃6.5 postnatal months to 11.5 postnatal months), spanning approximately the entire first year after birth. Together, these results suggest that the onset of axonal growth is earlier (prenatal) and most rapid during the first 5 postnatal months, whereas myelin maturation begins about 2.5 months postnatally and continues throughout the first year of life. Therefore, with regard to measurements of axial and radial diffusivities, one would expect smaller changes of axial diffusivity during the first year of life than in radial diffusivity (myelination) because maturation of myelin is the dominant process during this period of life. Indeed, Partridge et al3 reported smaller changes of 1 (axial diffusivity), whereas both 2 and 3 (radial diffusivity) exhibited a marked change in 14 preterm neonates imaged at gestational ages between 28 and 43 weeks. Similarly, our study (Fig 4) demonstrates the extent to which radial and axial diffusivity reduction differs during the first year of life; the axial diffusivity decreases to approximately AJNR Am J Neuroradiol 30:290 –96 兩 Feb 2009 兩 www.ajnr.org
293
Fig 4. Comparisons of axial diffusivity (A), radial diffusivity (B ), and FA (C ) across age. The experimentally measured values of the 1- and 2-year-old groups are normalized to that of the neonates.
Fig 5. Comparisons of the axial diffusivity (A), radial diffusivity (B ), and FA (C ) across regions of interest but at the same age are shown.
0.75 ⬃ 0.95, whereas radial diffusivity reduces to 0.44 ⬃ 0.69 of that in the neonate group, suggesting more rapid myelination than axonal growth from 3 weeks to 1 year of age. Our findings are thus highly consistent with those reported by Haynes et al.4 Whereas all 8 regions of interest exhibit significant changes of axial and radial diffusivities from neonates to 1-year-olds, these same regions begin to differ with regard to how the axial and radial diffusivities change from 1 to 2 years of age (Fig 3). The OR and FPW reveal significant changes in axial diffusivity consistent with continued axonal development, whereas with the exception of the SCC, the remaining 7 regions of interest exhibit significant changes in radial diffusivity, suggesting that myelination is the dominant process during the second year of life in these areas. In addition, as mentioned previously, no changes in FA were observed in SCC, IC, and FPW from 1 to 2 294
Gao 兩 AJNR 30 兩 Feb 2009 兩 www.ajnr.org
years of age. Based on the FA findings, our initial interpretations, as discussed previously, were that the SCC and IC are well developed, whereas the developmental pace in FPW is slow. Consistent with the finding of FA, no changes in both axial and radial diffusivities were observed in the SCC. However, some discrepancies were observed in both the IC and FPW. Both axial and radial diffusivities exhibited significant changes in the FPW, indicating continuing rapid myelination and axonal growth during this period in contradistinction to our original interpretation based on FA. In addition, a significant reduction of radial diffusivity in the IC was observed, suggesting continuing myelination. Furthermore, although a significant elevation in FA was observed at the CST, GCC, BCC, and PPW between 1 and 2 years of age, these regions only exhibited significant changes in radial but not axial diffusivity, suggesting that they are going
through extensive myelination but not axonal growth during this period of life. Together, these results underscore the importance of using axial and radial diffusivities and reveal the limited specificity of using solely FA to characterize the development of WM. Nevertheless, the radial diffusivity measurements assume that the axons exhibit a perfect cylindric shape with no contributions to the diffusivity perpendicular to the axons. As a result, effects of astrocytes, microglia, and cell surface molecules that extended into the interstitium were ignored. Our comparison of diffusion parameters by using regions of interest in each age group reveals the spatial maturation pattern of WM. Despite the neonatal group variability, the general maturation pattern begins centrally (SCC, GCC, and BCC), followed by GST, IC, OR, and peripheral WM (PPW and FPW) development as well as from the occipital (PPW) to the frontal (FPW) lobes. These findings are consistent with the results reported by Flechsig27 and Volpe.31 Most interesting, although discrepancies regarding the rates and anatomic locations among the 3 diffusion parameters were observed, the general spatial pattern was consistently depicted by using the 3 diffusion parameters. Song et al17,18 hypothesized and subsequently demonstrated in animal models that a reduction of axial diffusivity was associated with axonal injury in mouse models. Contrary to their conclusion, we demonstrated that axial diffusivity decreases from the neonatal period to 2 years of age, which clearly cannot be explained by axonal injury. In addition, it has also been reported by Ashtari et al32 that axial diffusivities increase and that there are no changes in radial diffusivity with age. These authors speculated that the reduction of fiber tortuosity yields more straightened fibers, improving axonal fiber organization and potentially leading to an increase of axial diffusivity.32 The discrepancies between our findings and these studies can potentially be explained by the following factors: First, subjects with a mean age of 16.6 years were studied by Ashtari et al, which is clearly much older than the children in our studies. Second, it has been documented that axonal pruning occurs, resulting in refinement of the embryonic nervous system during early development.33 Thus, the intermingling of axonal branches, the elimination of overabundant axons, and the reduction of the length of axons during the refinement process may potentially account for the observed reduction in axial diffusivity.34,35 Finally, postnatal development of the fiber cytoskeleton (ie, the formation of microtubules and neurofilaments36) may also contribute to the decreased axial diffusivity as new barriers form. Therefore, it is plausible that the relationship between axial diffusivity and age is biphasic, where a reduction of axial diffusivity is present during the first years of life, followed by an elevation of axial diffusivity at a later age. Specifically, axonal pruning and formation of new barriers may be the dominant factor resulting in the observed reduction of axial diffusivity. However, once axonal pruning and cytoskeleton development reach a plateau, fiber straightening may then become the dominant factor, leading to increased axial diffusivity at a later age. These physiologic alterations may also explain the gradual decreasing pattern of axial diffusivity from the central WM (ie, different parts of CC) to the peripheral WM (Fig 5A), because the central WM is more likely to have well-organized straight
fibers, whereas axonal fibers become less organized in the more peripheral areas. Nevertheless, more studies with a wider age range are needed to determine further at what age the axial diffusivity starts to increase after birth. Two potential limitations associated with our study need further discussion. First, 6 diffusion-gradient directions were used in our study. The choice of the number of diffusiongradient directions reflects a balance between the data-acquisition time and signal-intensity-to-noise ratio of DTI for imaging nonsedated pediatric subjects. Although the use of 6 diffusion-gradient directions may lead to inaccurate measurements of diffusion tensors,37,38 because a region-of-interest approach was used with a large sample size, the potential inaccuracy in tensor measurements should not affect the overall conclusions of our study. Second, despite the histologic correlatives reported by Song et al17,18 and Kim et al39,40 indicating that axial and radial diffusivities may reflect axonal integrity and myelination, definitive physiologic underpinnings of axial and radial diffusivities remain to be enlightened. Therefore, although our results appear to be consistent with the general understanding of the WM maturation in pediatric subjects, the interpretation of our results should be in the context of these limitations. Conclusions Using both FA and directional diffusivities, namely axial and radial diffusivities, this study aimed to determine the spatial and temporal characteristics of WM development in healthy children from 3 weeks to 2 years of age, an age range that currently lacks sufficient data. Our results demonstrate that the major changes of FA and radial and axial diffusivities occur from 3 weeks to 1 year for all regions investigated—with elevations of FA and reductions of both axial and radial diffusivities. In addition, much larger reductions in radial diffusivity were observed compared with those demonstrated in axial diffusivity, suggesting that myelination is the dominant process during the first year of life. In contrast, the changes between 1 and 2 years of age were more subtle, though statistical differences were observed in radial diffusivity, suggesting a pruning process. In addition, our results indicate that FA alone cannot differentiate the components of WM maturation. Our study reveals more insight into the underlying biologic changes of WM, which are only obtained when all 3 diffusion parameters are interpreted together. Finally, comparing diffusion parameters across different regions of interest in each age group reveals that the development of WM begins from the center to the peripheral WM and from the occipital to the frontal lobes.
References 1. McGraw P, Liang L, Provenzale JM. Evaluation of normal age-related changes in anisotropy during infancy and childhood as shown by diffusion tensor imaging. AJR Am J Roentgenol 2002;179:1515–22 2. Mukherjee P, Miller JH, Shimony JS, et al. Diffusion-tensor MR imaging of gray and white matter development during normal human brain maturation. AJNR Am J Neuroradiol 2002;23:1445–56 3. Partridge SC, Mukherjee P, Henry RG, et al. Diffusion tensor imaging: serial quantitation of white matter tract maturity in premature newborns. Neuroimage 2004;22:1302–14 4. Haynes RL, Borenstein NS, Desilva TM, et al. Axonal development in the cerebral white matter of the human fetus and infant. J Comp Neurol 2005;484:156 – 67 5. Schneider JF, Il’yasov KA, Hennig J, et al. Fast quantitative diffusion-tensor
AJNR Am J Neuroradiol 30:290 –96 兩 Feb 2009 兩 www.ajnr.org
295
6.
7.
8.
9. 10.
11.
12.
13.
14. 15. 16.
17.
18. 19. 20.
21. 22.
296
imaging of cerebral white matter from the neonatal period to adolescence. Neuroradiology 2004;46:258 – 66. Epub 2004 Mar 4 Huppi PS, Maier SE, Peled S, et al. Microstructural development of human newborn cerebral white matter assessed in vivo by diffusion tensor magnetic resonance imaging. Pediatr Res 1998;44:584 –90 Counsell SJ, Shen Y, Boardman JP, et al. Axial and radial diffusivity in preterm infants who have diffuse white matter changes on magnetic resonance imaging at term-equivalent age. Pediatrics 2006;117:376 – 86 Schmithorst VJ, Wilke M, Dardzinski BJ, et al. Correlation of white matter diffusivity and anisotropy with age during childhood and adolescence: a cross-sectional diffusion-tensor MR imaging study. Radiology 2002;222:212–18 Snook L, Paulson LA, Roy D, et al. Diffusion tensor imaging of neurodevelopment in children and young adults. Neuroimage 2005;26:1164 –73 Mukherjee P, Miller JH, Shimony JS, et al. Normal brain maturation during childhood: developmental trends characterized with diffusion-tensor MR imaging. Radiology 2001;221:349 –58 Miller JH, McKinstry RC, Philip JV, et al. Diffusion-tensor MR imaging of normal brain maturation: a guide to structural development and myelination. AJR Am J Roentgenol 2003;180:851–59 Hermoye L, Saint-Martin C, Cosnard G, et al. Pediatric diffusion tensor imaging: normal database and observation of the white matter maturation in early childhood. Neuroimage 2006;29:493–504 Zhai G, Lin W, Wilber KP, et al. Comparisons of regional white matter diffusion in healthy neonates and adults performed with a 3.0-T head-only MR imaging unit. Radiology 2003;229:673– 81 Basser PJ. Inferring microstructural features and the physiological state of tissues from diffusion-weighted images. NMR Biomed 1995;8:333– 44 Basser PJ, Pajevic S, Pierpaoli C, et al. In vivo fiber tractography using DT-MRI data. Magn Reson Med 2000;44:625–32 Xue R, van Zijl PC, Crain BJ, et al. In vivo three-dimensional reconstruction of rat brain axonal projections by diffusion tensor imaging. Magn Reson Med 1999;42:1123–27 Song SK, Sun SW, Ju WK, et al. Diffusion tensor imaging detects and differentiates axon and myelin degeneration in mouse optic nerve after retinal ischemia. Neuroimage 2003;20:1714 –22 Song SK, Yoshino J, Le TQ, et al. Demyelination increases radial diffusivity in corpus callosum of mouse brain. Neuroimage 2005;26:132– 40 Budde MD, Kim JH, Liang HF, et al. Toward accurate diagnosis of white matter pathology using diffusion tensor imaging. Magn Reson Med 2007;57:688 –95 Gilmore JH, Lin W, Prastawa MW, et al. Regional gray matter growth, sexual dimorphism, and cerebral asymmetry in the neonatal brain. J Neurosci 2007;27:1255– 60 Pierpaoli C, Basser PJ. Toward a quantitative assessment of diffusion anisotropy. Magn Reson Med 1996;36:893–906 Basser PJ, Pierpaoli C. Microstructural and physiological features of tissues
Gao 兩 AJNR 30 兩 Feb 2009 兩 www.ajnr.org
23. 24. 25.
26. 27. 28. 29.
30.
31. 32.
33. 34.
35. 36.
37. 38.
39.
40.
elucidated by quantitative-diffusion-tensor MRI. J Magn Reson B 1996;111:209 –19 Basser PJ, Mattiello J, LeBihan D. Estimation of the effective self-diffusion tensor from the NMR spin echo. J Magn Reson B 1994;103:247–54 Huang H, Zhang J, Wakana S, et al. White and gray matter development in human fetal, newborn and pediatric brains. Neuroimage 2006;33:27–38 Gilmore JH, Lin W, Corouge I, et al. Early postnatal development of corpus callosum and corticospinal white matter assessed with quantitative tractography. AJNR Am J Neuroradiol 2007;28:1789 –95 Dobbing J, Sands J. Quantitative growth and development of human brain. Arch Dis Child 1973;48:757– 67 Flechsig P. Developmental (myelogenetic) localisation of the cerebral cortex in the human. Lancet 1901;158:1027–30 Keene MFL, Hewer EE. Some observations on myelination in the human central nervous system. J Anat 1931;66:1–13 Kinney HC, Brody BA, Kloman AS, et al. Sequence of central nervous system myelination in human infancy. II. Patterns of myelination in autopsied infants. J Neuropathol Exp Neurol 1988;47:217–34 Yakovlev P, Lecours A. The myelogenetic cycles of regional maturation of the brain. In: Minkowski A, ed. Regional Development of the Brain in Early Life. Oxford, UK: Blackwell; 1967:3–70 Volpe JJ. Neurology of the Newborn. Philadelphia: Saunders; 1995 Ashtari M, Cervellione KL, Hasan KM, et al. White matter development during late adolescence in healthy males: a cross-sectional diffusion tensor imaging study. Neuroimage 2007;35:501–10 Kantor DB, Kolodkin AL. Curbing the excesses of youth: molecular insights into axonal pruning. Neuron 2003;38:849 –52 Richards LJ, Plachez C, Ren T. Mechanisms regulating the development of the corpus callosum and its agenesis in mouse and human. Clin Genet 2004;66:276 – 89 Bockhorst KH, Narayana PA, Liu R, et al. Early postnatal development of rat brain: in vivo diffusion tensor imaging. J Neurosci Res 2008;86:1520 –28 Cuenca N, Fernandez E, de Juan J, et al. Postnatal development of microtubules and neurofilaments in the rat optic nerve: a quantitative study. J Comp Neurol 1987;263:613–17 Jones DK. The effect of gradient sampling schemes on measures derived from diffusion tensor MRI: a Monte Carlo study. Magn Reson Med 2004;51:807–15 Jones DK, Horsfield MA, Simmons A. Optimal strategies for measuring diffusion in anisotropic systems by magnetic resonance imaging. Magn Reson Med 1999;42:515–25 Kim JH, Loy DN, Liang HF, et al. Noninvasive diffusion tensor imaging of evolving white matter pathology in a mouse model of acute spinal cord injury. Magn Reson Med 2007;58:253– 60 Kim JH, Trinkaus K, Ozcan A, et al. Postmortem delay does not change regional diffusion anisotropy characteristics in mouse spinal cord white matter. NMR Biomed 2007;20:352–59