Development of Tactile Graph Generation Software Using
the R Statistics Software Environment Kosuke Araki
Tetsuya Watanabe
Kazunori Minatani
Graduate School of Science & Technology University of Niigata Niigata, Japan
Department of Biocybernetics Faculty of Engineering University of Niigata Niigata, Japan
National Center for University Extrance Examinations Tokyo, Japan
[email protected]
[email protected] u.ac.jp
ABSTRACT
[email protected]
difficult for blind people to generate tactile graphs by them selves. Based on this state of affairs, we have worked on the de velopment of software that makes it easy to generate several different types of tactile graph and is capable of being used by blind and sighted people alike. This software is pro vided as a Web application, making it easy for anyone to obtain tactile graphs. We developed it using R, which is a statistics software environment with specialized drawing functions. Tactile graphs can be generated by the simple method of microcapsule paper, which is widely used in ed ucation.
We have worked on the development of software that uses the R statistics software environment to automatically gen erate tactile graphs–i.e., graphs that can be read by blind people using their sense of touch. We released this software as a Web application to make it available to anyone, from anywhere. This Web application can automatically generate images for tactile graphs from numerical data in a CSV file. This report discusses the Web application’s functions and operating procedures.
Categories and Subject Descriptors H.5.2 [Information Interfaces and Presentation]: User Inter faces
2. THE R STATISTICS SOFTWARE R is a statistics software environment with specialized sta tistical analysis and drawing functions. It also includes pro gramming functions. It is free software, and can be obtained from the Comprehensive R Archive Network (CRAN) web site[1]. Since R is compatible with various operating sys tems, it can be used by anyone. There were two reasons why we chose R for the develop ment of tactile graph generation software: (1) R is capable of changing various graph parameters, and to fine-tune settings such as the line thickness, the for mat of the axes, and the text font. It is therefore possible to generate tactile graphs with layouts that are suitable for reading by touch. (2) Availability of package for the creation of Web appli cations. There is a package for R called Shiny that can turn R programs into Web applications.
General Terms Human Factors
Keywords Blind Persons; Tactile Graphs; R Statistical Software; Web Application
1. INTRODUCTION Graphs are used to represent changes, trends and corre lations in data. Since graphs are generally visual represen tations, it is difficult for blind people to use them. One way of supporting the use of graphs by blind people is to gener ate ”tactile graphs” that can be read by the sense of touch. The task of generating tactile graphs is usually performed manually by helpers such as Braille translation volunteers and teachers at schools for the blind. Consequently, the preparation of tactile graphs can require considerable time and effort, making it impossible for blind people to obtain tactile graphs straight away. Another problem is that it is
3. TACTILE GRAPH GENERATION SOFT WARE 3.1
Overview
Our Web application software reads numerical data from a CSV file, accepts user input such as the title of the graph, and automatically generates images for tactile graphs based on this information. The resulting images are printed on microcapsule paper and passed through a heater to produce the finished tactile graphs.
Permission to make digital or hard copies of part or all of this work for personal or classroom use is granted without fee provided that copies are not made or distributed for profit or commercial advantage, and that copies bear this notice and the full ci tation on the first page. Copyrights for third-party components of this work must be honored. For all other uses, contact the owner/author(s). Copyright is held by the author/owner(s). ASSETS ’14 , Oct 20-22 2014, Rochester, NY, USA ACM 978-1-4503-2720-6/14/10. http://dx.doi.org/10.1145/2661334.2661389.
3.2
Development environment
We used the Mac OS X operating system (version 10.9).
251
We used R (version 3.1.0) as the development language, together with the RStudio (version 0.98.507) integrated de velopment environment (IDE). We also used the Shiny pack age (version 0.9.1) to convert the R program into a Web application.
3.3 Software operating method A screenshot of the Web application is shown in Fig. 1. At the top left of the screen is a file selection button for selecting the CSV file. Below that is a set of radio buttons for changing types of the graph to be generated. These are followed by a set of textboxes for setting the graph title and the units and ranges of each axis. The graph image is displayed on the right side of the screen. This graph image immediately reflects any changes the user makes to the graph parameters. Below the graph image, there is a download button. Users operate the Web application as follows: (1) Select CSV file A CSV file is selected, and the numerical data is read in by the software. At this point, a graph image of the selected data is displayed at the right side of the screen. (2) Select graph type The type of tactile graph is selected from the following: scatter plot, line graph, bar graph and pie chart. (3) Select font The style of text displayed in the graph can be selected from inked characters and Braille characters. Using inked characters, it is possible for a sighted person to operate the software while checking that there are no errors in the graph’s text annotations. (4) Select whether or not to include grid lines The user can choose whether or not grid lines should be included in the graph. (5) Input titles The user enters titles for the graph and for the horizontal and vertical axes. (6) Set y-axis range The display range of the graph can be set by entering minimum and maximum values for the y axis. If not set, the y-axis range of the graph is set from the minimum and maximum values of the numerical data. (7) Save the results The tactile graph image can be saved by clicking the download button. The image is then saved as a PNG file in the user’s download folder. (8) Print and develop the image The saved image can be printed on microcapsule paper by an ordinary printer. When passed through a heater, the black parts form raised bumps to produce the final tactile graph.
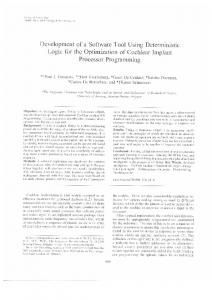
Figure 1: Screenshot of the Web application
Figure 2: Example of a tactile line graph vertical axis appears below this title. The horizontal axis units are positioned at the very bottom of the graph. The line graph and the grid/frame lines are represented by two types of line with different line styles and thick nesses. The line graph is represented by a dot-dash line, using a 1-mm-thick solid line for the line segments, and 3 mm-diameter dots for the dots. The grid lines and frame line are represented by solid lines with a thickness of ap proximately 0.5 mm. The line thicknesses and dot diame ters were determined according to the guidelines for tactile illustration (such as [2]).
4.
3.4 Content of tactile graphs
FUTURE WORK In the future, we will work on the following two issues: (1) Increase the kinds of graph generated. (2) User evaluation
Fig. 2. shows an example of a tactile line graph generated using this software. The elements of the tactile graph are the line graph itself, the graph title, the text annotation for the vertical axis, the units of the horizontal axis, the axis labels, grid lines and an exterior frame. The characters and numbers in the graph title, axis units and axis labels are displayed in Braille, and are all oriented horizontally. The graph title is positioned at the very top of the tactile graph, and a description of the units on the
5.
REFERENCES
[1] The Comprehensive R Archive Network, http://www.cran.r-project.org/. [2] The N.S.W. Tactual and Bold Print Mapping Committee, A Guide for the Production of Tactual and Bold Print Maps 3rd Edition, Sydney, 2006.
252