Jun 30, 2008 - morphometric rules can be related to Brooks' Law. Przibram's ..... Kesling, R.V. (1953): A slide rule for the determination of instars in ostracod ...
Senckenbergiana lethaea
88
(1)
183 –193
5 text-figs, 2 tabs
Frankfurt am Main, 30.06.2008
Dedicated to Prof. Dr. F. F. Steininger
Developmental trajectories in geographically separated populations of non-marine ostracods: morphometric applications for palaeoecological studies With 5 Text-figures and 2 Tables
Dan L. Danielopol, Angel Baltanás, Tadeusz Namiotko, Walter Geiger, Maria Pichler, Montserrat Reina & Gertraud Roidmayr
Ab s t r a c t Developmental trajectories refer here to patterns of size and shape changes in ostracod valves during the sequence of post-embryonic growth stages. The information obtained from the study of such patterns has significant applications for evolutionary biology and/or (palaeo) ecology. Using geometric morphometrics methods, we describe the developmental trajectories of three ostracod species with valves retrieved from the sediments of lakes Mondsee (Austria), Hańcza (Poland) and Iseo (Italy). Size and shape data result in distinct developmental trajectories. Ontogenetic changes agree with predictions of Prizbram’s and Brooks’ laws. Patterns of valve shape change provide information which might be of use to the taxonomic definition of evolutionary lineages and to the development of studies of allometry and heterochrony in nonmarine ostracods. Key words: Ostracoda, developmental trajectories, comparative morphology, ecology
Introduction It has been long recognized that ostracods have a set of features which makes them ideal objects for evolutionary and ecological studies (see, for instance, the recent collection of papers in Holmes & Chivas 2002, Park & Smith 2003). Those features include high taxonomic and ecological diversity and an excellent fossil record. Additional characteristics of no minor importance are connected to ostracod ontogeny. Attributes such as determinate growth and the possession of a fixed number of growth instars provide the basis not only for the study of (palaeo-)population dynamics but for an accurate account of ontogenetic patterns as well. Because knowledge of ontogeny is the gateway to understand evolution (Gould 1977, Alberch et al. 1979), one should expect ontogenetic studies to pervade
ostracod literature, but they do not. Concerning non-marine ostracods, there are several studies which deal with the development of ostracod larvae and describe their instars (see Meisch 2000: 28, for a brief account); but a consistent approach to the topic, both conceptual and methodological, seems to be lacking. Quite unexpectedly, this occurs even though morphometric methods for the analysis of size and shape of biological objects, the raw variables for the analysis and comparison of ontogenetic changes, have significantly developed and are now easily accessible for neontologists and palaeontologists alike (Rohlf 1990, Reyment & Bookstein 1993, Reyment 1995, Lestrel 1997, McLellan & Endler 1998, MacLeod 1999, Danielopol et al. 2002, Baltanás et al. 2003, Zelditch et al. 2004). Indeed, there have been several attempts to establish a morphometric approach for the study of ostracod ontogeny
Prof. Dr Dan L. Danielopol (Corresponding author ), Österreichische Akademie der Wissenschaften, Kommission für die paläontologische und stratigraphische Erforschung Österreichs, c/o Institut für Erdwissenschaften, Universität Graz, Heinrichstr. 26, A-8010 Graz, Austria; Dr Angel Baltanás, Dr Walter Geiger, Montserrat Reina, Departamento de Ecología, Universidad Autónoma de Madrid, E-28049 Madrid, Spain; Tadeusz Namiotko, Universytet Gdański, Instytut Biologii (Katedra Genetiki), Kładki 24, PL-80-822 Gdańsk, Poland; Maria Pichler, Gertraud Roidmayr, Österreichische Akademie der Wissenschaften, Institut für Limnologie, Mondseestrasse 9, A-5310 Mondsee, Austria.
184
Developmental trajectories in geographically separated populations of non-marine ostracods: morphometric applications …
(Schweitzer et al. 1986, Maness & Kaesler, 1987, Foster & Kaesler 1988, Kaesler & Foster 1988; Schweitzer & Lohmann 1990, Irizuki & Sasaki 1993, Baltanás et al. 2000) but their success, in terms of actually setting such methodology among ostracodologists, has been very limited. This paper stresses the relevance of ontogenetic studies and the convenience of applying available morphometric methods to them. An additional goal is to contribute to shrink the gap between palaeontologists and neontologists by introducing (morphometric) methods that are equally applicable to recent and fossil ostracods. Size and shape and their variation during ontogeny are the variables under scrutiny. Shape is all the geometrical information that remains when location, scale and rotational effects are drained out from an object (Kendall 1977, Dryden & Mardia 1998). Keeping shape and size as different, although related, attributes is in agreement with the ‘geometric morphometrics’ concept of ‘form’ originally developed by Needham (1950) [Form = Size + Shape] and later expanded by Lestrel (1997, 2000) [Form = Size + Shape + Orientation + Surface + Substance + ...]. Living ostracods can be allocated to the corresponding ontogenetic larval stage according to soft part features (Meisch 2000), but fossil ostracods cannot. Instead, fossil specimens are assigned to instars either using instar-specific morphologies (mainly shape) or, most frequently, based on the presence of discrete clusters in size (Hunt & Chapman 2001). Size can be easily measured either as carapace length or height, or as some mathematically shape-independent estimate, such as the centroid size or the outline area. In fact, methods of instargrouping based on changes in size along ontogenetic growth can also be applied to samples of living ostracods given that instar recognition based on the morphology of soft parts requires a good level of expertise and is quite time-consuming. Having size measurements, the study of growth and allometry can be properly tackled. Growth in ostracods, as in other arthropods, is a stepwise process which results from moulting. Already at the beginning of 20th century, Fowler (1909) noted that the halocyprid ostracods seemed to grow following the same principle that Brooks (1886) described for the ontogeny of Coronis (Malacostraca, Stomatopoda) [“the length of the larvae increases uniformly at each moult by one-fourth of its length before the moult”] and suggested to call it Brooks’ Law. Skogsberg (1920) and Rudjakov (1962) provide additional examples for marine ostracods and conclude that, although useful for instar recognition, the growth-factor is far from constant and is strongly influenced by factors such as taxonomic identity, sex and environmental conditions during ontogeny. It is important to remark that those authors did not deny the existence of some ontogenetic pattern, but challenged the notion of a unique growth factor valid for all ostracod species. Other morphometric rules can be related to Brooks’ Law. Przibram’s rule (Przibram & Megušar 1912, Przibram 1931) gives a theoretical progression factor of 1.26 (quite similar to the 1.25 factor in Brooks’ Law) and suggests that the number of body cells, and hence body’s volume and weight, is normally doubled at each moult. Dyar’s rule (Dyar 1890), which was originally developed to estimate the number of instars in lepidopteran larvae, also assumes a geometric progression of size measured along ontogeny (constant growth ratios between successive instars). A mathematical model which describes such kind of
geometric progression is y=a·bx, where y is a linear measure of size (e.g. length), x is the instar number, and a and b are constants, the latter corresponding to the growth factor. Whereas Brooks’ Law and Przibram’s rule predict specific values of the progression coefficient b (1.25 and 1.26, respectively), Dyar’s rule does not. We illustrate here the morphometric approach to the study of ostracod ontogeny with data obtained from deep-lake core sediments within the framework of ‘DecLakes’, an ESF project aimed to the reconstruction of the climate in Europe during the last 15,000 years. Developmental trajectories, i.e. patterns of valve size and shape changes during the sequence of postembryonic growth stages, of three ostracod species retrieved from Quaternary sediments at three different localities are built up and compared.
Methods Ostracod samples Long sediment cores were obtained with a piston corer (UWITEC, Mondsee) from three deep lakes in Europe: Mondsee (Austria); Hańcza (Poland) and Iseo (Italy). In Mondsee, a second site in the littoral (3-6 m deep) (cf. locations in Danielopol 1990) was sampled additionally. Lake Hańcza is a deep lake (zmax=108 m) from where a bore sediment core 8 m long was extracted (54° 16.2’N; 22° 49.1’E; Sept. 2005) at a depth of 80 m. A long core (15 m) was sampled from Mondsee, a pre-alpine lake in Upper Austria, in front of the locality of Scharfling at 62 m deep (47° 48.4’N, 13° 24.1’E, June 2005). Lake Iseo was sampled twice (October 2005 and May 2006) to obtain a composite core 24.5m long from a site 101m depth (45º 43.1’N; 10º 06.0’E). After extraction, sediment cores were sliced in 0.5-1.0 cm thin layers that were subsequently dried at 60ºC during 24 hours and weighted. Organic matter in the samples was oxidized with hydrogen peroxide (H2O/H2O2‡ 2/1 v/v) and the ostracod valves sorted, identified and counted. Three species were selected for this study according to their abundance in all three lakes: Candona candida (O.F. Müller, 1776) [from deep cores of both Iseo and Hańcza and from the littoral of Mondsee]; Candona neglecta Sars, 1887 [from cores in all three lakes] and Cytherissa lacustris (Sars, 1863) [from Iseo and Mondsee core samples]. Indeed, C. neglecta from Iseo must be labelled more precisely as C. cf. neglecta because it does not fully match with the standard typology of the true C. neglecta larval stages. All unbroken valves of the selected species were photographed for morphometric analysis under a transmitted light microscope using a data acquisition system Eclipse E-200 (for Hańcza and Mondsee) and a Nikon Coolpix 4500 (for Iseo). In order to keep sources of variability at a minimum, individual left-right valve asymmetry was avoided by only including left valves in the analysis. Similarly, and because of the remarkable sexual dimorphism in candonids, adult male valves were removed. Notice that the time dimension associated to the samples, which span the whole Holocene and part of the Pleistocene, has not been considered and that the analyses focus on comparisons between sites, species and ontogenetic stages only.
Developmental trajectories in geographically separated populations of non-marine ostracods: morphometric applications …
Morphometric analysis Our stress is on illustrating methods for the description and comparison of ostracod ontogeny, here described as the trajectory of the ostracod developmental events through the mathematical hyperspace defined by size and shape (Gould 1977, Alberch et al. 1979, Schweitzer & Lohmann 1990). There are many methods proposed for the morphometric analysis of biological objects but we shall here restrict ourselves to the application of methods for outline data. The choice is not arbitrary but imposed by the unornamented and smooth structure of most non-marine ostracod carapaces which prevent us from using techniques based on the analysis of configurations of landmarks (Bookstein 1991, Reyment et al. 1988, Hunt 2007). Only a brief summary of the procedures applied for outlines analysis is provided here; a full account of these methods as applied to ostracods can be found elsewhere (Danielopol et al 2002, Baltanás et al 2003, and references therein). Starting from photographs of single ostracod valves, outlines are digitized using the tpsDig software (Rohlf 2001). A mathematical function is then fitted to these outlines, which are but a list of x,y-coordinates, so that the whole shape can be described in terms of a series of numerical descriptors. The methods we apply here, elliptic Fourier analysis (EFA) and B-splines analysis, use different functions to fit the original outline but they all work under the same rules: the original shape can be reconstructed at any time from the estimated shape functions (Fourier coefficients and control points, respectively); similar outlines yield similar function coefficients; and shape functions can be normalized for size (as well as for rotations and starting point). Normalizing for size means that shape functions are mathematically adjusted to be invariant to size of the outline trace (Rohlf & Archie 1984), a highly advantageous property if we are to compare shapes which differ in size, like when comparing ontogenetic instars. Another interesting property of shape functions is the possibility to compute mean-shapes, i.e. shapes which result from averaging a number of actual shapes and which are intended to represent the characteristic shape of a group of biological objects. As some instars use to be represented by a large number of specimens whereas others only include a few, mean shapes are also helpful to avoid bias in the analysis due to unbalanced sample size (Foote 1995). Once obtained, normalized shape functions can be subject to different multivariate analysis methods, either to construct statistically orthogonal sets of variables that account for the majority of the variance in a few dimensions (Principal Component Analysis) or that best distinguish between a priori defined groups (Discriminant Function Analysis), or to map similarities among shapes based on Euclidean distances (Multidimensional Scaling or Cluster analysis). Those procedures aim to uncover the structure underlying the data and to construct an empirical morphospace revealing relationships of (shape) similarity among the objects analysed (McGhee 1999).
Software There is a high quantity of computer programs developed to perform geometric morphometric analysis (including methods based on configurations of landmarks and on outlines), that
185
a comprehensive list is out of the scope of this paper. Instead, we recommend a visit to the morphometric Web page at Stony Brook (http://life.bio.sunysb.edu/morph) where information on methods, download of software and links to related sites are available. Elliptic Fourier analysis and related procedures carried out in this paper were performed using software developed by one of the authors (A.B.) and expected to be released as freeware in the near future. The same analyses, however, can be performed using software available in the above mentioned web site. B-splines analysis, nevertheless, deserves a special mention as this procedure is not commonly implemented in available morphometric software. Here we make extensive use of Morphomatica v 1.6 (Brauneis et al 2006), a program running under Microsoft Windows (98, NT 4.0, 2000, XP) that uses the B-spline algorithm specifically adapted to ostracod outlines. Further information on the method can be found in Baltanás et al (2003), Iepure et al. (2007), Neubauer (2007) and Minati et al. (in press). The program can be downloaded (freeware) at http://palstrat.uni-graz.at/morphomatica/morphomatica_e.htm. The multivariate methods here used for the analysis of shape functions (PCA and MDS) are implemented in most statistical packages (e.g. SPSS, STATISTICA) but we strongly recommend the use of PRIMER 6 (Clarke & Gorley 2006) because of its user-friendly interface and its biologically oriented set of methods.
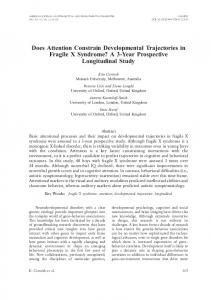
Results A total of 1372 left valves were used for the analysis (Table 1). Assignment of specimens to their corresponding instar-group was done based on visual inspection of clusters of size (length vs. height plots). This procedure is easily achieved when the total number of valves is small because they usually plot in discrete groups with clear gaps between them. However, when many valves are considered at once, overlaps between successive instar groups make the task more problematic. This is the case of the sample available from Iseo core (see Table 1). In this case, size-frequency ostracod distributions were fitted with a mixture model (Text-fig. 1, Hunt & Chapman 2001) with two aims: (1) to obtain model parameters which properly describe the average valve size and variability attached to each instar-group; and (2) to probabilistically assign any new specimen to its instar-group based on its valve size. It is obvious that such an approach is also helpful when dealing with aspects related to population ecology as the relative abundances of valves belonging to different growth stages are also estimated. Ontogenetic stages of Candona candida are extremely similar in size (measured as length) in all three lakes; with no sigTab. 1. Number of valves of each species that examined for morpho metric analysis. Iseo
Mondsee
Hańcza
C. candida
172
79
77
C. neglecta
595
174
159
C. lacustris
78
38
186
Developmental trajectories in geographically separated populations of non-marine ostracods: morphometric applications …
Tab. 2. Growth factors estimated from own data and from data in the literature. Non-marine species
Site
Growth Factor
Source of data
1.21
Kesling (in Ranta 1979)
Lake Pääjärvi (Finland)
1.21
Ranta (1979)
1.22
Kesling (1951a)
Darwinula stevensoni Darwinula stevensoni Cypridopsis vidua Cyprideis torosa
Brackish pond (Belgium)
1.28
Heip (1976)
Cyprideis torosa
Salt marsh (Spain)
1.26
Mezquita et al (2000)
Cyprinotus sp.
Pool (Yoichi, Japan)
1.27
Kurata (1962)
Mytilocypris henricae
Lake Bathurst (Australia)
1.37
Martens (1983)
Mytilocypris henricae
Lab cultures (Australia)
1.32-1.36
Martens (1983)
Candelacypris aragonica
Temporary lakes (Spain)
1.24
Marín (1984)
Heterocypris salina
Temporary lakes (Spain)
1.28
Marín (1984)
Cytherissa lacustris
Mondsee (Austria)
1.26
Geiger (1990)
Eucypris virens
Lab cultures (UK)
1.22-1.27
Hounsome (1975)
“
Pond (UK)
1.26
Smith & Martens(2000)
“
Lab cultures (Spain)
1.31
Baltanás et al (2000)
Candona candida
Lake Hańcza (Poland)
1.26
This study
“
Mondsee (Austria)
1.23
“
“
Iseo (Italy)
1.27
“
Candona neglecta
Lake Hańcza (Poland)
1.26
“
“
Mondsee (Austria)
1.26
“
Candona cf. neglecta
Iseo (Italy)
1.27
“
Cytherissa lacustris
Mondsee (Austria)
1.27
“
Cytherissa lacustris
Iseo (Italy)
1.26
“
Text-fig. 1. Size-frequency distribution of ostracod valves retrieved from lake Iseo (Italy) with a seven-group (Ad. to A-6) and an eight-group model (Ad. to A-7) fit to the data. Notice the significant overlap in size between early larval instars of both species. Models were fitted with Mixture Model Analysis (Hunt 2001, v. 1.31)
Developmental trajectories in geographically separated populations of non-marine ostracods: morphometric applications …
nificant valve size differences except for instar groups A-2 and A-5 in Mondsee (Tukey HSD test, p