ORIGINAL RESEARCH published: 13 May 2016 doi: 10.3389/fpsyg.2016.00716
Developmental Trajectories in Primary Schoolchildren Using n-Back Task Mónica López-Vicente 1, 2, 3, 4*, Joan Forns 1, 2, 3, 5 , Elisabet Suades-González 1, 2, 6 , Mikel Esnaola 1, 2, 3 , Raquel García-Esteban 1, 2, 3 , Mar Álvarez-Pedrerol 1, 2, 3 , Jordi Júlvez 1, 2, 3, 4, 7 , Miguel Burgaleta 8 , Núria Sebastián-Gallés 8 and Jordi Sunyer 1, 2, 3, 4 ISGlobal, Centre for Research in Environmental Epidemiology, Barcelona, Spain, 2 Department of Experimental and Health Sciences, Universitat Pompeu Fabra, Barcelona, Spain, 3 CIBER Epidemiología y Salud Pública, Barcelona, Spain, 4 Hospital del Mar Medical Research Institute, Barcelona, Spain, 5 Department of Genes and Environment, Division of Epidemiology, Norwegian Institute of Public Health, Oslo, Norway, 6 Learning Disabilities Unit (UTAE), Neuropediatrics Department, Hospital Sant Joan de Déu, Universitat de Barcelona, Barcelona, Spain, 7 Environmental Health Department, Harvard T.H. Chan School of Public Health, Boston, MA, USA, 8 Center for Brain and Cognition, Department of Technology, Universitat Pompeu Fabra, Barcelona, Spain 1
Edited by: Yusuke Moriguchi, Kyoto University, Japan Reviewed by: Andrea Berger, Ben-Gurion University of the Negev, Israel Santiago Pelegrina, University of Jaén, Spain *Correspondence: Mónica López-Vicente
[email protected] Specialty section: This article was submitted to Developmental Psychology, a section of the journal Frontiers in Psychology Received: 26 January 2016 Accepted: 27 April 2016 Published: 13 May 2016 Citation: López-Vicente M, Forns J, Suades-González E, Esnaola M, García-Esteban R, Álvarez-Pedrerol M, Júlvez J, Burgaleta M, Sebastián-Gallés N and Sunyer J (2016) Developmental Trajectories in Primary Schoolchildren Using n-Back Task. Front. Psychol. 7:716. doi: 10.3389/fpsyg.2016.00716
Frontiers in Psychology | www.frontiersin.org
Background: Neuropsychological instruments to assess cognitive trajectories during childhood in epidemiological studies are needed. This would improve neurodevelopment characterization in order to identify its potential determinants. We aimed to study whether repeated measures of n-back, a working memory task, detect developmental trajectories in schoolchildren during a 1-year follow-up. Methods: We administered the n-back task to 2897 healthy children aged 7–11 years old from 39 schools in Barcelona (Spain). The task consisted of 2 levels of complexity or loads (2- and 3-back) and 2 different stimuli (numbers and words). Participants performed the task four times from January 2012 to March 2013. To study the trajectories during the follow-up, we performed linear mixed-effects models including school, individual and age as random effects. Results: We observed improvements related to age in n-back outcomes d′ , HRT and accuracy, as well as reduced cognitive growth at older ages in d′ and HRT. Greater improvements in performance were observed at younger ages, in 2-back, in verbal rather than numerical stimuli and in girls compared to boys. Boys responded faster at baseline, while girls showed increased growth in 2-back numbers. Children with ADHD (Attention Deficit and Hyperactivity Disorder) symptoms (15% of boys and 6% of girls) had a lower working memory at baseline, but they showed similar cognitive growth trajectories in numbers variants of the task, as compared to children without ADHD symptoms. However, the age-related improvement in response speed was not observed in children with ADHD symptoms. Conclusions: Changes in n-back outcomes reflected developmental trajectories in 1-year follow-up. The present results suggest that the repeated administration of this task can be used to study the factors that may alter the cognitive development during childhood. Keywords: n-back, working memory, neurodevelopment, schoolchildren, follow-up, population study, longitudinal study
1
May 2016 | Volume 7 | Article 716
López-Vicente et al.
n-Back Trajectories in Children
INTRODUCTION
Bartok, 1998; Grön et al., 2000) and female advantage in verbal tasks (Dorfberger et al., 2009). Regarding ADHD, longitudinal neuroimaging data indicate that children with ADHD follow a trajectory of cortical development that is delayed by 2– 3 years relative to their typically-developing peers (Shaw et al., 2007). The executive functions are especially affected in these children (Sergeant et al., 2002; Semrud-Clikeman et al., 2008). The simplicity, objectivity, efficiency and validity of n-back task allow the investigation of developmental trajectories in large-scale studies with the final aim of being applied in epidemiological research. Although the age-related patterns of n-back task performance in children and adolescents have been already studied with a cross-sectional design (Pelegrina et al., 2015), to our knowledge, there are no previous attempts to study the age-related trajectories of n-back during childhood with a longitudinal approach. Here we studied a sizeable sample of children (N = 2897) who were assessed four times during a period of 1 year with the n-back task. This design allowed us not only to study individual trajectories, but also to explore practice effects of this task, since we were able to compare the performance of children at the same age with and without practice. This study would represent an improvement due to a better characterization of cognitive development in order to identify its determinants at a population level. Thus, we aimed to study whether repeated administrations of n-back task detect developmental trajectories in schoolchildren during a 1-year follow-up. We explored the potential modulation that some key factors may exert over the developmental trajectories, namely, age, sex, and ADHD symptoms. Based on the literature, we expect that: (1) children will increase n-back scores and they will decrease latencies during the study period; (2) the oldest children will show less progression than the younger ones; (3) girls will show an advantage in verbal tasks and (4) children with ADHD symptoms will show a delayed developmental pattern.
Neuropsychological instruments are widely used in epidemiological studies to measure the impact of environmental factors on neurodevelopment. Most of the studies assess the neuropsychological status in one or several time points. However, individual trajectories of cognitive development have been rarely studied in epidemiological studies on neurodevelopment as it is usually performed in other health outcomes, such as lung function (Lødrup Carlsen et al., 2014), growth (Giles et al., 2015), and weight (Carling et al., 2015). The study of cognitive trajectories, based on several measures in short periods of time, would improve neurodevelopment characterization as a process in order to detect alterations in the growth pattern caused by social, environmental and other factors (Lei et al., 2015). The major criticism is the learning effect due to repeated administration of the same test in short periods (Dikmen et al., 1999). Among the cognitive functions, working memory (WM) is highly related to learning ability and intelligence (Gathercole et al., 2003). WM emerges in early childhood and develops until adulthood (Cowan et al., 1999; Gathercole et al., 2003; Østby et al., 2011; Ullman et al., 2014). Tamnes et al. (2013) recently reported an annual increase in WM task scores of 5.4% during childhood, but this rate progressively diminishes during early (2.4%) and late adolescence (0.3%, although not statistically significant). N-back task is a widely used computerized test to measure WM (Nelson et al., 2000; Vuontela et al., 2003). Compared with other standard WM tasks, such as Reading Span Test (Daneman and Carpenter, 1980) or the operation span task (Turner and Engle, 1989), the responses that the participants must provide in n-back task are far simpler. In these traditional WM measures the subject has to perform a cognitive task while certain information has to be recalled later. In n-back task, individuals are not asked to recall any information but to recognize it. The n-back is a continuous recognition task in which participants must decide whether a stimulus was previously presented in certain conditions. The computerized format of this task provides increased objectivity that allows the use of highly precise outcomes, as well as efficiency, which allows to collect a big amount of data in a relatively short time. This task has been demonstrated to be a valid instrument in cross-sectional epidemiological studies (Forns et al., 2014). Agerelated patterns of n-back task in children and adolescents have been also studied in a recent cross-sectional study (Pelegrina et al., 2015). In addition, this task, embedded in a wider neuropsychological battery named “Cogstate,” has been validated for measuring cognitive change in children through repeated administrations, since only weak measurement error or practice effect was observed (Mollica et al., 2005). The developmental trajectories of n-back task can be modulated by gender and ADHD (Attention Deficit and Hyperactivity Disorder) symptoms. Although, previous literature indicated that boys and girls develop executive processes at similar rates (Becker et al., 1987; Welsh et al., 1991), other research have found male advantage in developmental trajectories for navigation and spatial tasks (Krikorian and
Frontiers in Psychology | www.frontiersin.org
MATERIALS AND METHODS Participants This study is part of the BREATHE (BRain dEvelopment and Air polluTion ultrafine particles in scHool childrEn) project, which aims to analyze the association between air pollution and cognitive development of schoolchildren. The BREATHE project was conducted from January 2012 to March 2013 in 36 schools of Barcelona, and 3 in Sant Cugat del Vallès, a smaller city near Barcelona (Catalonia, Spain). All the families of children attending these 39 schools in the 2nd, 3rd, and 4th primary grades (aged from 7 to 10 years [mean = 8.55, SD = 0.88]) were invited to participate via mail and/or project presentations in the schools. The total number of participants was 2904 (59%), but 7 of them were excluded from the analysis due to mental, motor or sensory impairment reported by the school. Fifty percent of the participants were males and 55% of mothers had a university degree. All parents and legal guardians signed the informed consent approved by the Ethical Committee of the IMIM-Parc Salut Mar.
2
May 2016 | Volume 7 | Article 716
López-Vicente et al.
n-Back Trajectories in Children
Instruments
(“woo hoo!”) and a smiling face appeared at the top left of the screen. Direct measures (hits, correct rejections, false alarms, and misses) and hit reaction time (HRT) were obtained for each trial. We calculated the overall accuracy including both hits and correct rejections, and d prime (d′ ) for each block separately. This outcome is derived from signal detection theory and allows the distinction of signal and noise. Measures of d′ were computed as follows: d′ = z(hit rate) − z(false alarm rate). A higher d′ indicated better detection, and thus, a more accurate performance (Deserno et al., 2012). The task was created using the psychology experiment computer program E-Prime version 2.0 (Psychology Software Tools Inc.), and was performed on laptops with a standard 15′′ screen.
Neuropsychological Testing Children were evaluated in groups of 10–20 every 3 months over four repeated sessions using the computerized n-back task. The duration of the sessions was 25 min. We followed a strict protocol in order to minimize measurement error. Firstly, the task was administered in a quiet and spacious room in the school. Secondly, children wore headphones to avoid noise disturbances. Thirdly, there was a trained examiner for every 3–4 children. Fourthly, sufficient distance between children reduced interaction among them. Fifthly, the test instructions were always explained following the same structure and by the same examiner. Finally, some variables such as day of the week, season, noise, weather, time of the day, quality of the session and incidences during the session were collected. These variables were included in the models in order to test their influence in the main results, but no significant effects were found (data not shown). Session date and child’s grade (2nd, 3rd, and 4th primary grades) were also recorded in the sessions. In the n-back task the subjects were required to monitor a series of stimuli presented in the center of the laptop’s screen and they had to respond whenever a given stimulus is the same as the one presented n trials previously (1-, 2-, and 3-back). These different conditions are known as loads and in the highest cognitive load (i.e., 3-back) the demands on WM are stronger. The stimuli used in this study were numbers and words in blackcolor font. The difficulty of the stimuli presented was adapted to the development of the children to avoid the “ceiling effect” where there is concentration of most of the subjects in the maximum scores. Thus, numbers were 10 single digits for 2nd and 3rd grades (0–9), while participants in 4th grade had 10 double digits (21, 39, 47, 15, 62, 71, 83, 90, 50, and 68). The difficulty of the words was adapted for each grade. The following Catalan words were used for 2nd grade: germà (brother), avi (grandfather), ningú (nobody), braç (arm), dent (tooth), petó (kiss), cullera (spoon), abric (coat), gol (goal), and cop (hit). For 3rd grade, we used the following words: oncle (uncle), metge (doctor), cabell (hair), coll (neck), oli (oil), camisa (shirt), mirall (mirror), empenta (push), galleda (washbowl), and calaix (drawer). For 4th grade, the words were: cosí (cousin), nebot (nephew), fuster (carpenter), cella (eyebrow), colze (elbow), fruita (fruit), trena (braid), raspall (brush), ferida (wound), and llibreria (bookcase). Stimuli were presented in a fixed central location on a white background for a 1500-ms duration with a 1000-ms interstimulus interval. All participants were required to press a specific keyboard button when the target appeared in the screen. Participants completed three blocks (1-, 2-, and 3back) for each stimulus. In the 1-back level, the target was any stimulus that matched the stimulus immediately preceding it. In the 2-back level, the target was any stimulus that matched the one presented two trials previously. In the 3-back level, the target was any stimulus identical to the one presented three trials previously. Each block consisted of 25 trials. The first three trials of each block were never targets and 33% of stimuli of the following trials were targets. After each block, a short break (5–20 s) was provided to allow participants some rest. Upon completion of each target, children heard a motivational recorded sample
Frontiers in Psychology | www.frontiersin.org
Covariates Socio-demographic data including childbirth date, sex, maternal education level (primary or low, secondary and university), origin from child and parents, linguistic context and home addresses were obtained from a questionnaire completed by parents during 2012. We calculated children’s age for each session based on birth date and session date. A neighborhood socio-economic status vulnerability index (based on level of education, unemployment, and occupation at the census tract; Sunyer et al., 2015) was calculated at the home address. Teachers reported ADHD symptoms of each child using the ADHD Criteria of Diagnostic and Statistical Manual of Mental Disorders, fourth edition (ADHD-DSM-IV) list (American Psychiatric Association, 2002). ADHD-DSM–IV consists of a list of 18 symptoms categorized in two separate symptom groups. These are inattention (nine symptoms) and hyperactivity/impulsivity (nine symptoms). Each ADHD symptom is rated on a 4-point scale (0 never or rarely, 1 sometimes, 2 often, or 3 very often). We recoded the options 0 and 1 as 0 (symptom absent), and ratings of 2 and 3 as 1 (symptom present; Gomez, 2007). We used a categorical variable of ADHD clinical criteria with four categories, according to the presence of 6 or more symptoms of each subtype: (a) no ADHD; (b) ADHD-inattentive; (c) ADHDhyperactive/impulsive; and (d) ADHD-combined.
Statistical Analyses The medians of d′ , HRT and accuracy of each load (2- and 3back) and stimulus (numbers and words) were obtained at the 4 different sessions. We performed analyses of variance (ANOVA) to test differences between loads and stimuli statistically. We created the two categorical variables “memory load” and “stimulus” for these analyses. We studied the change in task performance at 4th session vs. 1st session on each age group including the interaction between session and the grade in the models. Due to the hierarchical structure of the data (children embedded within schools and repeated measures collected on a child over time) we performed multilevel mixed-effects linear regression models for each outcome to study the developmental trajectories across sessions. 1-back trials were not included in the analyses because a ceiling effect was observed. We included
3
May 2016 | Volume 7 | Article 716
López-Vicente et al.
n-Back Trajectories in Children
school, individual and age as random effects, and age (linear and quadratic terms to capture the nonlinearity in the growth trajectories, if any) as fixed effects. The quadratic model with random intercepts and random slope for each child is shown below:
TABLE 1 | Number of participants in each session by age group and sex. Age group 2nd
Ysit = (β0 + u0s + s0i(s) ) + (β1 + s1i(s) )
3rd
× agesit + (β2 + s2i(s) ) × agesit2 + εsit 4th
Where Ysit is the n-back outcome for individual i within school s at session t, t = {1,2,3,4}, us are random effects at school level, si(s) are random effects associated with the individual i within school s, and εsit are the residuals. First, random effects associated with age were tested using likelihood-ratio tests. Afterwards, we included the interaction between age and sex, and stratified models were presented if the growth pattern differed according to sex. Then, we tested interactions between age and ADHD symptoms, and the models were also stratified when the interactions were statistically significant. Fixed effects were tested using Wald tests. To visualize the shape of the growth function, we plotted the average predicted curve and two 95% confidence bands, one accounting only for the fixed effects and the other one adding the variation of the random effects. Statistical significance was set at p < 0.05 and p ≤ 0.1 for interaction. Statistical analyses were done using R (3.0.2; R Foundation for Statistical Computing) and Stata 12.1 (Stata Corporation, College Station, Texas).
S1
S2
S3
S4
Girl
503
496
474
454
Boy
502
526
501
494
Girl
453
480
465
451
Boy
510
499
498
474
Girl
373
382
368
363
Boy
355
365
350
321
2696
2748
2656
2557
2nd, second grade at session 1 (7–8 years old); 3rd, third grade at session 1 (8–9 years old); 4th, fourth grade at session 1 (9–10 years old); S1, session 1; S2, session 2; S3, session 3; S4, session 4.
TABLE 2 | Sample characteristics by age group (n = 2897).
Age at session 1 (mean, SD) Sex (% girls)
2nd grade (n = 1083)
3rd grade (n = 1036)
4th grade (n = 778)
7.6 (0.32)
8.7 (0.36)
9.7 (0.35)
49.3
48.8
51.5
MATERNAL EDUCATION (%)
RESULTS
Primary or low
14.5
10.1
10.9
Secondary
23.6
26.1
32.8
University
56.9
56.9
50.3
Missings
5.0
7.0
6.0
1st tertile
35.8
37.0
37.8
2nd tertile
31.1
31.6
28.7
3rd tertile
31.6
30.0
32.7
Missings
1.5
1.5
0.9
Spanish
82.7
83.4
85.2
Other
16.1
15.1
13.4
Missings
1.2
1.5
1.4
Bilingual (Spanish and Catalan)
12.4
13.2
11.3
Catalan
46.3
43.4
46.3
Spanish
27.6
29.1
31.5
Other language
8.8
7.4
5.0
Missings
5.0
6.9
5.9
No ADHD
89.4
87.6
86.9
ADHD-inattentive
6.0
6.0
6.4
ADHD-hyperactive/impulsive
1.4
1.5
2.4
ADHD-combined
2.5
1.6
3.1
Missings
0.7
3.3
1.2
SES Vulnerability Index (%)
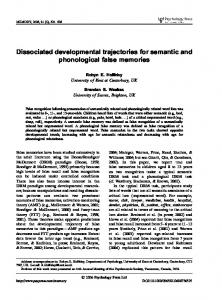
Table 1 shows the number of participants in each session by age group and sex. The characteristics of the sample by age group are reported in Table 2. The median age in the first testing session was 7.6 years old in 2nd grade, 8.7 in 3rd grade and 9.7 in 4th grade. Children had a Spanish origin in 83% of the younger children and in 85% of children in the oldest group. Maternal education level was high in half of the sample for all age groups and the majority of children use Catalan in the family context (43–46%). ADHD symptoms were more present in the oldest group (12%). Inattentive type was observed in 4% of the girls and 8% of the boys in this study. Hyperactivity symptoms were reported for 0.5% girls and 3% boys, and combined ADHD symptoms were detected in 1% and 4% of the girls and boys respectively. Comparing the loads, 2-back scores were higher than 3-back with both stimuli (p < 0.001). The scores obtained using numbers were higher compared to verbal stimuli (p < 0.001). However, in 3-back, the scores were higher using words (p < 0.001). HRT decreased by session in all stimuli and loads. Children were faster in 2-back than in 3-back (p < 0.001), and the responses were more delayed using words, mainly in 3-back (p < 0.001). Figures 1–4 show the d′ medians of each task condition by session (1–4) and age group (2nd, 3rd, and 4th grade) to compare the performance in the task with and without practice at the same ages. We observed that children in 2nd grade reached the performance level of children in 3rd and 4th grades in 2back numbers, while the two older groups performed at similar
Frontiers in Psychology | www.frontiersin.org
Sex
ORIGIN (%)
LINGUISTIC CONTEXT (%)
ADHD SUBTYPES (%)
SES, socio-economic status; ADHD, Attention Deficit and Hyperactivity Disorder.
levels across the four sessions (Figure 1). We found significant interaction coefficients between session and age group in the 3rd (Coefficient: −0.20, p = 0.006) and 4th grades (Coefficient: −0.31, p < 0.0001) compared to the 2nd grade. In 2-back words
4
May 2016 | Volume 7 | Article 716
López-Vicente et al.
n-Back Trajectories in Children
FIGURE 1 | Medians of d′ 2-back numbers by age group (grades) at different sessions.
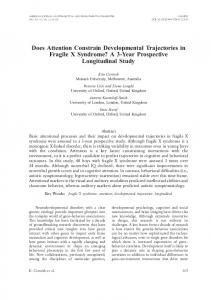
FIGURE 3 | Medians of d′ 2-back words by age group (grades) at different sessions.
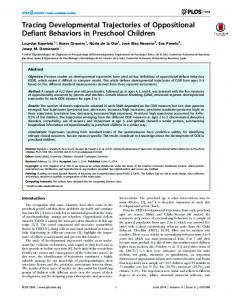
FIGURE 2 | Medians of d′ 3-back numbers by age group (grades) at different sessions.
FIGURE 4 | Medians of d′ 3-back words by age group (grades) at different sessions.
the 3 age groups improved in a similar rate across the four visits, reaching the levels of the next age group in the 4th session. In 3-back conditions the levels in the 4th session did not reached the levels of the older groups in the 1st session. Children from 2nd and 3rd grades improved their performance between the 1st and 4th sessions, in contrast with the oldest children (4th grade). Significant interaction coefficients between session and grade were found in 3-back numbers (Coefficient: −0.11, p = 0.095) and words (Coefficient: −0.22, p = 0.001) in the 4th grade, being 2nd grade the reference group. The medians of baseline scores by sex and ADHD symptoms are reported in Table 3. Boys performed better than girls in 3-back number trials (p < 0.05), and they were faster in all tasks. The groups of children with inattention and combined ADHD symptoms obtained the lowest d′ and accuracy scores (p < 0.0001) compared to children without ADHD symptoms. Children with inattention symptoms were also slower in 2back numbers (p < 0.05), but they responded faster than
Frontiers in Psychology | www.frontiersin.org
children without ADHD symptoms in 3-back words (p < 0.05). Children with hyperactivity symptoms responded slower in 3back numbers (p < 0.05). In the multilevel mixed-effects linear regression models strong age associations were found for all d′ outcomes. We observed quadratic curves with different degrees in all outcomes as well, indicating reduced cognitive growth at older ages (Table 4). Girls had an increased cognitive growth across the 1-year follow-up in comparison to boys, except for 2-back number trials, which trajectories were similar between boys and girls. Children with and without ADHD symptoms had the same growth pattern, except in 2-back word trials, in which children with combined ADHD symptoms had a more pronounced quadratic curve. That is, the age-related increases in performance diminished with age in both groups of children, however these reductions became more pronounced in children with ADHD symptoms. The inclusion of maternal education as a confounder did not change the results substantially.
5
May 2016 | Volume 7 | Article 716
López-Vicente et al.
n-Back Trajectories in Children
TABLE 3 | Medians (p25, p75) of d′ , hit reaction time (HRT, ms) and accuracy at baseline by sex and ADHD symptoms. Outcome
Groups
2-back Numbers
d′
Numbers
Words
1.98 (1.29, 3.27)
1.96 (1.29, 3.24)
1.12 (0.59, 1.90)
1.29 (0.64, 1.90)
Boys
2.21 (1.31, 3.92)
1.98 (1.25, 3.49)
1.28 (0.51, 1.71)*
1.29 (0.60, 1.96)
ADHD-inattentive ADHD-hyperactive/impulsive ADHD-combined
Accuracy
Words
Girls No ADHD
HRT
3-back
2.21 (1.39, 3.92)
1.98 (1.29, 3.43)
1.12 (0.59, 1.88)
1.29 (0.72, 1.90)
1.53 (0.78, 2.34)***
1.43 (0.60, 2.41)***
0.80 (0.19, 1.53)***
1.03 (0.32, 1.53)***
2.21 (1.62, 3.92)
2.38 (1.62, 3.92)
1.09 (0.78, 1.71)
1.52 (0.97, 2.12)
1.74 (0.99, 2.80)***
1.89 (0.99, 2.63)***
1.03 (0.13, 1.29)***
1.03 (0.42, 2.12)***
Girls
766 (621, 938)
876 (732, 1022)
824 (659, 1006)
889 (741, 1042)
Boys
729 (570, 882)***
829 (696, 979)***
799 (620, 960)*
868 (709, 1007)*
No ADHD
746 (598, 908)
853 (713, 1002)
808 (641, 979)
882 (730, 1024)
ADHD-inattentive
752 (612, 929)*
858 (669, 1024)
753 (639, 976)
853 (669, 994)*
ADHD-hyperactive/impulsive
727 (598, 874)
835 (706, 927)
828 (598, 932)*
872 (745, 1000)
ADHD-combined
793 (640, 968)
855 (697, 988)
811 (637, 946)
836 (698, 993)
Girls
88 (84, 96)
88 (80, 95)
80 (72, 88)
80 (72, 88)
Boys
92 (84, 100)
88 (80, 96)
80 (72, 88)
80 (71, 88)
No ADHD
92 (84, 100)
88 (80, 96)
80 (75, 88)
80 (72, 88)
ADHD-inattentive
84 (76, 92)***
80 (68, 92)***
76 (68, 84)***
76 (64, 84)***
ADHD-hyperactive/impulsive
89 (84, 100)
90 (80, 100)
80 (76, 88)
80 (72, 88)
ADHD-combined
84 (76, 94)***
84 (68, 92)***
76 (67, 83)***
72 (60, 88)***
ADHD, Attention Deficit and Hyperactivity Disorder. Wilcoxon rank-sum test was applied to compare boys and girls’ performance and pairwise tests, adjusted for multiple comparisons using Tukey’s honestly significant difference, to compare task performance between no ADHD (reference) and ADHD subtypes. ***p < 0.0001; *p < 0.05.
Regarding HRT, the same pattern as d′ was observed, children became faster with age, as well as the quadratic curves indicated reduced growth at older ages. We observed interactions between age and sex in the association with 2-back numbers, being the age effect more pronounced in girls. We also observed interactions between age and ADHD symptoms in the association with the other conditions. The stratified analyses showed that while the associations between age and the outcomes were strong in children with no ADHD symptoms, this association was not observed in children with ADHD symptoms. We also observed interactions in the accuracy outcomes. Sex interacted with age in the association with 3-back numbers and words, while no age effect was found in girls using numbers stimuli, a negative effect of age was observed in boys. Contrarily, a positive age effect was found in girls using words, while no effect was found in boys. ADHD symptoms also interacted with age in the association with 2-back numbers and words and 3back words. While the accuracy of 2-back numbers increased more with age in children with ADHD inattention symptoms, no age effect was observed in children with ADHD combined symptoms in 2- and 3-back words. Moreover, 3-back words in children without ADHD showed an increased cognitive growth pattern at older ages. Figures 5–8 represent changes in d′ observed during 1 year period in 2- and 3-back performance using numbers and words stimuli. The curves showed a rapid improvement at younger ages and they stabilized at the end of the age range studied. Significant
Frontiers in Psychology | www.frontiersin.org
interactions between sex and age were found in 2-back words and 3-back numbers and words. Girls obtained lower scores at younger ages, but they showed a further improvement than boys across the 1-year period, resulting in higher scores at older ages and steeper slopes.
DISCUSSION The current study has shown, for the first time, that n-back task outcomes were able to detect developmental trajectories in children from 7 to 11 years old from the general population in a period of 1 year. Specifically, we observed a rapid improvement in d′ score of n-back at younger ages, and more pronounced in 2-back than 3-back. This trend decreased at older ages. The cognitive growth measured with d′ was more pronounced in girls as compared to boys and similar in children with and without ADHD symptoms using numbers, although the baseline performance in children with ADHD symptoms was lower. Children without ADHD symptoms became faster in their responses with age, while no improvement were observed in children with symptoms. Boys responded faster at baseline, while girls showed increased growth in the HRT of 2-back numbers. The accuracy of the tasks increased with age, being this trend stable across ages and even more pronounced at older ages in 3-back words and in girls. This pattern was not observed in children with ADHD symptoms. In addition, we did not observe
6
May 2016 | Volume 7 | Article 716
López-Vicente et al.
n-Back Trajectories in Children
TABLE 4 | Age-associated changes (coefficient, 95% CI)† in the n-back outcomes during the 1-year follow-up. Age
p
Age2
p
0.31 (0.26, 0.35)