Available online at www.sciencedirect.com
ScienceDirect IERI Procedia 10 (2014) 76 – 84
2014 International Conference on Future Information Engineering
Diameter Error Prediction Using Fuzzy Logic for Cast Nylon 6 Turning Operation Bandit Suksawat* Department of Teacher Tranining in Mechanical Engineering, Faculty of Technical Education King Mongkut’s University of Technology North Bangkok, Bangkok, 10800,THAILAND
Abstract A prediction model using fuzzy logic system for cast nylon 6 turning work piece diameter error forecasting was developed. The cutting parameters consisting of feed rate, depth of cut and cutting speed were determined as input variable of 75 fuzzy rules of input membership function. The diameter error values from 11 levels of fuzzy rules of output membership function were arranged as prediction outputs. Turning was carried out at 3 levels of turning speed and 5 levels feed rate then depths of cut were accomplished. Both experimental and predicted work piece diameter errors were used for validation. After that factors affecting on diameter error, precision and accuracy of the prediction values were statistically analyzed. The experimental results revealed that length of work piece and cutting speed did not effect on diameter error. However, depth of cut and feed rate affected on diameter error with total causal effect values at 0.6553 and 0.3085, respectively. Prediction of diameter error by the developed fuzzy system has an average absolute error at 0.535 Pm and R2 at 0.988 compared with the experimental data. The precision of prediction was not significantly different from the experimental data at 95% of confidence interval. Therefore, the developed fuzzy system can predict diameter error in turning operation with high accuracy and precision. © 2014 The Authors. Published by Elsevier B.V. This is an open access article under the CC BY-NC-ND license © 2014 The Authors. Published by Elsevier B.V. (http://creativecommons.org/licenses/by-nc-nd/3.0/). Selection and peer review under responsibility of Information Engineering Research Institute Selection and peer review under responsibility of Information Engineering Research Institute Keywords: Cast Nylon 6; Diameter Error; Fuzzy Logic; Prediction
* Corresponding author. Tel.: +662-555-2000; fax: +662-5878261. E-mail address:
[email protected]
2212-6678 © 2014 The Authors. Published by Elsevier B.V. This is an open access article under the CC BY-NC-ND license (http://creativecommons.org/licenses/by-nc-nd/3.0/). Selection and peer review under responsibility of Information Engineering Research Institute doi:10.1016/j.ieri.2014.09.094
Bandit Suksawat / IERI Procedia 10 (2014) 76 – 84
1. Introduction Generally, quality of the machined part is evaluated based on dimensional accuracy and quality of finished surface. The dimensional accuracy are considered by measurement of the size (length, height, width and diameter). The geometric properties such as straightness, angularity, cylindricity and circularity are used for evaluation of dimensional accuracy. The dimensional error, a difference between actual size dimension and designed size dimension is used for validation of the level of the size dimension accuracy. Furthermore, various errors during machining operation may effect to dimensional error of the machined workpiece for example machine tool movement errors, machine tool structural error and cutting force-induced error (Xiaoli L. and Du R., 2002). The machine tool movement errors cause by the dynamics of the driving system, clearance of power transmission system and wear of machine tool guide way. The machine tool structural errors result in thermal expansion errors and geometric errors. Whereas, the cutting force-induced errors affect to machine tool deflection, cutter deflection, workpiece deflection, thermal expansion, tool wear and chatter. Machinability also effects to dimensional error of a workpiece which is machined on the lathe (Liu Z.Q., 2000). The variables affects to machinability are machine tool variables, cutting tool variables, cutting condition variable, workpiece material variable and extra variables (LEE M. and LEE C., 2011). The machine tool variables consist of accuracy of machine, machine power, and machine structure stiffness, etc. The cutting tool variables are considered in tool material, tool shape, contact characteristics in tool and workpieces, etc. The cutting condition variables are cutting speed, feed rate and depth of cut. The work material variables are chemical composition, shape and size of workpiece, strength, hardness, etc. The extra variables are cooling lubrication and thermal effect, etc. Previously, geometric and dimensional error are concerned based on the deformation and other mechanical properties of a workpiece (Liu Z.Q., 2000) (Eyüp S.T. and C Ç., 2005) (LEE M. and LEE C., 2011). Whereas, the deformation of a workpiece depends on material properties. The cast nylon 6 polymer are high modulus, thermal and fatigue resistance and it is used as a main material for several mechanical parts such as large rollers, gears, bushings and bearings. Prediction of the machined diameter error is required to be made in advance in order to achieve high accuracy of workpiece dimension. However, the prediction diameter error of cast nylon 6 cannot easily predict on the shop floor. Therefore, a new prediction method based on cutting conditions is necessary for machining operation. Thus, this work presents a prediction model for a diameter error in cast nylon 6 turning operation using fuzzy system. 2. Diameter Error Model 2.1. Diameter Error Definition In this paper, the diameter error was defined as deviations of the actual diameter on a circular contour along the cylindrical turning operation. The simple inspection method used the micrometer to verify the diameter deviations of the cylindrical workpieces. These deviations are caused by various error sources such as geometric, machine motion, thermal, cutting force, cutting tool material, and tool life. 2.2. Dimensional Error Model and Analysis in Machining Lui Z.Q. (2000) applied the finite different method for calculating the deformations of multi-diameter workpieces during turning by using the cantilever beam and two fixed supports mathematical analysis. Based on the results of calculation, a modified correction method to compensate for the deflections is presented for turning operations.
77
78
Bandit Suksawat / IERI Procedia 10 (2014) 76 – 84
Xiaoli L. and Du R. (2002) studied the work piece error in combination terms of geometric error of the machine tool, the thermal induced error of the machine tool and the cutting force-induced error. The results showed that the geometric error of the machine tool was independent on machine tool operation. The thermal error of the machine tool was dependent on cutting speed, feed, machining time and environmental temperature. The cutting-induced error participated a dominant role and was estimated based on the cutting conditions (speed, feed and depth of cut) and the motor currents (main spindle motor current and feed spindle motor current) using a radius basis function (RBF) artificial neural network (ANN). Eyüp S.T. and C Ç. (2005) has been considered the diametral error mathematically model of cantilever bar turning workpiece. This model expressed by using different of actual diameter and desired diameter. The error increased along the length of workpieces and reached the maximum value at the cantilever end. The computer-based estimation diametral errors of cantilever bars by using artificial neural network was also proposed by Eyüp S.T. and C Ç. (20011). This model performed prediction performance with good accuracy. LEE M. and LEE C. (2011) introduced two steps for analysis of the geometric error in A16061 steel turning operation. The first step concerned cutting force and cutting heat on various cutting conditions. The second step used finite element analysis to simulate the deformation of turning workpieces. The comparison between simulation and experimental results showed the similar tendencies of workpieces deformation. The geometric error in the lathe, the error caused by cutting force and thermal deformation was about 15%, 10% and 75%, respectively. 3. Fuzzy System Design For some applications, performance of fuzzy systems is often better than traditional systems because of their capability to deal with non-linearity and uncertainty (Bandit S., 2011). Whereas traditional systems make precise decisions at every stage, fuzzy systems retain the information about uncertainty as long as possible and only draw a crisp decision at the last stage. Another advantage of fuzzy logic is linguistic rules which would not only make designing tools more intuitive, but also provide better understanding and appreciation of the characteristics of each design. The structure of fuzzy logic system consists of three conceptual components (S.N. Sivanandam and et.al., 2007) : 1) Fuzification: formation of membership functions 2) Selection of proper shape and definition of expert rules 3) Selection of proper defuzzification method The fuzzifier uses membership functions to fuzzify the input and output values. The inference engine is used for fuzzy reasoning on fuzzy rules to generate a fuzzy value. The defuzzifier converts the fuzzy in to crisp output. In this paper, cutting speed, feed and depth of cut were determined as input parameters of a revolution speed of turning machine. Diameter deviation was decided as an output response in the system. In fuzzy system, membership function was used. Membership functions characterize the fuzziness in a fuzzy set whether the elements in the set were discrete or continuous in graphical form for eventual use in the mathematical formalism of fuzzy set theory. The input and output variables are fuzzified and represented by means of membership functions. The shapes of the membership function depended on the form of the horizon approach function. In this study, triangle membership function was considered. The triangular membership function had gradually increased and decreased and only one definite value was generally used. The relationship between the inputs and outputs in a fuzzy model characterized linguistic statements was called fuzzy rules. Linguistic variables represented in the input numerical values were low, low medium, Medium, High medium, and High for cutting speed, feed and depth of cut. Eleven membership functions were
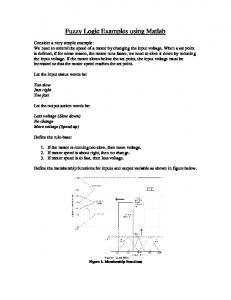
Bandit Suksawat / IERI Procedia 10 (2014) 76 – 84
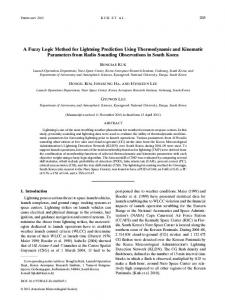
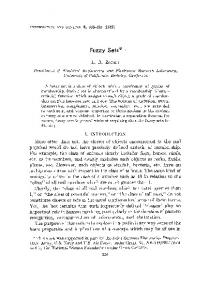
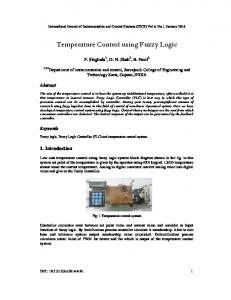
used for the output response as Lowest, Lower, Closely Low, Low, Low medium, medium, High medium, Closely High, High, Higher, and Highest. More precise results can be obtained by using number of membership functions, thus; 11-membership functions were selected for the present work. The expressions used for cutting speed, feed, cutting depth and diameter error were given in Table 1. Membership functions and their ranges of input parameters were shown in Fig 1-4. The fuzzy rules were developed based on the experimental results. Seventy-five fuzzy rules with 11 outputs were developed resulting in 75 experimental results by taking the max-min compositional operation. The output response of the fuzzy process was available only in fuzzy values and is to be defuzzified. For defuzzyfying, the values defuzzification were used. Dufuzzification was the conversion process and it converts fuzzy quantity into precise quantity.
Fig. 1. Membership function of feed rate
Fig. 3. Membership function of cutting speed
Fig. 2. Membership function of cutting depth
Fig. 4. Membership function of diameter error
Table 1. An example of fuzzy rules 1. IF 'Feed' IS 'Feed 01' AND 'Depth of cut' IS 'Depth 01' AND 'Cutting Speed' IS 'Cutting Speed 5' THEN 'SD' IS 'SD 06' 2. IF 'Feed' IS 'Feed 01' AND 'Depth of cut' IS 'Depth 02' AND 'Cutting Speed' IS 'Cutting Speed 4' THEN 'SD' IS 'SD 05' 3. IF 'Feed' IS 'Feed 01' AND 'Depth of cut' IS 'Depth 03' AND 'Cutting Speed' IS 'Cutting Speed 3' THEN 'SD' IS 'SD 05' 4. IF 'Feed' IS 'Feed 01' AND 'Depth of cut' IS 'Depth 04' AND 'Cutting Speed' IS 'Cutting Speed 2' THEN 'SD' IS 'SD 05' 5. IF 'Feed' IS 'Feed 01' AND 'Depth of cut' IS 'Depth 05' AND 'Cutting Speed' IS 'Cutting Speed 1' THEN 'SD' IS 'SD 04' 6. IF 'Feed' IS 'Feed 02' AND 'Depth of cut' IS 'Depth 01' AND 'Cutting Speed' IS 'Cutting Speed 5' THEN 'SD' IS 'SD 06' 7. IF 'Feed' IS 'Feed 02' AND 'Depth of cut' IS 'Depth 02' AND 'Cutting Speed' IS 'Cutting Speed 4' THEN 'SD' IS 'SD 05' 8. IF 'Feed' IS 'Feed 02' AND 'Depth of cut' IS 'Depth 03' AND 'Cutting Speed' IS 'Cutting Speed 3' THEN 'SD' IS 'SD 04' 9. IF 'Feed' IS 'Feed 02' AND 'Depth of cut' IS 'Depth 04' AND 'Cutting Speed' IS 'Cutting Speed 2' THEN 'SD' IS 'SD 08' 10. IF 'Feed' IS 'Feed 02' AND 'Depth of cut' IS 'Depth 05' AND 'Cutting Speed' IS 'Cutting Speed 1' THEN 'SD' IS 'SD 07' 11. IF 'Feed' IS 'Feed 03' AND 'Depth of cut' IS 'Depth 01' AND 'Cutting Speed' IS 'Cutting Speed 5' THEN 'SD' IS 'SD 04' 12. IF 'Feed' IS 'Feed 03' AND 'Depth of cut' IS 'Depth 02' AND 'Cutting Speed' IS 'Cutting Speed 4' THEN 'SD' IS 'SD 01'
The centroid of area defuzzification method was a general method that obtained more reliable results than other methods. This defuzzification method calculated the centroid of the area under the membership function.
79
80
Bandit Suksawat / IERI Procedia 10 (2014) 76 – 84
4. Experiments and Methods
L
A
B
C
The cast nylon 6 with mechanical properties of 1.14 g/cm3 of density, 740-920 MPa of tensile strength, and 40% of elongation was used. The workpieces were 25.4 mm in diameter and 120 mm in length. The square 9.5 mm single-point high-speed steel cutting tool was used in turning operation. A conventional form of high speed steel cutting tool geometry with 12q of clearance angle, 12q of rake angle and 66q of wedge angle was used in the experiments. The experiments were done in 5×5×3 factorials consisting of 0.04, 0.08, 0.125, 0.15 and 0.2 mm/rev of feed rate; 1.3, 1.8, 2.5, 3 and 4.5 of cutting depth; and 650, 1,140 and 2,000 rpm of turning revolution with different of cutting speed. Each experiment was performed in three replications. The machined part diameter was measured at three points consisting a, b and c on a circular cross section at each locations consisting of A, B and C along 150 mm of workpiece length (L) by using 1μm of accuracy micrometer (Fig.5). The measured data of each replication were used for computation of the standard deviation of machined diameter. The analysis of variance (ANOVA) of diameter error on each location was investigated for verification the equality of obtained data along workpiece length. The designed fuzzy system was utilized to predict diameter error based on the cutting conditions including feed rate, cutting speed and cutting depth as input parameters. The predicted diameter error was compared with diameter error from the experiment in absolute error and relative error. The validation of prediction was presented in relation of experiment and prediction results. The tendency of prediction accuracy was considered by correlation value. The factors affecting analysis (B. Suksawat, 2012 ) was also employed to examine an importance cutting parameter that affecting to uncertainty of cutting diameter for cast nylon 6 with single point cutting tool.
a
Fig. 5. Locations and points for diameter error measurement
5. Experiment and Simulation Results The average machined diameter absolute error in cast nylon 6 turning of each experiment were presented in Fig. 6. The turning speeds at 650, 1,100 and 2,000 rpm performed various cutting speed in range of 34.91161.48 m/s. The cutting speed can be classified in to three ranges consisting of 34.91- 52.48, 61.42-92.04 and 107.48-161.48 m/s based on turning speed values. The average machined diameter errors from experiment were 9.033, 8.140 and 8.983Pm with turning speed at 650, 1,140 and 2,000 rpm, respectively. Whereas, the maximum machined diameter errors were 35.593, 38.718 and 31.290 Pm for turning speed at 650, 1,140 and 2,000 rpm, respectively. The total average machined diameter error was 8.7186 Pm (SD = 7.606). Factors affecting analysis of dependent and independent variable showed the direct and indirect effect value in Fig.6. The direct effect value analysis of dependent variables of feed rate, depth of cut and cutting speed were 0.3085, 0.6521 and - 0.1832, respectively. The cutting parameters comprising of depth of cut and feed rate were strongly positive cohesion to machined diameter error in cast nylon 6 turning operation. However, the cutting speed exhibited negative effect to independent variable. The indirect effect value revealed that the relationship of cutting speed and depth of cut was negative cohesion with - 0.2954 of indirect effect value.
81
Bandit Suksawat / IERI Procedia 10 (2014) 76 – 84
Another, cohesion of cutting condition parameter can be negligible considered because the approximate absolute indirect effect values are close to zero. The total causal effect values (sum of the direct and indirect effects) for feed rate, depth of cut and cutting speed were 0.3085, 0.6553 and 0.0108, respectively. The analysis of variance (ANOVA) was employed to investigate longitude positions at position A, B and C on a workpiece which effected to diameter error in turning operation. The ANOVA analysis showed that the variance of diameter error on each positions were not different with 0.05 of significant value (Table 2). Therefore, the length parameter of a workpiece did not affect on diameter error in cast nylon 6 turning process. 45 650 rpm
Machined Diameter Error (Pm)
40
1140 rpm 2000 rpm
35 30 25 20 15 10 5 0 0
20
40
60
80 100 Cutting Speed (m/s)
120
140
160
Average 1.385641 1.334321 1.642241
Variance 2.158158 2.199533 2.071405
MS
F
P-value
2.041152 2.143032
0.95246
0.387362
180
Fig. 6. Machined diameter error on each cutting speed Table 2. Total prediction error and ANOVA results Groups Position A Position B Position C
Count 75 75 75
Sum 103.923 100.074 123.1681
ANOVA Source of Variation Between Groups Within Groups Total
SS 4.082305 475.7531 479.8354
df 2 222 224
F crit 3.036524
Almost 72 % of the experimental results had an absolute error value within 0.5 Pm and 14.67% had an absolute error in range of 0.5 - 1 Pm. However, a few results staged absolute error over 1 Pm. The tentative of machined diameter absolute error was decreased by increase of cutting speed. The relationship of average prediction absolute error and cutting speed at 650, 1,100 and 2,000 rpm are shown in Fig. 8. The average absolute error of each turning speed was decreased by increase of average cutting speed. This tentative error was affected by a distribution of an obtained machined diameter absolute error from the experimental results. In the experiment, the obtained diameter absolute error on 650 rpm data were achieved maximum range of
82
Bandit Suksawat / IERI Procedia 10 (2014) 76 – 84
distribution. While, the distribution of diameter absolute error data were gradually decreased by increase of turning speeds. The minimum, the maximum, an average and standard deviation (SD) value in terms of absolute and relative errors of prediction are shown in Table 3. The maximum absolute and relative error of prediction was 3.29 μm and 36.067%, respectively. However, the capability of fuzzy system as an average absolute and a relative value was 0.536 μm and 6.328%, respectively. The capability of prediction was validated by comparison of measured and predicted diameter error as shown in Fig. 9. Feed Rate
Table 3. Total prediction error results 0.3085
Machined Diameter Error
0.6521
Depth of Cut
Error Type
List
1.77 u 10-20
-1.45 u 10-3
Absolute (Pm)
Relative (%)
Minimum Value
0.007
0.104
Average Value
0.536
6.328
Maximum Value
3.293
36.067
-0.2954 - 0.1832 Cutting Speed
Fig. 7. Direct and indirect factors affecting on analysis results 3.50 650 rpm 1100 rpm 2000 rpm
Absolute Error (Pm)
3.00 2.50 2.00 1.50 1.00 0.50 0.00 0
20
40
60
80 100 120 Cutting Speed (m/s)
140
160
180
Fig. 8. Prediction absolute error of each cutting speed
The prediction results exhibited high accuracy with R2 = 0.988. From figure 9, the correlation between the experimental values and fuzzy predicted values was a very close indicating that fuzzy system can be effectively utilized for prediction diameter error in cast nylon 6 turning operation. The analysis of proposed fuzzy logic model performance exhibited that the statistical t-value of 0.5421 was in the range of critical t-value of ± 1.9925 as shown in Table 3. Therefore, the created diameter error prediction using fuzzy system was not significant difference from the measured data from experiments (p>0.05). The statistical F-value was 0.0021 which was less than the critical F-value thus null hypothesis was accepted (Table 4). From the result, it
83
Bandit Suksawat / IERI Procedia 10 (2014) 76 – 84
can conclude that precision between the prediction data using fuzzy system and measured data form experiments is not significant difference (p>0.05). Table 4. The paired T-test results for validation of different data set of measured and predicted value Measured Value
Detail Mean Variance Observations Pearson correlation
8.7186 57.8555 75 0.9940
Predicted Value
t Stat
8.6626 52.2721 75
0.5421
t Critical two-tail 1.9925
P(T