8378 • The Journal of Neuroscience, May 8, 2013 • 33(19):8378 – 8395
Behavioral/Cognitive
Differences between Primary Auditory Cortex and Auditory Belt Related to Encoding and Choice for AM Sounds Mamiko Niwa, Jeffrey S. Johnson, Kevin N. O’Connor, and Mitchell L. Sutter Center for Neuroscience and Department of Neurobiology, Physiology and Behavior, University of California, Davis, California 95618
We recorded from middle–lateral (ML) and primary (A1) auditory cortex while macaques discriminated amplitude-modulated (AM) noise from unmodulated noise. Compared with A1, ML had a higher proportion of neurons that encoded increasing AM depth by decreasing their firing rates (“decreasing” neurons), particularly with responses that were not synchronized to the modulation. Choice probability (CP) analysis revealed that A1 and ML activity were different during the first half of the test stimulus. In A1, significant CP began before the test stimulus, remained relatively constant (or increased slightly) during the stimulus, and increased greatly within 200 ms of lever release. Neurons in ML behaved similarly, except that significant CP disappeared during the first half of the stimulus and reappeared during the second half and prerelease periods. CP differences between A1 and ML depend on neural response type. In ML (but not A1), when activity was lower during the first half of the stimulus in nonsynchronized, decreasing neurons, the monkey was more likely to report AM. Neurons that both increased firing rate with increasing modulation depth (“increasing” neurons) and synchronized their responses to AM had similar choice-related activity dynamics in ML and A1. These results suggest that, when ascending the auditory system, there is a transformation in coding AM from primarily synchronized increasing responses in A1 to nonsynchronized and dual (increasing/decreasing) coding in ML. This sensory transformation is accompanied by changes in the timing of activity related to choice, suggesting functional differences between A1 and ML related to attention and/or behavior.
Introduction Although knowledge about macaque primary auditory cortex (A1) has grown in recent years, little is known about the transformations occurring in higher auditory cortical areas. Temporal modulation, such as amplitude modulation (AM), is a ubiquitous sound property used for a variety of functions such as, but not limited to, vocalization (including speech) processing, pitch analysis, and segregating sound sources. One hypothesis is that as the auditory system is ascended, the representation of temporal modulation changes from one where neurons temporally track the envelope (phase locking) to a non-phase-locking rate code (Lu et al., 2001). Another idea from research in several modalities is that activity becomes more tightly linked to attention, decisions, or categorizations as the cortical hierarchy is ascended (Nienborg and Cumming, 2006; Tsunada et al., 2011). There are at least three core, seven belt, and two parabelt monkey auditory cortical fields (Kaas and Hackett, 1999, 2000). The core fields, including A1, are considered the primary stage in Received June 4, 2012; revised March 11, 2013; accepted March 31, 2013. Author contributions: M.N., K.N.O., and M.L.S. designed research; M.N. and K.N.O. performed research; M.N. and J.S.J. contributed unpublished reagents/analytic tools; M.N. and M.L.S. analyzed data; M.N. and M.L.S. wrote the paper. This work was supported by the National Institutes of Health (National Institute on Deafness and Other Communication Disorders Grant 02514 to M.L.S. and National Research Service Award F31DC008935 to M.N.). We thank Drs. Gregg Recanzone, Ken Britten, and Jochen Ditterich for useful comments on the manuscript; and Elizabeth Engall and Zachary Cline-Egri for help with animal training and recording. The authors declare no competing financial interests. Correspondence should be addressed to Mitchell L. Sutter, Center for Neuroscience, University of California– Davis, 1544 Newton Court, Davis CA 95618. E-mail:
[email protected]. M. Niwa’s present address: DepartmentofOtolaryngology,StanfordUniversitySchoolofMedicine,Stanford,CA94305. DOI:10.1523/JNEUROSCI.2672-12.2013 Copyright © 2013 the authors 0270-6474/13/338378-18$15.00/0
the auditory cortical hierarchy. The belt concentrically surrounds the core,and is considered the secondary stage. This classification is based on the belt’s connectivity to the thalamus, core, and parabelt (Morel and Kaas, 1992; Rauschecker, 1997; Hackett et al., 1998; Romanski et al., 1999; de la Mothe et al., 2006a, 2006b); slower first-spike latencies than the core (Recanzone et al., 2000; Lakatos et al., 2005); and increased level of spectral integration and response preference to more complex sounds (Imig et al., 1977; Rauschecker et al., 1995; Kosaki et al., 1997; Recanzone et al., 2000; Wessinger et al., 2001; Rauschecker and Tian, 2004; Lakatos et al., 2005; Petkov et al., 2006; Kus´mierek and Rauschecker, 2009). The middle–lateral (ML) area is an auditory belt area immediately lateral to and heavily interconnected with A1 (Morel et al., 1993; Kus´mierek et al., 2012). Our understanding of the relationship between single neuron activity and perception has been greatly advanced by simultaneously recording neural activity and animals’ perceptual judgments (Tolhurst et al., 1983; Barlow et al., 1987; Newsome et al., 1989; Sinclair and Burton, 1991; Britten et al., 1992) and using choice probability (CP) analysis, which quantifies the relationship between neural activity and choice on a trial-by-trial basis (Celebrini and Newsome, 1994; Britten et al., 1996; Dodd et al., 2001; Cook and Maunsell, 2002; Romo et al., 2002; Krug, 2004; Uka and DeAngelis, 2004; Uka et al., 2005; Cohen and Newsome, 2009; Nienborg and Cumming, 2009; Herna´ndez et al., 2010). Although a relationship between neural activity and choice on a trial-by-trial basis might reflect the animal’s decision, it may also be related to attention (Nienborg and Cumming, 2009). Using CP analyses, activity related to macaque choices during AM discrimination has been reported recently in A1 (Niwa et al.,
Niwa et al. • AM and Choice-Related Activity in A1 and ML
J. Neurosci., May 8, 2013 • 33(19):8378 – 8395 • 8379
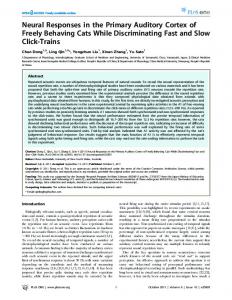
Figure 1. Schematic of the behavioral paradigm illustrating the time course of events in the AM discrimination task for the four possible trial-response combinations. Trial initiation began with the presentation of a light cue, when the monkey depressed a lever for sound presentation (“observing response”). A correct “hit” response (top) occurred when the monkey released the lever within the 800 ms response window after a modulated test stimulus. This response window began at stimulus offset and terminated 800 ms later. A liquid reward was given (blue drop) for a hit. A false alarm (second from top) occurred when the second sound was unmodulated and the monkey incorrectly responded during the 800 ms window. A correct rejection (second from bottom) occurred when the second sound was not modulated and the monkey continued to depress the lever during the entire 800 ms window; correct rejections were also rewarded. A miss (bottom) occurred when the test stimulus was modulated and the monkey continued depressing the lever for the entire 800 ms response window. Misses were incorrect. On this task, two different types of lever release were possible: report-release occurred when the animal released the lever within the 800 ms window to report AM (for hits and false alarms) and resume-release occurred on correct rejection and miss trials,after the 800 ms window when the monkey had to release the lever to start a new trial.
2012a), but choice-related activity has not been reported in higher belt auditory cortical areas (Tsunada et al., 2011). Here we used CP analysis to compare A1 and ML and to investigate possible hierarchal organization between these areas.
Materials and Methods Subjects Experiments were performed in the right hemisphere of three adult rhesus macaque monkeys (Macaca mulatta), two female and one male, weighing 6 –11 kg. Physiological recordings from ML belt cortex were obtained from two monkeys (monkeys W and X), and those from A1 were from all three monkeys (monkeys W, X, and V). All procedures conformed to the Public Health Service policy on experimental animal care and were approved by the University of California–Davis animal care and use committee.
Stimulus generation and delivery The acoustic stimuli in the experiments were 800 ms sinusoidally AM broadband noise bursts (modulation frequencies: 2.5, 5, 10, 15, 20, 30, 60, 120, 250, 500, and 1000 Hz; modulation depths: 6, 16, 28, 40, 60, 80, and 100%). Unmodulated (0% modulation) broadband noise was also used. The noise carrier was “frozen,” meaning that the same noise carrier was used for all stimuli. Because the carrier was identical for all trials, trial-by-trial stimulus differences based on the carrier waveform were eliminated, which reduces a source of variance for CP analysis. If nonfrozen noise were used, a trial-by-trial difference in noise carrier could cause trial-by-trial differences in responses unrelated to modulation, making it more difficult to properly assess the relationship between firing rate and the animal’s choice. MATLAB (MathWorks) was used to create sound waveforms, which were sent to a programmable (PA5; TDT Systems) and passive attenuator
(LAT-45; Leader Instruments) after digital-to-analog conversion (model 1401; Cambridge Electronic Design). The signal was amplified (MPA200; Radio Shack) before being delivered to a speaker. Two different sound-delivery systems were used in one of two double-walled, soundattenuated, foam-lined booths (IAC: 9.5⬘ ⫻ 10.5⬘ ⫻ 6.5⬘ or 4⬘ ⫻ 3⬘ ⫻ 6.5⬘). In the larger booth, a Radio Shack PA-110 speaker was placed 1.5 m in front of the subject at ear level; in the smaller booth, a Radio Shack Optimus Pro-7AV speaker was placed 0.8 m in front of the subject at ear level. The sound was generated at a sampling rate of 100 kHz and was cosine ramped at onset and offset with 5.0 ms rise/fall time. Stimulus intensity was calibrated to 63 dB sound pressure level (model 2231; Bru¨el & Kjaer) in an empty booth at the location where the monkey’s head would be.
AM detection task The monkeys discriminated AM from unmodulated noise (typically called an AM detection task because they detect whether the test stimulus is AM compared with an unmodulated standard stimulus). Schematics of the task are shown in Figure 1. The monkeys were trained to initiate a trial by pressing and holding down a lever. In a trial, two 800 ms sounds were presented, separated by a 400 ms intersound interval (ISI). The first sound (standard) was an unmodulated noise, and the second (test stimulus) was either an AM noise (target) or a repetition of the unmodulated noise (nontarget). During a single recording session, target stimuli had a fixed modulation frequency (the multiple unit [MU] best modulation frequency [BMF]; see “Physiological recording” section below) and depths spanning 6 –100%. Subjects were required to respond to AM targets by releasing the lever during an 800 ms response window after the offset of the test stimulus. They were not allowed to respond during the sound; if they attempted this, the trial was terminated and re-presented
8380 • J. Neurosci., May 8, 2013 • 33(19):8378 – 8395
after a brief interval. When the test stimulus was unmodulated, the subjects were required to hold down the lever for the entire 800 ms response window. Response time (RT) was defined as the time period measured from test stimulus offset to lever release. Animals were water regulated and rewarded with juice or water on all correct trials, which included hits (a lever release for target trials) and correct rejections (holding down the lever for nontarget trials). Animals were informed of incorrect responses, which included misses (not releasing the lever on target trials) and false alarms (releasing the lever on nontarget trials) by the offset of an incandescent light placed in front of them. False alarms were also followed by a time-out period of 15– 60 s.
Physiological recording Physiological techniques similar to those described previously by Niwa et al. (2012a, 2012b) were used. A titanium head post was positioned anteriorly and a CILUX recording chamber (Crist Instruments) was placed over parietal cortex and secured using dental acrylic. The electrode was tilted at ⬃10 degrees. This placement and angle allowed for near vertical access to ML and A1. A plastic grid with 27-gauge holes (Crist Instruments) covering a 15 ⫻ 15 mm brain area at 1 mm intervals was placed on the recording chamber. A stainless steel, transdural guide tube was inserted into one hole of the grid on each recording day. A high-impedance tungsten microelectrode (1– 4 M⍀; for FHC, 0.5–1 M⍀; Alpha-Omega Engineering) was inserted through the guide tube and lowered into A1 or ML by a hydraulic microdrive (FHC). All recordings were made while the animals were head restrained via a connection between the head post and a custom-made primate chair that was “acoustically transparent” (i.e., constructed primarily from wire rather than plastic panels to minimize acoustical reflections; Crist Instruments). Electrophysiological signals were amplified and filtered (0.3–10 kHz; A-M Systems model 1800 and Krohn-Hite model 3382), sampled at a rate of 50 kHz through an A/D converter (model 1401; CED), sent to a PC, and saved onto the computer’s hard disk. The time stamps of all other relevant events were saved for later analysis. Action potentials were sorted and assigned to individual neurons preliminarily online and then refined offline using a waveform-matching algorithm supplied in SPIKE2 software (CED).
Data analysis Determination of BMF. The BMF was determined for every recording site’s MU activity by presenting 100% depth AM noise at the following modulation frequencies: 2.5, 5, 10, 15, 20, 30, 60, 120, 250, 500, and 1000 Hz. Unmodulated noise was also presented because the BMF was defined as the modulation frequency at which the unit best discriminated AM from unmodulated noise. The BMF was calculated by receiver operating characteristic (ROC) analysis using firing rate and vector strength (VS; see “ROC analysis” section for details). From the ROC analysis, we obtained two measures: (1) BMFVS, the modulation frequency with the greatest VS-based ROC area, and (2) BMFSC, the modulation frequency with rate-based ROC area most deviant from 0.5. The ROC area is bounded by 0 and 1, and the farther the values are from 0.5, the better the responses can distinguish AM from unmodulated noise (0 and 1 represent perfect discrimination). BMFSC could be based on either increases (ROC area close to 1) or decreases (ROC area close to 0) of activity in response to AM relative to the unmodulated noise. If activity increased at some modulation frequencies and decreased at others relative to unmodulated noise, the one with better AM discrimination (ROC area furthest from 0.5) was chosen. We then recorded unit activity while the animals worked on the behavioral task, varying modulation depth from trial to trial. We did this recording at the BMF. We chose the BMF to use for depth-sensitivity functions as follows: (1) if one BMF measure (BMFVS or BMFSC) had ROC area ⬎0.75 (or ⬍0.25) and the other did not, then the BMF with ROC area ⬎0.75 (or ⬍0.25) was used; (2) if both BMFs had ROC ⬎0.25 from 0.5 (ROC area ⬎0.75 or ⬍0.25), but one ROC area was ⬎0.1– 0.15 than the other, the BMF with the ROC area most deviant from 0.5 was chosen; (3) if both ROC areas were ⬎0.25 from 0.5 and within 0.1– 0.15 of each other, we used the type of BMF that differed from the last one used (this could mean going back to the previous recording session if this
Niwa et al. • AM and Choice-Related Activity in A1 and ML
were the first unit of the day). After the BMF was selected, animals performed the AM detection task and the neural data obtained during the task were analyzed. ROC analysis. We applied signal-detection-theory-based ROC analysis (Green and Swets, 1974) to determine the degree to which neurons or MU recordings could discriminate AM from its unmodulated carrier. To calculate ROC area, a unit’s response to the AM sound was first determined using a particular neural measure (i.e., either the firing rate or the ability to phase lock to AM) in each trial. The response to unmodulated sound was also calculated using the same neural measure on each redundant trial. Probability distributions of the response measure were then determined for the AM and the unmodulated noise. For each probability distribution, we determined the proportion of trials in which the neural response measure exceeded a given criterion level on modulated (PAM) and unmodulated (PunMod) test stimulus trials. If we assume that in a trial in which a criterion is exceeded, the neuron reports AM, then PAM is analogous to hit rate in psychophysical experiments, whereas PunMod is analogous to the false alarm rate. This procedure was repeated at 100 criterion values spanning the full range of both distributions for each modulation depth. The two-dimensional plot of all pairs of PAM and PunMod at a given depth (or modulation frequency for BMF determination) forms the neural ROC, and the area under the ROC is called the neural ROC area; here, the neural ROC area represents the neural discriminability of AM from the noise carrier. This is the probability with which an ideal observer can determine if the stimulus is AM based solely on the response of the neuron. A neural ROC of 1 means the measure (e.g., firing rate) is always higher on AM (target) trials than unmodulated (nontarget) to trials (no overlap in distributions), so in any trial an ideal observer could predict with 100% accuracy whether the sound was modulated simply by observing the firing rate. An ROC area of 0.5 means that an ideal observer would perform at chance. ROC area is symmetric around 0.5 such that an ROC area of 0 also indicates that an ideal observer could predict with 100% accuracy whether the sound was modulated; however, in this case, the measure is always lower for modulated than unmodulated sounds. We obtained a single measure of a neuron’s AM discriminability by averaging ROC areas over all depths (6 –100%) because we needed a measure of discriminability for all units and neural threshold (the modulation depth at which the ROC area reaches a particular detection level) cannot be determined for all units (Yin et al., 2011). Classification of decreasing units. To classify a unit as increasing or decreasing, we analyzed the slope of the ROC area versus modulation depth neurometric function. We fitted a linear regression to the neurometric function and, based on the slope, the response was characterized as increasing (positive slope) or decreasing (negative slope). CP. CP analysis was used to quantify the trial-to-trial relationship between neural activity and an animal’s decision. CP analysis is essentially identical to ROC analysis except that trials are partitioned according to the animal’s choice rather than by the type of stimulus. CP measures the overlap in distributions of an activity measure (e.g., firing rate or VS) partitioned by whether the animal reported modulation. CP, like ROC area, ranges from 0 to 1. A CP value of 1 means that the measure is always higher when the animal reports AM; therefore, the activity measure on any individual trial predicts with 100% accuracy whether the animal reported the sound as modulated. There are many reasons that CP might be near 1, including but not limited to the following: activity that informs the decision, activity that is part of the decision process, or activity that reflects the attentional level of the animal with a higher attentional level on correctly responding trials. A CP value of 0 also means that the neuron is 100% accurate, but in this case, the response measure is always lower on trials in which the animal reports AM. A CP value of 0.5 means that predictions of the animal’s decision based on neural activity can only be made at chance level. Below, procedures for firing-rate-based CP are described, but VSbased CP is calculated in the same fashion. First, the average firing rate was calculated in a time window of interest for each trial. In the next section, time windowing is described for CP related to lever release that is not necessarily aligned with the stimulus). At each modulation depth, distributions of trial-by-trial firing rates were made separately for two
Niwa et al. • AM and Choice-Related Activity in A1 and ML
conditions: (1) the “responded” condition in which an animal released the lever to report AM (hit or false alarm trials), and (2) the “nonresponded” condition in which the animal reports an unmodulated sound by continuing to depress the lever during the 800 ms response window (miss or correct rejection trials). We then calculated the proportion of responded-condition trials (Pr) having firing rates greater than a given criterion level and the proportion of nonresponded trials (Pnr) exceeding the same criterion. This procedure was repeated using 100 criterion values taken from the full range of firing rates found in responded and nonresponded trials at that depth. A curve was generated by plotting Pnr against Pr. CP is the area under this curve. There were few nonresponded trials at high modulation depths (60, 80, and 100%) because the modulation was so easy to detect and the animals were nearly perfect. In addition, there were few responded trials for modulation depths ⬍16%, because this modulation was typically below the animals’ AM detection thresholds. To reliably compare firing rate between responded and nonresponded conditions, CP analysis was performed only at modulation depths having ⱖ5 trials in both conditions. Typically, for a unit, two to three modulation depths had ⱖ5 trials in both conditions. To assess each unit’s overall quantitative relationship between firing rate and the animal’s choice, we calculated a “grand CP.” for which firing rates were transformed into z-scores at each depth and z-scores were collapsed across depths (for depths having ⱖ5 trials only) in responded and nonresponded conditions. Distributions of z-scores were then determined for responded and nonresponded conditions, a CP curve was generated, and the area under this curve was calculated to determine a grand CP for each unit. The significance of each unit’s grand CP was determined using a permutation test (Britten et al., 1996). Briefly, the z-scores (collapsed across depths) from responded and nonresponded conditions were pooled. Random samples were taken from the pool without replacement, and assigned to “responded” and “nonresponded” conditions in the same proportion as found in the experiment. Grand CP was then calculated from the random samples. This procedure was repeated 2000 times. The p value equals the proportion of grand CP values from the random process lying above the experimentally obtained grand CP. CP related to lever release. In addition to calculating CP during the standard, ISI, and test periods, we also calculated CP for periods before report-release and before resume-release (Fig. 1). Report-release occurs when the animal releases the lever within the 800 ms after stimulus offset to report AM and resume-release occurs when the animal releases the lever after a miss or correct rejection to start another trial (Fig. 1). Resume-release data were available because, to initiate the next trial after a miss (or correct rejection), the subject had to first release the lever. We calculated CP for resume-release trials after target misses only. Data could not be used for correct rejections, because in these trials, a reward was administered while the lever was held down (Fig. 1) and during and after reward delivery, acoustical noise would be present. As in all CP analyses, we only included the modulation depths that had ⱖ5 responded and ⱖ5 nonresponded trials. Resume-release analysis was performed to determine the degree to which more general premotor or somatosensory activity was present in auditory cortical neurons (this influences interpretation of report-release because report-release could be due to these more general effects rather than activity related to detecting AM). For calculating CP during a fixed-length time window aligned to the lever release, additional steps were necessary for two reasons: (1) reportrelease did not occur on nonresponded trials, and (2) in trials in which animals reported AM, they released the lever at different times relative to stimulus onset. Therefore, when comparing activity aligned to lever release on report-release and resume-release trials, the comparable time window for trials when the animals did not release the lever is not obvious. Report-release CP factoring out stimulus effects. Firing rate was calculated in the 200 ms time window before report-release in each trial in which the animal responded. Because nonresponded trials have no lever release, we needed to determine an appropriate time window to count spikes. The first way we did this was to select windows for responded and nonresponded trials at equivalent times relative to the stimulus so that
J. Neurosci., May 8, 2013 • 33(19):8378 – 8395 • 8381
the stimulus effects were the same in both conditions and could be factored out. We implemented this by randomly sampling (with replacement) RTs (the time from the end of the stimulus to lever release) from the pool of RTs obtained in the responded trials at the same depth as the nonresponded trials of interest. For the nonresponded trials at that depth, we then calculated firing rate using 200 ms windows before the sampled RTs (i.e., at the same times relative to stimulus offset). In this way, we sampled identical times relative to the stimulus for responded and nonresponded trials so that stimulus effects would not be present in the CP analysis. The grand CP was calculated based on z-scores (collapsed across depths) for responded and nonresponded trials. We determined the significance of this CP using a permutation test. This entire procedure was repeated 1000 times using a different set of random RT samples on each repetition, and 1000 grand CP values and p values were obtained. The median grand CP and its corresponding p value were used as the CP estimate and p value for each unit. Report-release CP factoring out reward-anticipation effects. Because expectation of a reward could contribute to the activity before the behavioral response and reward-related parameters can affect auditory cortical activity (Brosch et al., 2011), we also performed an analysis to factor out reward-anticipation effects. In our behavioral paradigm, animals should expect rewards for both responded and nonresponded trials, because rewards are given for both releasing the lever for AM sounds and for withholding the lever release for unmodulated stimuli. However, the timing of reward delivery relative to the test stimulus differed between responded and nonresponded trials; a reward almost immediately followed lever release on correct responded trials (hits), whereas it occurred later (after the 800 ms response window) on correct nonresponded trials (Fig. 1). This suggests that reward might more strongly affect firing rate on responded trials, during the time windows used for CP analyses that factors out stimulus effects, because that window is closer in time to the reward than the window used in nonresponded trials. Therefore, we examined the data relative to the timing of reward. For this analysis, in nonresponded trials, we counted spikes in a time window aligned to the end of the 800 ms response window so as to occur at the same time relative to when the reward is expected in responded trials (just after lever release). CP was calculated by comparing the firing rate during 400 ms before report-release in responded trials to the rate during the 400 ms before the end of the 800 ms response window (at the end of this window, a reward was administered for correct rejections) in nonresponded trials. Resume-release CP. For this analysis, we counted spikes in a 200 ms window aligned to resume release and compared this activity with 200 ms of spontaneous activity. Because resume-release was compared with spontaneous periods whereas report-release compares activity relative to the stimulus (usually ⬎100 ms after the stimulus), care must be taken in comparing these numbers. Different time periods (200 and 400 ms) were used for different lever release analyses. A shorter 200 ms duration window was used for comparing activity before reporting AM (report-release) to activity before resume-release. We used the shorter 200 ms window to be as far removed in time from the stimulus as possible because report-release and resumerelease occur at different times relative to the stimulus and we did not want the stimulus proximity of report-release to influence these comparisons. For other lever release analyses, we used a 400 ms window so that the same duration windows as for the other time period analyses was used (400 ms ISI, first 400 ms of stimulus, second 400 ms of stimulus). VS and phase-projected VS. VS measures the precision of phase locking and is defined as follows:
VS ⫽
冑冉 冘
冊 冉冘 2
n i⫽1
cos i
⫹
n i⫽1
n
冊
2
sin i
,
(1)
where n is the total number of spikes and i is the phase of each spike in radians. i is calculated as follows:
i ⫽ 2
共 t i modulo p 兲 , p
(2)
Niwa et al. • AM and Choice-Related Activity in A1 and ML
8382 • J. Neurosci., May 8, 2013 • 33(19):8378 – 8395
where ti is the time of the spike relative to the onset of the stimulus and p is the modulation period of the stimulus (Mardia and Jupp, 2000). VS varies from 0 to 1; a value of one indicates perfect phase locking (all spikes at the same time of each cycle) whereas 0 means no phase locking (or circular symmetric firing relative to the AM period). The unaltered VS has difficulty quantifying phase locking at low firing rates because artificially high VS values are obtained. This can be demonstrated when no phase locking (random spikes in time) is present but there are low spike counts. For example, if one spike is fired on a given trial, a VS of 1 would result regardless of when that spike occurred. If two spikes are fired randomly in time, a high VS would also likely result because the probability that two random spikes fire 180 degree out of phase with each other (relative to the stimulus modulation period) is low. However, the only way to get a VS value of 0 for two spikes is if they fire 180 degrees out of phase relative to the modulation. If sampling from a random distribution of spikes in time, VS will approach zero as the number of spikes approaches infinity. Because we needed to calculate VS on a trial-by-trial basis for CP and ROC analysis, VS in low spike-count trials is a critical issue because some single-units fire only a few spikes in a single trial. A measure known as phase-projected VS (VSPP) was implemented to address this issue (Yin et al., 2011; Johnson et al., 2012). VSPP compares the mean phase angle for each trial with the mean phase angle of all trials (“global” response to obtain “reference” phase) and penalizes single-trial VS values if they are not in phase with the global response. VSPP is calculated on a trial-by-trial basis as follows:
VS pp ⫽ VS t cos共t ⫺ c 兲,
(3)
where VSt is the VS per trial, calculated as in Equation 1, and t and c are the mean phases of the trial-by-trial and the global responses (angle in radians), respectively. The mean phase angle, c, for each cell was the phase calculated from all trials at 100% depth at a given modulation frequency. For all VSPP calculations, a trial with no spikes was assigned a VSPP of zero. VSPP ranges from 1 (all spikes in phase with the mean phase of the global response) to ⫺1 (all spikes 180 degrees out of phase with mean phase of the global response). A VSPP of 0 corresponds to spikes occurring at random phase with respect to the global mean phase. Except for the cases in which there were low spike counts, the two VS measures were in good agreement (Yin et al., 2011). Identification of auditory cortical fields. Frequency tuning curves were made to assess tonotopic organization of the auditory cortical fields. At each recording site, frequency tuning was measured by presenting 100 ms pure tones at different frequency and intensity combinations. If the unit was lost after the AM experiment but before frequency tuning was completed, we moved the electrode slightly to measure frequency tuning on a nearby MU. An initial assessment of the preferred frequency range was done by manually varying frequency and intensity to determine the range used in the automated procedure. We typically used a 3 octave range in 1/5 octave steps around the preferred frequency estimated using the initial manual assessment in the automated procedure. Intensities typically spanned 80 dB in 10 dB steps between 10 and 90 dB SPL. Random order presentation was used to determine frequency tuning and each stimulus was repeated at least twice for each frequency-intensity combination. Firing rate was calculated during the 100 ms stimulus window and a two-dimensional response matrix (intensity ⫻ frequency) was created. The neuron’s frequency tuning curve was estimated using the contour line at the mean spontaneous response (firing rate in a 75 ms window before the stimulus onset) plus two SDs (MATLAB’s “contourc” function). The best frequency (BF) and threshold were determined from the obtained frequency tuning curve. A tonotopic map was created from BF in all recordings for each animal. The location of A1 was determined based on a systematic increase in BF from anterior to posterior cortical locations and approximately constant BF along the medial-lateral axis. We determined the border of A1 and ML based on the lack of response robustness to tones, slower tone response latency, and wider width of frequency tuning for ML locations (Merzenich and Brugge, 1973; Morel et al., 1993; Kosaki et al., 1997; Rauschecker, 1997; Recanzone et al., 2000). Because not much information about ML response properties exists, we report the summary of our comparison of MUs in A1 and ML
Table 1. Differences in basic measures between A1 and ML for MUs (means ⴞ SD) Measure Onset latency (ms) Peak latency (ms) Average firing rate (spikes/s) Peak firing rate (spikes/s) BW30 (octaves)
A1
ML
14 ⫾ 7.4 34.9 ⫾ 19.7 104.9 ⫾ 68.3 311 ⫾ 133 1.10 ⫾ 1.31
19.5 ⫾ 18.7 46.5 ⫾ 31.5 70.9 ⫾ 53.1 235 ⫾ 118 1.74 ⫾ 1.81
(Table 1). In general, the trends were similar to those reported in an single-unit (SU) study (Recanzone et al., 2000), although the absolute values are different in ways one would expect when comparing MU (ours) with SU properties. Another difference is that Recanzone et al. did not specifically target ML and used a different nomenclature, so that their numbers included both ML and AL recordings. In our study, putative ML was identified as a narrow strip of 2–3 mm width located lateral to the physiologically determined A1/ML border. When time permitted, we also recorded unit responses to 100 ms bandpass noise with various center frequencies and various bandpass filter widths at multiple intensity levels. The filter widths were 1/3, 1/2, 1, and/or 2 octaves, because a similar range was found previously to be effective in the belt areas (Rauschecker and Tian, 2004). Intensities typically spanned 80 dB with a 10 dB increment between 10 and 90 dB SPL. Stimuli were presented in random order and repeated one to three times for each (frequency, filter-width, intensity) combination. A two-dimensional response matrix (intensity ⫻ frequency) was obtained for each filter-width size using firing rate during the 0 –100 or 0 –150 ms window after stimulus onset depending on the response profiles at each recording site. The neuron’s frequency tuning curve was estimated as described above, and the BF and the preferred filter width size were determined from the frequency-intensity contour plots. The anterior– posterior border of ML (the borders with AL and CL) was estimated on a systematic change in BF using this bandpass noise tuning.
Results We recorded spiking activity from 66 MUs and 123 SUs derived from 43 penetrations in the ML of two macaque monkeys’ right auditory cortex while they discriminated AM. For comparison purposes, we further analyzed 100 MUs and 237 SUs (derived from 75 penetrations) from A1 in the same two monkeys and a third monkey. These A1 neurons were also used in another study (Niwa et al., 2012a). Before reporting choice-related activity, we need to briefly describe how well ML neurons detect modulation, because responses of ML neurons to AM have never been reported. ML responses to AM A major difference between A1 and ML is that, in ML, there is a larger proportion of “decreasing” units—those in which firing decreases with increasing modulation depth at the MUs BMF (Table 2). The higher proportion of decreasing units in ML than A1 was significant ( 2 ⬍ 0.001 for MUs and SUs). Therefore, when analyzing the ability of ML units to determine whether a sound is modulated, we broke them down by field and response type (Fig. 2). In general, units in both fields were similar in their ability to detect rate-based AM (100% modulation depth), but ML was worse than A1 at phase locking for frequencies ⬎⬃15 Hz. The firing-rate-based ROC areas in ML and A1 were similar for both increasing and decreasing responses. This was true when all responses were taken (population mean ROC area, Fig. 2 A, B) and when only considering responses that could significantly distinguish AM from unmodulated noise (Fig. 2C,D). If responses were not segregated by increasing and decreasing response type, ML would have lower ROC areas than A1 because ML has more
Niwa et al. • AM and Choice-Related Activity in A1 and ML
J. Neurosci., May 8, 2013 • 33(19):8378 – 8395 • 8383
Table 2. Percentages of increasing and decreasing units including breakdown by synchronized and nonsynchronized responses ML SU A1 SU S2 SUa S1 SUa ML MU A1 MU
Decreasing
Increasing
Nonsynchronized
Decreasing synchronized
Decreasing nonsynchronized
Increasing synchronized
Increasing nonsynchronized
42% 19% 42% 8% 33% 13%
58% 81% 58% 92% 67% 87%
34% 22%
26% 15%
15% 3%
39% 63%
19% 19%
20% 11%
29% 13%
4% 0%
51% 77%
16% 11%
a
S1 and S2 data are from Romo et al. (2002).
Figure 2. Ability of ML and A1 neurons to discriminate AM noise from unmodulated noise. Each point represents an average score over units. Response type (increasing vs decreasing) was based on the response of a unit at a particular modulation frequency. Therefore, a unit could have increasing responses at some modulation frequencies and decreasing responses at other modulation frequencies. For each unit, ROC areas were calculated by comparing 100% AM responses with unmodulated noise responses. Significant responses were determined by a t test comparing the AM responses with the unmodulated noise responses for each unit at each modulation frequency. Significant increasing responses were defined as a response in which firing was greater for modulated than unmodulated sounds. Significant decreasing responses were defined as a response in which firing was less for modulated than for unmodulated sounds. A, ROC area based on firing rate using all MU responses. B, ROC area based on firing rate using all SU responses (i.e., the population mean ROC area). C, ROC area based on firing rate only using MUs with significant differences between AM and unmodulated noise responses at that frequency. D, Same as C but for SUs. E, ROC area based on VS using all MU responses. F, ROC area based on VS using all SU responses. G, ROC area based on VS using only MUs with significantly different VS for AM compared with unmodulated noise at that frequency. H, Same as G but for SUs. I, J, Raw VS values for MUs and SUs using only MUs with significantly different VS for AM compared with unmodulated noise at that frequency.
decreasing responses than A1 and these decreasing responses would counteract the increasing responses, bringing the ML mean closer to 0.5. ML was generally worse at phase locking than A1. The ability to detect modulation based on phase locking was worse in ML across the entire population of neurons (Fig. 2 E, F ). However, for those ML units that significantly phase locked, AM detection improved and the differences between A1 and ML were much smaller (Fig. 2G,H ). However, for those units that did significantly phase lock, raw VS was on average lower in ML than A1 for all frequencies ⬎5 Hz (Fig. 2 I, J ). These data support that AM rate coding is similar in ML and A1, but phase-locked coding is worse. In addition, in ML, the emergence of a large proportion of units that decrease firing rate
with increasing modulation depth necessitates breaking down the analyses by response type. CP in auditory cortex CP analysis was performed to examine whether ML neurons’ firing rates were related to the animals’ behavioral choices on a trial-by-trial basis. CP was calculated by comparing the distribution of firing rate from trials in which animals reported AM by releasing the lever (responded trials) to firing-rate distributions from trials in which they did not report AM (nonresponded trials). We present CP examined in five different time periods over the course of a single trial: (1) during the standard sound (first sound in a trial, which was always unmodulated noise), (2) during the 400 ms silent period after the standard but before the test
Niwa et al. • AM and Choice-Related Activity in A1 and ML
8384 • J. Neurosci., May 8, 2013 • 33(19):8378 – 8395
Table 3. Proportion of units exhibiting a significant increase in firing rate (CP >0.5 and p < 0.05 by permutation test) for MUs and SUs in ML and A1 ML MU A1 MU ML SU A1 SU
n
Report onlya
Resume onlyb
Bothc
Reportd
Resumee
61 97 114 232
16.4 11.3 8.8 13.8
24.6 13.4 23.7 14.7
24.6 39.1 11.4 16.4
41 50.5 20.2 30.2
49.2 52.6 35.1 31.0
CPs for report-release were calculated with a 200 ms time window so that both report-related and resume-release related activity can be compared using the same duration. Note that in this table, the proportion of units in ML is calculated based on 61 MUs and 114 SUs (instead of the total samples of 66 MUs and 123 SUs in, e.g., Fig. 4). The missing five MUs and nine SUs were excluded from this calculation because the original data files that recorded the time of animals’ resume-release was corrupted, so the CP for resume-release could not be calculated. a Only prior to report release. b Only prior to resume-release. c Both report- and resume-release. d Prior to report-release. e Prior to resume-release.
stimulus (ISI period), (3) during the first half of the test stimulus (0 – 400 ms), (4) during the second half of the test stimulus (400 – 800 ms), and (5) during the 400 (and 200) ms period before the animals’ behavioral response (see Materials and Methods, “Resume-release CP”). In presenting the data in this study, we go backwards in time: we first present pre-lever-release analyses and then the sound sequence analyses proceeding from largest CP effects to smallest. We also examined whether the strength of phase locking by ML neurons was correlated with animals’ choice using CP analysis. Activity related to lever release in the AM task In A1 and ML, many units increased activity before resumerelease, report-release, or both (Table 3), suggesting that a premotor influence is present. A smaller proportion of neurons increased activity only before report-release, suggesting that either lever-related activity is modulated by task context or a different type of activity is present in the neurons only displaying report-release activity. In addition, fewer responses in ML than A1 were significant for both report and resume-release, suggesting that a simple motor-related effect for all lever releases is less common in ML. Figure 3 exemplifies an ML MU with both report-release and resume-release activity. This unit responded to 5 Hz AM by increasing firing rate with modulation depth (Fig. 3A). In addition, there were large, sustained increases in activity after stimulus offset at higher modulation depths. When trials are partitioned by the animal’s behavioral choice into “responded” (Fig. 3B) and “nonresponded” (Fig. 3C), it becomes clear that this sustained activity was related to the animal’s behavioral response rather than to a stimulus offset. For the responded trials shown in Figure 3B, at each modulation depth, trials are sorted by the animal’s RT (shortest RTs on top for each depth) and activity is time aligned to lever release. Sustained discharges started ⬃150 ms before lever release regardless of the RT and modulation depth, and the strength of this discharge also appeared to be depth independent (Fig. 3B). In contrast, activity increases could not be seen during an equivalent time period in nonresponded trials (Fig. 3C, aligned to stimulus onset). To better visualize this difference, the average firing rate was plotted (Fig. 3 D, E) to compare responded and nonresponded trials directly. Because there was no lever release in nonresponded trials, the nonresponded trials plot in Figure 3E is aligned to the average RT (relative to the stimulus) obtained from the responded trials at the same depth. This resulted in comparisons between responded and nonresponded trials using equivalent
time windows relative to the test stimulus. In this MU, activity was also related to resume-release (Fig. 3 F, G). Figure 3G compares firing rate aligned to lever release in two different contexts: the dashed line for release to report AM discrimination “reportrelease” and the removed second and solid line for resumerelease. Only at the 28% depth were there ⱖ5 trials for both conditions. We calculated CP by comparing firing rate between report-release and resume-release using the 200 ms window before lever release and found no significant difference (CP ⫽ 0.550, p ⫽ 0.331). Figure 3 shows that this MU increased firing before lever release for both conditions at a similar magnitude despite the difference in context. CP analysis revealed that an ideal observer could predict the animal’s lever release 76.5% and 75.9% of the time for reportrelease and resume-release, respectively, based solely on observing this MUs firing rate 200 ms before release (grand CPs of 0.765 and 0.759 for report- and resume-release for this MU, respectively). Both were significantly greater than the chance value of 0.5 (permutation test p ⫽ 0.003 and p ⫽ 0.001, respectively). For ML and A1, the mean population grand CP during the 200 ms before lever release was significantly greater than the chance value of 0.5 for MUs and SUs (Fig. 4A–D, G–J, Table 4). In ML, many units significantly increased activity before report-release (41% of MUs and 20% of SUs) and a larger percentage of units significantly increased firing before resume-release (Fig. 4, Table 3). The percentages were slightly higher in A1. Although the majority of ML units with increased firing before report-release also increased firing before resume-release, a smaller percentage of ML than A1 units increased activity before both report-release and resume-release, although this effect did not reach significance when tested over the entire population of units (e.g., n ⫽ 61 MUs in ML; 2 proportion test p ⫽ 0.059 for MUs and p ⫽ 0.219 for SUs). We found that reward-expectation could not be the sole source of report-release CP by aligning the time windows to the time of expected reward (see Materials and Methods, “Reportrelease CP factoring out reward-anticipation effects”). The logic is that if reward expectation causes the report-release CP, then nonrelease trials aligned to the time of expected reward should result in CP values of 0.5. The firing rate 400 ms before reportrelease was significantly greater than the rate 400 ms before the end of the response window in the nonresponded trials (when reward is expected). Furthermore, in ML, but not A1, rewardaligned CP was stronger than stimulus-aligned CP, arguing further against reward effects (Table 4). This result suggests that the increased firing before report-release is not solely due to reward expectation. ML firing rate evoked during the sound sequence correlates with the animals’ choice Choice-related activity was not observed during the standard sound, but was observed during the ISI and target sound. During the 800 ms standard (first) sound, ML’s population-average CP was 0.499 for MUs and 0.503 for SUs, neither significantly different from 0.5. Significant effects also were not found when the standard was divided into first and second halves (Table 4). This does not support a relationship between firing rate during the standard sound and the animals’ choice made later in the trial. During the 400 ms ISI period, choice-related activity was observed (Fig. 5 A, B, Table 4). Individually, 10 of 66 (15.2%) MUs and 10 of 123 (8.13%) SUs significantly increased firing rate during the ISI period (permutation test p ⬍ 0.05). This suggests that neural activity before the test stimulus may directly influence the
Niwa et al. • AM and Choice-Related Activity in A1 and ML
Figure 3. A, Raster plot of a MU response in ML to 5 Hz AM as modulation depth is varied from 0% (bottom) to 100% (top). The test stimulus is presented from time 0 to 800 ms. B, C, Trials in A sorted into responded (B) and nonresponded (C) trials. In B, activity is shown only for trials in which the monkey released the lever to report modulation. In B, there are more trials at higher modulation depths because, at these depths, modulation was easier to detect. The heavy vertical dashed line at time 0 is the time of lever release to which the activity in B is aligned. For each depth, trials are sorted by the animal’s RT. The top raster at each depth is for the shortest RT and the bottom is for the longest, causing the rightward upward slope for activity at each depth. Dark lines represent test stimulus onset and offset, which is also slanted because of the RT sorting. In C, activity is shown for trials in which the animal did not report modulation. Because there was no lever release in this condition, activity is aligned to the stimulus as in A. D, average firing rate is shown for 28% depth for responded (dark dashed line) and nonresponded trials (light solid line) trials and aligned to test stimulus onset (time 0). Only 28% depth is shown because that was the only depth with sufficient numbers of responded and nonresponded trials (ⱖ5 each) to be included in the analysis. Note the average increase in activity beginning at time ⬃1000 ms, 200 ms after offset. E, Same as D, but aligned to RT (time 0) for responded trials. For nonresponded trials, the plot is aligned to (time 0) the average RT obtained from responded trials at the same depth. Note the increase in activity before response on responded trials. In D and E, the firing rate is in spikes per second calculated in 50 ms bins. F, Activity aligned to resume-release after a miss trial. Releasing the lever is allowed after a light cue and then the animal must release the lever so it can depress it again to start a new trial. G, Plots of average firing rate for report-release (dashed-line) and resume-release (solid line) at 28% depths in which there were enough (ⱖ5) trials for each condition.
J. Neurosci., May 8, 2013 • 33(19):8378 – 8395 • 8385
choice made later in the trial. An alternative interpretation is that firing rate during the ISI may increase due to a higher level of generalized attention or arousal in those trials in which animals would later report AM detection. In ML, during the first half of the test stimulus, the average CP across all neurons was not ⬎0.5 (Fig. 5C,D), but during the second half, it was (Fig. 5 E, F ); this differs from A1, in which CP averaged across all neurons was ⬎0.5 for both halves of the test stimulus (Table 4). Individually in ML, 8 of 66 (12.1%) MUs and 17 of 123 (13.8%) SUs significantly increased firing rate during the second half of the test stimulus period in responded trials compared with nonresponded trials (permutation test p ⬍ 0.05). These results suggest that the relationship between population average firing rate and choice strengthens from the first half of the test stimulus to the second or that the effect was at least partially masked during the first half due to responses solely based on the acoustic features of the stimulus. In contrast, in A1, CP during the first and second halves of the test stimulus was not significantly different (Niwa et al., 2012a). Neurons that tended to have significant CP in one direction during one half of the stimulus tended to have CP in the same direction during the other half of the stimulus. Increasing neurons that had significant CP ⬎0.5 in the first half were more likely to have significant CP ⬎0.5 in the second half than the distribution of CP for the population predicts ( p ⫽ 0.025; Fig. 5G). Decreasing neurons that had significant CP ⬍0.5 in the first half were likely to have significant CP ⬍0.5 in the second half than the distribution of CP for the population predicts ( p ⫽ 0.052; Fig. 5G). Conversely (Fig. 5H ), neurons that had significant CP ⬎0.5 in the second half were more likely to have significant CP ⬎0.5 in the first half than the distribution of CP for the population predicts ( p ⫽ 0.026) and vice versa ( p ⫽ 0.0498). These results suggests that neurons with significant CP tend not to switch sign (e.g., increasing to decreasing) during the stimulus. The change in the magnitude of choice-correlated firing over the time course of a single trial is shown by comparing the cumulative spike counts for responded and nonresponded trials in Figure 6A for MUs and Figure 6B for SUs. The cumulative spike counts during the standard show no difference between responded and nonresponded trials. The cumulative spike count started to diverge
8386 • J. Neurosci., May 8, 2013 • 33(19):8378 – 8395
Niwa et al. • AM and Choice-Related Activity in A1 and ML
Figure 4. A, B, Histograms of grand CP values based on firing rate during the 200 ms time window before animals’ behavioral response (report-release) for MUs (A) and SUs (B) in ML. C, D, Histograms of grand CP based on firing rate during the 200 ms window before resume-release compared with spontaneous activity for MUs (C) and SUs (D) in ML. E, Venn diagram showing the number of MUs having significant report-release CP (left circle), significant resume-release CP (right circle), and both report-release and resume-release activity (intersection) for ML. The size of the circles reflects the proportion of units with significant release-related activity. F, Same as E but for SUs. G–L, Same as A–F but for A1 rather than ML. All p values (A–D, G–J ) are based on a t test. Nothing changed qualitatively and the same conditions were significant or not significant when monkey V was excluded (we did not record from ML in monkey V).
slightly during the ISI, continued diverging through the test stimulus, and showed larger splits before report-release, as shown by the results from the CP analyses described above. Relationship between unit CPs and their discriminability of AM The ability of neurons to discriminate AM was correlated with their CP values, particularly later in trials, suggesting that AMsensitive neurons were also engaged in choice-related activity. We investigated whether ML cells that are better at discriminating AM have higher CPs by using ROC area to determine a cell’s ability to discriminate AM from unmodulated noise based on firing rate (see Materials and Methods). We then performed a
Spearman’s correlation test using each neuron’s grand CP and ROC area values to examine the relationship between a neuron’s ability to discriminate AM and its CP. Significant positive correlations were found between neural AM sensitivity (ROC area) and grand CP in the 400 ms window before report-release for both MUs and SUs (Fig. 7). In contrast, there was no significant correlation between units’ AM discriminability and grand CP in ML during the ISI period, the first or second half of the test stimulus, nor before resume-release (Fig. 7A). This result indicates that, in ML, although the population mean CPs during the ISI period and the second half of the test stimulus were significantly greater than chance, the choice-related activity during these periods was not more selective for AM-sensitive neurons.
Niwa et al. • AM and Choice-Related Activity in A1 and ML
J. Neurosci., May 8, 2013 • 33(19):8378 – 8395 • 8387
Table 4. Population mean CPs for MUs and SUs in A1 and ML for different time periods during a single trial First half standarda Second half standardb Duration (ms) A1 MUs ML MUs A1 SUs ML SUs
400 0.505 0.500 0.505 0.506
400 0.510 0.501 0.503 0.502
ISIc 400 0.514* 0.515* 0.510* 0.513*
First half test stimulusd Second half test stimuluse Report-releasef Prerewardg Resume-releaseh Report-releasei 400 0.518* 0.498 0.507 0.494
400 0.527* 0.522* 0.509* 0.514*
400 0.584* 0.548* 0.539* 0.514*
400 0.567* 0.613* 0.531* 0.560*
200 0.604* 0.589* 0.546* 0.546*
200 0.599* 0.557* 0.537* 0.515*
Population mean CPs that are significantly different from chance value of 0.5 ( p ⬍ 0.05 by t test) are designated with an asterisk (*). a CP values during the first half of the standard stimulus. b CP values during the second half of the standard stimulus. c CP values during the ISI. d CP values during the first half of the test stimulus. e CP values during the second half of the test stimulus. f CP values 400 ms prior to report release with nonrelease trials aligned to RT. g CP values 400 prior to report release with nonrelease trials aligned to the end of the 800 ms response window. h CP values 200 ms prior to resume release. i CP values 200 ms prior to report release with nonrelease trials aligned to RT.
However, the choice-related activity just before report release was more selective for AM-sensitive neurons, suggesting that feedback targets these neurons or that these neurons are targeted for informing the decision on whether the sound is modulated. In A1, we found a significant, positive correlation between units’ AM discriminability and grand CPs during the second half of the test stimulus and during the 400 ms before report-release (Fig. 7B). There was no significant correlation between units’ AM discriminability and grand CPs during the ISI period or during the first half of the test stimulus. These results show that, for both ML and A1, there was a significant correlation between AM discriminability and the size of CP for activity during later time periods in a single trial, suggesting that selective targeting of AM sensitive neurons by higher cortical areas (related to attention, decision, or some other feedback signal) takes place over time. However, this targeting process may occur earlier in A1 compared with ML, because a significant correlation with AM discriminability and CP appeared during the second half of the test stimulus in A1, but not in ML. This result also suggests that the increased activity before report-release, possibly related to the animals’ motor action, is not randomly distributed over ML and A1 neurons, but rather is stronger in neurons that are more likely used in AM detection, suggesting a learned association between the AM stimulus and task-related nonauditory events. Response category breakdown In the next three subsections, we analyze how increasing, decreasing, synchronized, and nonsynchronized responses convey information about the animal’s choice. Because interpreting how the brain might decode choice-related activity depends on the ability of neurons at higher stages to segregate activity by response type, we performed three different analyses. The simplest assumption is that the brain cannot analyze according to response type and just sums or pools activity (firing rate) across all neurons. This is what the analyses shown in Figure 4, Figure 5, and Figure 6 assume. We also cover three possibilities (one per section) of how higher areas could use information based on response type. First, we analyzed increasing and decreasing functions independently of synchronization type (Fig. 8). This assumes that the brain can separately analyze (or compare) increasing and decreasing responses, but does not parse synchronized from nonsynchronized responses. Then we analyzed synchronized and nonsynchronized responses independently of whether the activity increased or decreased for modulated sounds. This assumes that the brain can
separately analyze synchronized and nonsynchronized units, but does not parse according to increasing or decreasing rate (Fig. 9). Finally, we combined the two analyses based on the assumption that the brain can separately analyze or compare by both increasing/decreasing and synchronization type codes (Fig. 10). Increasing and decreasing responses In ML, some neurons at a given modulation frequency increased their firing rate with increasing modulation depth (“increasing” responses), whereas others decreased their firing rate with increasing depth (“decreasing” responses). We found that increasing responses had significant CP, but decreasing responses did not (Fig. 8). In this analysis, increasing units and decreasing units included both synchronized and nonsynchronized responses. In theory, increasing and decreasing responses can carry separate information about AM discrimination as long as the brain uses appropriate decoding methods to separately analyze the two types of responses. A difference between ML and A1 is that a larger proportion of “decreasing” units were found in ML than in A1 (Table 2). To investigate the possible different roles of increasing and decreasing response functions in the AM task, we examined CPs separately for increasing and decreasing depth-response functions. If decreasing functions are signaling AM, and if this decreased activity drives the choice, we would expect “decreasing” units to have CP ⬍0.5. Conversely, if the decision is based upon a net aggregate increase in activity by summing over all of ML, CP should be ⬎0.5 for both increasing and decreasing units. Our results suggest that ML units with increasing depthresponse functions predict the animals’ choices with increases in activity. Activity was higher in responded than nonresponded trials in all time periods for ML units with increasing depthresponse functions (Fig. 8 A, C). Significance as measured by the population mean CP was significantly greater than chance during the ISI, the second half of the test stimulus, and 400 ms before report-release, but not during the first half of the test stimulus. However, something different occurred for ML units with decreasing depth-response functions. Although none of the population mean CP values differed significantly from 0.5, the population mean CP was ⬍0.5 for the first half of the stimulus and ⬎0.5 for all other time periods (gray lines in Fig. 8 A, C). One possible explanation is that units with decreasing depth-response functions predict animals’ choices with decreases in activity early in the stimulus, but with increases later in the stimulus. The early decreases potentially reflect stimulus processing, whereas the
Niwa et al. • AM and Choice-Related Activity in A1 and ML
8388 • J. Neurosci., May 8, 2013 • 33(19):8378 – 8395
later increases in activity might be related to decisions or motor planning. (This result will take on more meaning later when decreasing responses are divided by synchronized and nonsynchronized responses and CP ⬍0.5 reaches significance). CP for decreasing responses in A1 was dissimilar to ML, whereas CP for increasing responses was similar. Although the shape of the curves for A1 are similar to ML in Figure 8, A1 CPs were significant in more time periods (Fig. 8 B, D). Unlike ML, A1 units with decreasing functions were as active or more active on responded than nonresponded trials (CP ⬎0.5) for all periods; however, these effects did not reach significance. Although the lower number of decreasing responses might contribute to the absence of significant CP in A1, the population mean CP of increasing responses was consistently higher than that of decreasing responses (Fig. 8 B, D). Another difference between A1 and ML is that, in A1, the shape of the average CP versus time function was similar for increasing and decreasing units; in ML, the shapes were dissimilar (Fig. 8). For this analysis, which ignores whether neurons are synchronized or nonsynchronized, these findings support the idea that the firing rate of “increasing units” is more predictive of animals’ behavior than “decreasing units” in both areas. Synchronizing versus nonsynchronizing responses Some A1 responses encode AM by phase locking (synchronized responses), which often is accompanied by a change in firing rate. Others encode AM by changing firing rate without phase locking (nonsynchronized responses; Lu et al., 2001). As the auditory system is ascended, the maximum modulation frequency to which neurons can phase lock decreases and nonsynchronized responses become more prominent. Therefore, nonsynchronized responses may reflect coding at a more 4
Figure 5. A, B, Histograms of grand CP based on firing rate during the silent 400 ms period before the test stimulus (ISI) for MUs (A) and SUs (B). C, D, Histograms of grand CP based on firing rate during the first half of the test stimulus for MUs (C) and SUs (D). E, F, Same as C, D but for the second half of the test stimulus. G, 2 ⫻ 2 table comprised of neurons with significant CP (either increasing or decreasing) during the first half of the stimulus. Each quadrant shows the percentage of cells with significant CP
(separately looking at increasing or decreasing) in the second half. The upper left quadrant shows the percentage of responses with significantly increasing CP (⬎0.5) in the first half that also had significantly increasing CP in the second half. The lower left quadrant shows the percentage of responses with significantly increasing CP (⬎0.5) in the first half that had significantly decreasing CP (⬍0.5) in the second half, etc. H, Converse of E comprised of units with significant CP during the second half of the stimulus reporting how they responded during the first half. For G and H, a binomial test was used to compare the probability of finding significant CP under each table condition with the overall probability of finding significant CP.
Niwa et al. • AM and Choice-Related Activity in A1 and ML
J. Neurosci., May 8, 2013 • 33(19):8378 – 8395 • 8389
during the second half and 400 ms before report-release for SUs. For A1 nonsynchronized responses, the average CP was always greater than for synchronized responses, but was less likely to deviate significantly from 0.5 (Fig. 9 B, D). The population mean CP for nonsynchronizing A1 responses was significantly greater than chance— only 400 ms before report-release for both MUs and SUs. In A1, the lower number of nonsynchronizing neurons may be the reason why the population mean CP for these responses was not significantly different from 0.5, even though the CP values were consistently higher than those for synchronizing neurons (Fig. 9 B, D). The fact that the population mean CP of nonsynchronized responses in A1 was consistently higher than that for synchronized responses suggests the firing rate of nonsynchronized responses is at least as important as the synchronized responses in predicting animals’ choice behavior.
Figure 6. A, B, Population mean cumulative spike count during the entire trial for “responded” (black dashed line) and “nonresponded” (gray solid) trials for MUs (A) and SUs (B). The population includes units in the top 50 th percentile of rate-based AM discriminability (ROC areas averaged across all depths). Trials are broken down into the standard sound, ISI, test stimulus, and poststimulus periods. The plots are shifted down at the start of the ISI, test stimulus, and poststimulus periods so that differences between responded and nonresponded trials can be better seen.
highly processed stage and have a special role in the perception of temporal modulation (Lu et al., 2001; Liang et al., 2002; Bartlett and Wang, 2007; Bendor and Wang, 2007). Here we examined whether the magnitude of choice-correlated activity differs between synchronized and nonsynchronized responses. In nonsynchronized ML neurons, significant decreases in CP (decreased activity for trials where the subjects reported AM compared with trials where they did not) during the first half of the stimulus were strong, whereas for synchronized units, CP was ⬎0.5 during all time epochs (Fig. 9). For these analyses, we collapsed across all neurons whether their responses increased or decreased to AM. For synchronized responses in ML, the population mean CPs were significantly greater than chance (0.5) during the ISI, the second half of the test stimulus, and before report-release for MUs, but only before report-release for SUs (Fig. 9 A, C). For nonsynchronized responses in ML, significant increases in activity only occurred before report-release for MUs. (Lack of statistical power due to the smaller number of neurons with nonsynchronized responses might contribute to the lack of significance for some epochs.) The nonsynchronized ML responses showed an effect different from anything seen in A1. The nonsynchronized ML units significantly decreased activity during the first half of the test stimulus in trials in which AM was reported compared with trials in which it was not (Fig. 9C, note that CP ⬍0.5 indicates decreased activity on responded vs nonresponded trials). This will be described in more detail when we divide nonsynchronized responses into increasing and decreasing categories (Fig. 10). For A1 synchronized responses, the population mean CPs were significantly greater than chance for all periods for MUs and
Synchronization and slope of depth function We further analyzed population mean CPs to investigate a possible interaction between the two variables: response type (synchronizing vs nonsynchronizing) and slope of the firing rate versus depth function (increasing vs decreasing). The overall conclusions are that increasing responses are the major carrier of choice-related activity in both ML and A1 regardless of whether they synchronize, with the exception to this being nonsynchronized decreasing responses, which carry choice-related decreases in activity. For increasing, synchronized responses in ML (Fig. 10 A, C, green, dotted lines), significant population mean CPs were found during the ISI, the second half of the test stimulus (MUs only), and before report-release. In A1, increasing, synchronized responses (Fig. 10 B, D, green, dotted plots) showed significant CP during all the epochs for MUs, during the second half of the test stimulus, and before report-release for SUs. For increasing, nonsynchronizing responses in ML (Fig. 10 A, C), significant population mean CPs were found during the second half of the test stimulus (SUs only) and before report-release. For increasing, nonsynchronizing responses in A1 (Fig. 10 B, D), significant CP was found during the ISI (SUs only) and before reportrelease. Conversely, for decreasing responses, no significant population mean CP ⬎0.5 was found during any time period. In ML, a significant decrease (CP ⬍0.5) was found for decreasing nonsynchronizing functions, although only for SUs (Fig. 10C, magenta line). These results indicate that, in both ML and A1, choice-correlated increases in activity are carried by increasing responses regardless of whether they synchronize to AM, except during the first half of the test stimulus. Dependence of CP on BF, BMF, and topography Correlation analysis revealed that CP tends to increase with decreasing BF. Even though A1 and r values are tonotopically organized, no topographical relationship to CP was evident. Correlation analyses between CP and recording location in the anterior–posterior and medial-lateral axes (Pearson’s correlations done separately for each monkey) were inconclusive. This was at least partially due to a need to reimplant recording cylinders in two animals, and we were unable to align the two grid placements with confidence. Because the techniques used are not ideal for analyzing topography, this negative result should not be taken as strong evidence that there is no topography. However, we also calculated Spearman’s correlation coefficients for BF versus CP, which showed a tendency for higher CP values for cells with lower BFs, particularly later in the trial in ML. In ML, during the second half of the test stimulus and before
8390 • J. Neurosci., May 8, 2013 • 33(19):8378 – 8395
Niwa et al. • AM and Choice-Related Activity in A1 and ML
Figure 7. A, B, Correlation between units’ CP and AM discriminability. Spearman’s correlation test r values are plotted from the ISI period, the first and the second half of the test stimulus, the 400 ms period before report-release and before resume-release for MUs (open circles) and SUs (solid squares) in ML (A) and in A1 (B). Asterisks (*) denote significant r values. Nothing changed qualitatively, but the correlation between CP and AM discriminability in A1 reached significance during the ISI when monkey V was excluded (we did not record from ML in monkey V).
resume-release, there was a significant negative correlation (higher CPs for lower BFs) for MUs (r ⫽ ⫺0.32 and ⫺0.33, respectively). For SUs, significance was reached before resume release (r ⫽ ⫺0.26), but not during the second half of the stimulus (r ⫽ ⫺0.17, p ⫽ 0.098). For report release, r values were negative for MUs and SUs (⫺0.24 and ⫺0.16, respectively), but were not significant ( p ⫽ 0.072 and p ⫽ 0.123, respectively). In
A1, no significant correlation between BF and CP was found except for resume-release (r ⫽ ⫺0.26) for SUs. These results suggest that, in ML, CP might be stronger in cells with lower BFs. We also investigated whether CP and BMF were significantly correlated. This involved breaking down the data by BMF type (BMFSC or BMFVS) for each time period (ISI, first half, second half, report release) by area (A1 and ML) and by unit type (MU
Niwa et al. • AM and Choice-Related Activity in A1 and ML
J. Neurosci., May 8, 2013 • 33(19):8378 – 8395 • 8391
Figure 8. A–D, Progression of population mean grand CP over a single trial are shown separately for “increasing” (black traces) and “decreasing” (gray traces) firing rate versus depth functions for MUs in ML (A) and in A1 (B) and for SUs in ML (C) and in A1 (D). Note that responses are not segregated by synchronized/nonsynchronized response type in this figure; therefore, each plot includes both synchronizing and nonsynchronizing units in the grand CP values. Asterisks (*) denote distribution means that are significantly greater than chance (0.5) by t test. Nothing changed qualitatively and the same conditions were significant or not significant when monkey V was excluded (we did not record from ML in monkey V).
and SU). We repeated the analysis further breaking the data down by response type (increasing or decreasing). We also repeated this analysis for ␦BMF (the difference between BMFSC and BMFVS in octaves). Of all of these comparisons, only three reached significance. This leads us to conclude that there is no relationship, or only a weak one, between CP and BMF. Strength of phase locking is not correlated with the animal’s choice We also examined whether neurons phase lock to AM more strongly when animals report AM compared with trials when they do not. VSPP was used as a measure of phase locking, and CP analysis was performed using VSPP. We found that in ML, the population mean grand CP based on VSPP during the stimulus period (80 – 800 ms) was not significantly different from chance (mean CP ⫽ 0.498, p ⫽ 0.733 for all MUs and mean CP ⫽ 0.506, p ⫽ 0.314 for all SUs). We found a similar result in A1, in which the population mean grand CP was also not significantly different from chance (mean CP ⫽ 0.495, p ⫽ 0.235 for all MUs and mean CP ⫽ 0.499, p ⫽ 0.747 for all SUs).
Discussion Based on earlier visual system studies, we would expect that with ascension of the cortical hierarchy, CP values would increase. However, in auditory cortex, we found different results indicating that when ascending the auditory system, there is a transfor-
mation in AM coding from primarily synchronized “increasing” responses in A1 to nonsynchronized and dual (“increasing”/“decreasing”) coding in ML. Furthermore, this sensory transformation is accompanied by changes in the timing of activity related to choice. The various types of responses (synchronized increasing, synchronized decreasing, nonsynchronized increasing, and nonsynchronized decreasing) manifested these timing changes differently, suggesting functional specialization by response type. These results suggest functional differences between A1 and ML related to sensory coding, attention, and/or behavior. Comparison with other sensory systems Romo et al. (1998) presented somatosensory cortical data that share similarities with our auditory cortical data. They trained monkeys to discriminate tactile stimulis flutter frequency (⬃5–50 Hz) by reporting whether a second stimulus’s frequency was higher than that of the first by pressing one of two buttons (Romo et al., 1998, 2003; Herna´ndez et al., 2000, 2002; Salinas et al., 2000; Brody et al., 2002; Romo et al., 2002; Luna et al., 2005; Herna´ndez et al., 2010). First, primary somatosensory cortical (S1) neurons primarily increased firing rate with flutter frequency, whereas secondary somatosensory cortical (S2) neurons had a dual code, increasing or decreasing rate with flutter frequency (Table 2). Second, S1 neurons phase locked to flutter frequency, whereas S2 neurons did not (ML neurons phase lock, but worse than A1 neurons).
8392 • J. Neurosci., May 8, 2013 • 33(19):8378 – 8395
Niwa et al. • AM and Choice-Related Activity in A1 and ML
Figure 9. A–D, Progression of population mean grand CP over a single-trial are shown separately for “nonsynchronizing” (gray, solid traces) and “synchronizing” responses (black, dotted traces) for MUs in ML (A) and in A1 (B) and for SUs in ML (C) and in A1 (D). Note that responses are not segregated by increasing or decreasing response type in this figure; therefore, each plot includes both increasing and decreasing responses in the grand CP values. Asterisks (*) denote that distribution means are significantly greater than chance (0.5) by t test. The same conditions were significant or not significant when monkey V was excluded (we did not record from ML in monkey V).
S2 and ML also shared similarities with respect to CP. S2 neurons showed a relationship to choice later, but not earlier, in the test stimulus (Romo et al., 2002), and decreasing units appear to encode choices differently than increasing units (Romo et al., 2002; Chow et al., 2009). In addition, firing rate, but not phase locking, resulted in significant CP in S1 and S2 (Salinas et al., 2000). However, some of our results differ from other sensory systems. CP values were higher in S2 than S1, and S2 CP values were higher than our ML values (Romo et al., 2002; Lemus et al., 2010). Further, in the visual system, Nienborg and Cumming (2006) used a common task to compare V1 and V2 and found that CP was not significant in V1 but was in V2. Although the somatosensory and visual results support an increase in strength of correlation between neural activity and choice along sensory hierarchical pathways, we did not observe this from A1 to ML. Our A1/ML differences were more related to CP time course without large differences in overall CP magnitude. Is ML a higher processing station than A1? At first glance, CP in A1 and ML seems similar. In both areas, population CP is significant during the ISI, test, pre-reportrelease, and pre-resume-release periods. When averaging over the entire neuronal population, similarities outweigh the differences in the two areas.
However, when the activity is broken down by response type with finer time analysis, differences between A1 and ML appear. Significant CP in A1 begins during the ISI and increases slightly during the stimulus; in ML, significant CP starts during the ISI, but disappears during the first and reappears during the second half of the stimulus. This suggests that, in ML, early in the stimulus something different occurs (e.g., a dual code in which decreasing nonsynchronized responses help to inform the decision and/or masking of an attention effect by responses to the acoustic stimulus features). Another simple explanation is that decision-related and/or motor-related activity is fed back to auditory cortex. In ML, other processes drive neuronal activity that eliminates or masks the choice-related feedback early in the stimulus, but later, choice or action-related inputs to ML come to the forefront. Another parsimonious explanation is that a constant incremental effect of attention or arousal is operating from the onset of the ISI through report-release and that this was masked during the first 400 ms of the test sound. Are nonsynchronized responses special? Another interpretation takes into account the higher prevalence in ML than A1 of responses that encode AM with activity decreases, particularly nonsynchronized decreasing responses (Table 2). An important consideration, which will be discussed later,
Niwa et al. • AM and Choice-Related Activity in A1 and ML
J. Neurosci., May 8, 2013 • 33(19):8378 – 8395 • 8393
Figure 10. A–D, Progression of population mean grand CP over a single trial are shown separately for “increasing, nonsynchronizing” (purple, solid traces), “increasing, synchronizing” (green, dotted traces), “decreasing, nonsynchronizing” (magenta, solid traces), and “decreasing, synchronizing” responses (orange, dotted traces) for MUs in ML (A) and in A1 (B) and for SUs in ML (C) and in A1 (D). Asterisks (*) denote that distribution means are significantly greater than chance (0.5) by t test. When monkey V was excluded, nothing changed qualitatively (we did not record from ML in monkey V). However, for increasing nonsynchronized neurons in A1 (D, purple solid), CP did not reach significance during the ISI ( p ⫽ 0.056) when monkey V was excluded.
is whether the A1/ML differences are predominantly caused by the emergence of these ML decreasing neurons or if other neurons have different properties in the two areas. Nonsynchronized responses may play a special role in processing temporally modulated sounds because they result from a temporal to rate code transformation with auditory system ascension (Lu et al., 2001; Bendor and Wang, 2007). The higher proportion of nonsynchronized neurons in ML than A1 (Table 2) supports this idea. Interestingly, this difference is mainly due to more decreasing nonsynchronized responses in ML; the proportion of nonsynchronized responses that increase activity with AM depth is similar in both areas. The notion that both decreasing and increasing firing rates contribute to sensory discrimination, with the brain analyzing differences in activity between the two populations of neurons, has been postulated to operate in the auditory (McAlpine et al., 2001; Grothe et al., 2010; Johnson et al., 2012) and other sensory systems (Schiller et al., 1986; Newsome et al., 1989; Gold and Shadlen, 2001; Romo et al., 2003; Machens et al., 2005). Under this scheme, decreasing nonsynchronized responses might play a large role in sensory processing, but a lesser role in (or receive less feedback related to) decisionrelated and task-related motor activity. This could explain why decreasing nonsynchronized responses in ML were significantly less active on responded trials during the first half of the test
stimulus, but during all other epochs did not exhibit significant CP and why increasing nonsynchronized ML responses’ CP became significantly ⬎0.5 later during the test stimulus. Accordingly, sensory processing occurs early in the stimulus and decreased activity in the decreasing nonsynchronized responses might be interpreted by higher areas as evidence of a modulated sound. Then later (possibly during the second half of the stimulus), when sensory processing is nearly completed, decisionrelated and motor-related activity is more prevalent, although not carried by the decreasing nonsynchronized responses. The explanation above assumes that ML uses both increasing and decreasing activity in a complementary AM code, whereas A1 does not. It also assumes that decreasing nonsynchronized neurons’ activity is used at higher levels to drive the decision. Our data also suggest that ML increasing nonsynchronized neurons are more influenced by, or involved in, the decision and/or motor planning process because CP is significant during the second half for increasing (but not decreasing) nonsynchronized ML responses (Fig. 10C). This suggests that increasing nonsynchronized responses fall into two categories: one involved in sensory processing and one involved in, or reflecting, decisions/motor processes. Such relationships are not observed for A1 nonsynchronized neurons, suggesting that hierarchical processing contributes to ML nonsynchronized response properties. So,
8394 • J. Neurosci., May 8, 2013 • 33(19):8378 – 8395
although A1 and ML increasing synchronized responses have similar CP (Fig. 10), the differences between A1 and ML are not solely due to a smaller percentage of increasing synchronized responses in ML—the different properties of nonsynchronizing responses in the two areas also contribute. Relationship to CP in prefrontal cortex Tsunada et al. (2011) reported that 14% of anterior–lateral auditory cortex neurons had significant CP, but no significant population CP for monkeys’ reporting whether two morphed words belonged to the same or different categories (the words “bad” or “dad”). In another categorization task, they reported large, significant CP in ventral prefrontal cortex (Russ et al., 2008). Although experimental differences can contribute to identifying CP (Niwa et al., 2012a), our results are consistent with the interpretation by Tsunada et al. (2011) that auditory cortex provides sensory evidence (in our case, about AM) to form a decision and ventral prefrontal cortex activity encodes the decision process output (in Tsunada et al., about which category a sound belonged). Modification of auditory cortex by behavioral meaning Somatosensory influences have been reported in auditory cortex with strong effects caudomedially that become less pronounced with anterior lateral progression (Schroeder et al., 2001; Schroeder and Foxe, 2002; Fu et al., 2003). Motor and other sensory modalities can modulate concurrent auditory responses (Fu et al., 2003; Werner-Reiss et al., 2003; Ghazanfar et al., 2005; Pekkola et al., 2005; Lakatos et al., 2007; Kayser et al., 2008, 2009; Lakatos et al., 2009; Kayser et al., 2010). However, crossmodal influences extend beyond modulation of auditory responses; visual and somatosensory inputs can drive single A1 neurons directly in the absence of sound (Brosch et al., 2005; Bizley et al., 2007; Yin et al., 2008; Bizley and King, 2009; Lemus et al., 2010). We also observed nonauditory events independently driving A1 and ML neurons. Auditory cortical neurons might not only represent physical sound properties, but also a sound’s meaning relative to a behavioral task, such as a sound’s association with another stimulus or a reward associated with the sound (Scheich et al., 2011). Our results further support that auditory cortical neurons not only encode behaviorally relevant stimulus parameters, but also represent nonauditory task contingencies required for solving a given auditory perceptual task.
References Barlow HB, Kaushal TP, Hawken M, Parker AJ (1987) Human contrast discrimination and the threshold of cortical neurons. J Opt Soc Am A 4:2366 –2371. CrossRef Medline Bartlett EL, Wang X (2007) Neural representations of temporally modulated signals in the auditory thalamus of awake primates. J Neurophysiol 97:1005–1017. CrossRef Medline Bendor D, Wang X (2007) Differential neural coding of acoustic flutter within primate auditory cortex. Nat Neurosci 10:763–771. CrossRef Medline Bizley JK, King AJ (2009) Visual influences on ferret auditory cortex. Hear Res 258:55– 63. CrossRef Medline Bizley JK, Nodal FR, Bajo VM, Nelken I, King AJ (2007) Physiological and anatomical evidence for multisensory interactions in auditory cortex. Cereb Cortex 17:2172–2189. CrossRef Medline Britten KH, Shadlen MN, Newsome WT, Movshon JA (1992) The analysis of visual motion: a comparison of neuronal and psychophysical performance. J Neurosci 12:4745– 4765. Medline Britten KH, Newsome WT, Shadlen MN, Celebrini S, Movshon JA (1996) A relationship between behavioral choice and the visual responses of neurons in macaque MT. Vis Neurosci 13:87–100. CrossRef Medline Brody CD, Herna´ndez A, Zainos A, Lemus L, Romo R (2002) Analysing
Niwa et al. • AM and Choice-Related Activity in A1 and ML neuronal correlates of the comparison of two sequentially presented sensory stimuli. Philos Trans R Soc Lond B Biol Sci 357:1843–1850. CrossRef Medline Brosch M, Selezneva E, Scheich H (2005) Nonauditory events of a behavioral procedure activate auditory cortex of highly trained monkeys. J Neurosci 25:6797– 6806. CrossRef Medline Brosch M, Selezneva E, Scheich H (2011) Representation of reward feedback in primate auditory cortex. Front Syst Neurosci 5:5. CrossRef Medline Celebrini S, Newsome WT (1994) Neuronal and psychophysical sensitivity to motion signals in extrastriate area MST of the macaque monkey. J Neurosci 14:4109 – 4124. Medline Chow SS, Romo R, Brody CD (2009) Context-dependent modulation of functional connectivity: secondary somatosensory cortex to prefrontal cortex connections in two-stimulus-interval discrimination tasks. J Neurosci 29:7238 –7245. CrossRef Medline Cohen MR, Newsome WT (2009) Estimates of the contribution of single neurons to perception depend on timescale and noise correlation. J Neurosci 29:6635– 6648. CrossRef Medline Cook EP, Maunsell JH (2002) Dynamics of neuronal responses in macaque MT and VIP during motion detection. Nat Neurosci 5:985–994. CrossRef Medline de la Mothe LA, Blumell S, Kajikawa Y, Hackett TA (2006a) Cortical connections of the auditory cortex in marmoset monkeys: core and medial belt regions. J Comp Neurol 496:27–71. CrossRef Medline de la Mothe LA, Blumell S, Kajikawa Y, Hackett TA (2006b) Thalamic connections of the auditory cortex in marmoset monkeys: core and medial belt regions. J Comp Neurol 496:72–96. CrossRef Medline Dodd JV, Krug K, Cumming BG, Parker AJ (2001) Perceptually bistable three-dimensional figures evoke high choice probabilities in cortical area MT. J Neurosci 21:4809 – 4821. Medline Fu KM, Johnston TA, Shah AS, Arnold L, Smiley J, Hackett TA, Garraghty PE, Schroeder CE (2003) Auditory cortical neurons respond to somatosensory stimulation. J Neurosci 23:7510 –7515. Medline Ghazanfar AA, Maier JX, Hoffman KL, Logothetis NK (2005) Multisensory integration of dynamic faces and voices in rhesus monkey auditory cortex. J Neurosci 25:5004 –5012. CrossRef Medline Gold JI, Shadlen MN (2001) Neural computations that underlie decisions about sensory stimuli. Trends Cogn Sci 5:10 –16. CrossRef Medline Green DM, Swets JA (1974) Signal detection theory and psychophysics. New York: Krieger. Grothe B, Pecka M, McAlpine D (2010) Mechanisms of sound localization in mammals. Physiol Rev 90:983–1012. CrossRef Medline Hackett TA, Stepniewska I, Kaas JH (1998) Thalamocortical connections of the parabelt auditory cortex in macaque monkeys. J Comp Neurol 400: 271–286. CrossRef Medline Herna´ndez A, Zainos A, Romo R (2000) Neuronal correlates of sensory discrimination in the somatosensory cortex. Proc Natl Acad Sci U S A 97:6191– 6196. CrossRef Medline Herna´ndez A, Zainos A, Romo R (2002) Temporal evolution of a decisionmaking process in medial premotor cortex. Neuron 33:959 –972. CrossRef Medline Herna´ndez A, Na´cher V, Luna R, Zainos A, Lemus L, Alvarez M, Va´zquez Y, Camarillo L, Romo R (2010) Decoding a perceptual decision process across cortex. Neuron 66:300 –314. CrossRef Medline Imig TJ, Ruggero MA, Kitzes LM, Javel E, Brugge JF (1977) Organization of auditory cortex in the owl monkey (Aotus trivirgatus). J Comp Neurol 171:111–128. CrossRef Medline Johnson JS, Yin P, O’Connor KN and Sutter ML (2012) Ability of primary auditory cortical neurons to detect amplitude modulation with rate and temporal codes: neurometric analysis. J Neurophysiol. Kaas JH, Hackett TA (1999) ‘What’ and ‘where’ processing in auditory cortex [news; comment]. Nat Neurosci 2:1045–1047. CrossRef Medline Kaas JH, Hackett TA (2000) Subdivisions of auditory cortex and processing streams in primates. Proc Natl Acad Sci U S A 97:11793–11799. CrossRef Medline Kayser C, Petkov CI, Logothetis NK (2008) Visual modulation of neurons in auditory cortex. Cereb Cortex 18:1560 –1574. CrossRef Medline Kayser C, Petkov CI, Logothetis NK (2009) Multisensory interactions in primate auditory cortex: fMRI and electrophysiology. Hear Res 258:80 – 88. CrossRef Medline Kayser C, Logothetis NK, Panzeri S (2010) Visual enhancement of the in-
Niwa et al. • AM and Choice-Related Activity in A1 and ML formation representation in auditory cortex. Curr Biol 20:19 –24. CrossRef Medline Kosaki H, Hashikawa T, He J, Jones EG (1997) Tonotopic organization of auditory cortical fields delineated by parvalbumin immunoreactivity in macaque monkeys. J Comp Neurol 386:304 –316. CrossRef Medline Krug K (2004) A common neuronal code for perceptual processes in visual cortex? Comparing choice and attentional correlates in V5/MT. Philos Trans R Soc Lond B Biol Sci 359:929 –941. CrossRef Medline Kus´mierek P, Rauschecker JP (2009) Functional specialization of medial auditory belt cortex in the alert rhesus monkey. J Neurophysiol 102: 1606 –1622. CrossRef Medline Kus´mierek P, Ortiz M, Rauschecker JP (2012) Sound-identity processing in early areas of the auditory ventral stream in the macaque. J Neurophysiol 107:1123–1141. CrossRef Medline Lakatos P, Pincze Z, Fu KM, Javitt DC, Karmos G, Schroeder CE (2005) Timing of pure tone and noise-evoked responses in macaque auditory cortex. Neuroreport 16:933–937. CrossRef Medline Lakatos P, Chen CM, O’Connell MN, Mills A, Schroeder CE (2007) Neuronal oscillations and multisensory interaction in primary auditory cortex. Neuron 53:279 –292. CrossRef Medline Lakatos P, O’Connell MN, Barczak A, Mills A, Javitt DC, Schroeder CE (2009) The leading sense: supramodal control of neurophysiological context by attention. Neuron 64:419 – 430. CrossRef Medline Lemus L, Herna´ndez A, Luna R, Zainos A, Romo R (2010) Do sensory cortices process more than one sensory modality during perceptual judgments? Neuron 67:335–348. CrossRef Medline Liang L, Lu T, Wang X (2002) Neural representations of sinusoidal amplitude and frequency modulations in the primary auditory cortex of awake primates. J Neurophysiol 87:2237–2261. Medline Lu T, Liang L, Wang X (2001) Temporal and rate representations of timevarying signals in the auditory cortex of awake primates. Nat Neurosci 4:1131–1138. CrossRef Medline Luna R, Herna´ndez A, Brody CD, Romo R (2005) Neural codes for perceptual discrimination in primary somatosensory cortex. Nat Neurosci 8:1210 –1219. CrossRef Medline Machens CK, Romo R, Brody CD (2005) Flexible control of mutual inhibition: a neural model of two-interval discrimination. Science 307:1121–1124. CrossRef Medline Mardia KV and Jupp PE (2000) Directional statistics (New York: Wiley). McAlpine D, Jiang D, Palmer AR (2001) A neural code for low-frequency sound localization in mammals. Nat Neurosci 4:396 – 401. CrossRef Medline Merzenich MM, Brugge JF (1973) Representation of the cochlear partition of the superior temporal plane of the macaque monkey. Brain Res 50:275– 296. CrossRef Medline Morel A, Kaas JH (1992) Subdivisions and connections of auditory cortex in owl monkeys. J Comp Neurol 318:27– 63. CrossRef Medline Morel A, Garraghty PE, Kaas JH (1993) Tonotopic organization, architectonic fields, and connections of auditory cortex in macaque monkeys. J Comp Neurol 335:437– 459. CrossRef Medline Newsome WT, Britten KH, Movshon JA (1989) Neuronal correlates of a perceptual decision. Nature 341:52–54. CrossRef Medline Nienborg H, Cumming BG (2006) Macaque V2 neurons, but not V1 neurons, show choice-related activity. J Neurosci 26:9567–9578. CrossRef Medline Nienborg H, Cumming BG (2009) Decision-related activity in sensory neurons reflects more than a neuron’s causal effect. Nature 459:89 –92. CrossRef Medline Niwa M, Johnson JS, O’Connor KN, Sutter ML (2012a) Activity related to perceptual judgment and action in primary auditory cortex. J Neurosci 32:3193–3210. CrossRef Medline Niwa M, Johnson JS, O’Connor KN and Sutter M (2012b) Active engagement improves primary auditory cortical neurons’ ability to discriminate temporal modulation. J Neurosci Pekkola J, Ojanen V, Autti T, Ja¨a¨skela¨inen IP, Mo¨tto¨nen R, Tarkiainen A, Sams M (2005) Primary auditory cortex activation by visual speech: an fMRI study at 3 T. Neuroreport 16:125–128. CrossRef Medline Petkov CI, Kayser C, Augath M, Logothetis NK (2006) Functional imaging reveals numerous fields in the monkey auditory cortex. PLoS Biol 4:e215. CrossRef Medline
J. Neurosci., May 8, 2013 • 33(19):8378 – 8395 • 8395 Rauschecker JP (1997) Processing of complex sounds in the auditory cortex of cat, monkey, and man. Acta Otolaryngol Suppl 532:34 –38. Medline Rauschecker JP, Tian B (2004) Processing of band-passed noise in the lateral auditory belt cortex of the rhesus monkey. J Neurophysiol 91:2578 –2589. CrossRef Medline Rauschecker JP, Tian B, Hauser M (1995) Processing of complex sounds in the macaque nonprimary auditory cortex. Science 268:111–114. CrossRef Medline Recanzone GH, Guard DC, Phan ML (2000) Frequency and intensity response properties of single neurons in the auditory cortex of the behaving macaque monkey. J Neurophysiol 83:2315–2331. Medline Romanski LM, Tian B, Fritz J, Mishkin M, Goldman-Rakic PS, Rauschecker JP (1999) Dual streams of auditory afferents target multiple domains in the primate prefrontal cortex [see comments]. Nat Neurosci 2:1131–1136. CrossRef Medline Romo R, Herna´ndez A, Zainos A, Salinas E (1998) Somatosensory discrimination based on cortical microstimulation. Nature 392:387–390. CrossRef Medline Romo R, Herna´ndez A, Zainos A, Lemus L, Brody CD (2002) Neuronal correlates of decision-making in secondary somatosensory cortex. Nat Neurosci 5:1217–1225. CrossRef Medline Romo R, Herna´ndez A, Zainos A, Salinas E (2003) Correlated neuronal discharges that increase coding efficiency during perceptual discrimination. Neuron 38:649 – 657. CrossRef Medline Russ BE, Ackelson AL, Baker AE, Cohen YE (2008) Coding of auditorystimulus identity in the auditory non-spatial processing stream. J Neurophysiol 99:87–95. CrossRef Medline Salinas E, Herna´ndez A, Zainos A, Romo R (2000) Periodicity and firing rate as candidate neural codes for the frequency of vibrotactile stimuli. J Neurosci 20:5503–5515. Medline Scheich H, Brechmann A, Brosch M, Budinger E, Ohl FW, Selezneva E, Stark H, Tischmeyer W, Wetzel W (2011) Behavioral semantics of learning and crossmodal processing in auditory cortex: the semantic processor concept. Hear Res 271:3–15. CrossRef Medline Schiller PH, Sandell JH, Maunsell JH (1986) Functions of the on and Off Channels of the Visual-System. Nature 322:824 – 825. CrossRef Medline Schroeder CE, Foxe JJ (2002) The timing and laminar profile of converging inputs to multisensory areas of the macaque neocortex. Brain Res Cogn Brain Res 14:187–198. CrossRef Medline Schroeder CE, Lindsley RW, Specht C, Marcovici A, Smiley JF, Javitt DC (2001) Somatosensory input to auditory association cortex in the macaque monkey. J Neurophysiol 85:1322–1327. Medline Sinclair RJ, Burton H (1991) Tactile discrimination of gratings: psychophysical and neural correlates in human and monkey. Somatosens Mot Res 8:241–248. CrossRef Medline Tolhurst DJ, Movshon JA, Dean AF (1983) The statistical reliability of signals in single neurons in cat and monkey visual cortex. Vision Res 23:775– 785. CrossRef Medline Tsunada J, Lee JH, Cohen YE (2011) Representation of speech categories in the primate auditory cortex. J Neurophysiol 105:2634 –2646. CrossRef Medline Uka T, DeAngelis GC (2004) Contribution of area MT to stereoscopic depth perception: choice-related response modulations reflect task strategy. Neuron 42:297–310. CrossRef Medline Uka T, Tanabe S, Watanabe M, Fujita I (2005) Neural correlates of fine depth discrimination in monkey inferior temporal cortex. J Neurosci 25:10796 –10802. CrossRef Medline Werner-Reiss U, Kelly KA, Trause AS, Underhill AM, Groh JM (2003) Eye position affects activity in primary auditory cortex of primates. Curr Biol 13:554 –562. CrossRef Medline Wessinger CM, VanMeter J, Tian B, Van Lare J, Pekar J, Rauschecker JP (2001) Hierarchical organization of the human auditory cortex revealed by functional magnetic resonance imaging. J Cogn Neurosci 13:1–7. CrossRef Medline Yin P, Mishkin M, Sutter M, Fritz JB (2008) Early stages of melody processing: stimulus-sequence and task-dependent neuronal activity in monkey auditory cortical fields A1 and R. J Neurophysiol 100:3009 –3029. CrossRef Medline Yin P, Johnson JS, Sutter ML (2011) Coding of amplitude modulation in primary auditory cortex. J Neurophysiol.