JOURNAL OF APPLIED PHYSICS
VOLUME 90, NUMBER 3
1 AUGUST 2001
Diffuse phase transitions, electrical conduction, and low temperature dielectric properties of sol–gel derived ferroelectric barium titanate thin films Reji Thomasa) and V. K. Varadanb) 212 Earth and Engineering Science, The Pennsylvania State University, University Park, Pennsylvania 16802
S. Komarneni 205 Material Research Laboratory, The Pennsylvania State University, University Park, Pennsylvania 16802
D. C. Dube Department of Physics, Indian Institute of Technology, New Delhi-110 016, India
共Received 20 June 2000; accepted for publication 27 February 2001兲 Ferroelectric thin films of barium titanate were fabricated by sol–gel technique on platinum substrates. The processing temperature was 700 °C. The films obtained with a thickness of 1.5 m were dense, transparent, and showed ferroelectricity. Scanning electron microscopy and x-ray diffraction were used for studying the surface morphology and crystallographic structure of the film. Films in the metal–ferroelectric–metal configuration 共MFM兲 were used for the electrical measurements. Dielectric constant and loss tangent were found to be 430 and 0.015, respectively, at 10 kHz under ambient conditions. The ⑀ ⬘ (T) curve shows broad peak centered around 120 °C as in the case of diffuse phase transition. The ac conductivity is proportional to 0.9 in the low frequency region and 1.8 in the high frequency region. The dc conductivity versus temperature curve showed a change in the slope around 125 °C, corresponding to the phase transition. To study the low temperature phase transitions, dielectric parameters on the films were measured to a temperature down to about 10 K. Remanent polarization ( P r ) and coercive field (E c ) obtained from the hysteresis loop at room temperature are ⬃2.0 C/cm2 and ⬃27 kV/cm, respectively. Capacitance– voltage studies performed on the MFM structures showed butterfly loop at 135 °C. © 2001 American Institute of Physics. 关DOI: 10.1063/1.1367318兴
transceivers.9–14 Thin films of (Ba,Sr兲TiO3 meet most of the device requirements due to their unique combination of properties. Barium titanate in tetragonal form is a displacement type ferroelectric material in which the origin of ferroelectricity is due to the displacement of ions relative to each other.15 A single crystal of barium titanate is in the paraelectric cubic form above its curie temperature 共120 °C兲.16 As it cools down, a variety of structural transformations occur at various temperatures. At 120 °C, the cubic state transforms to a ferroelectric tetragonal state with the polar axis in one of the cube edge directions. At lower temperatures, it undergoes two more structural transitions which are in the ferroelectric state with different polar axes. Around 5 °C, the polar axis changes into the face diagonal and the structure becomes orthorhombic. At ⫺90 °C, the polar axis again changes to body diagonal and the structure remains in the rhombohedral form below this temperature.16 Ferroelectric thin films, like bulk material, possess a given set of properties that are attributed to their composition and microstructure; but unlike the bulk, they possess another set of properties derived from their proximity and interaction with the supporting substrate. These later factors are important and often control the total behavior of the film when in use. Therefore, physical properties of single crystals and polycrystalline ceramics can be used only partially for thin films. In comparison with single domain crystals and multidomain ceramics, the thin films
I. INTRODUCTION
Barium titanate (BaTiO3 ) crystals, ceramics, and thin films with perovskite structure have been studied extensively during the last few decades because of their proven superior electrical and optical properties. For barium titanate crystal, interest was mainly due to its photorefractive properties and other associated effects and applications, such as phase conjugation, volume holography for optical storage, two-beam coupling, and optical computing.1 Dielectric ceramics based on BaTiO3 are widely used in the manufacture of multilayer ceramic capacitors.2 Ferroelectric 共FE兲thin films offer advantages over bulk for a number of applications, including nonvolatile memories, dynamic random access memories, electro-optic switches, pyroelectric detectors, optical modulators, shutters, imagers, and displays to name a few.3– 8 Recently, high quality ferroelectric thin films have been used for advanced microwave signal processing devices. Small compact low power microwave devices that can be fabricated from structures based on FE films include phase shifters, tunable filters, tunable resonators, phased array antennas, and frequency agile microwave radio a兲
Present address: Osaka National Research Institute, 1-8-31 Midorigaoka, Ikeda, Osaka 563-8577, Japan. b兲 Author to whom correspondence should be addressed; electronic mail:
[email protected] 0021-8979/2001/90(3)/1480/9/$18.00
1480
© 2001 American Institute of Physics
Downloaded 19 Mar 2006 to 134.94.165.15. Redistribution subject to AIP license or copyright, see http://jap.aip.org/jap/copyright.jsp
Thomas et al.
J. Appl. Phys., Vol. 90, No. 3, 1 August 2001
also suffer from some characteristic instabilities. Further, the interpretation of the experimental results leads to additional difficulties in the case of thin film as the reported data on them vary widely. Barium titanate thin films have been prepared by methods such as hydrothermal,17 pulsed laser deposition,18 metalorganic chemical vapor deposition,19 sputtering,20 excimer laser ablation,21 molecular beam epitaxi,22 evaporation,23 electrochemical,24 and sol–gel.25 Among these methods, sol–gel processing has an edge over other deposition techniques in terms of good homogeneity, chemical composition control, high purity, low processing temperature, and applicable to large areas, using simple and inexpensive equipment. This article presents dielectric properties of sol–gel processed barium titanate thin films on Pt substrate over a wide range of frequencies and temperatures and especially analizes their low temperature phase transitions which have been reported for single crystals. II. EXPERIMENTAL PROCEDURES
A stock solution of BaTiO3 was prepared by a sol–gel route previously reported by Kamalasanan et al.25 Briefly, thin films of BaTiO3 were prepared using barium hexanoate and titanium isopropoxide as precursors. Methanol was used as the solvent and acetylacetone was used as the chelating agent for the alkoxide. The precursor films were spin coated onto platinum and silicon substrates using a photoresist spinner with spinning speed of 3000 rpm. After spinning the precursor for 30 s, film was held in ambient air for 10 min for gelation and then kept on a hot plate at 450 °C for removing the organics. The thickness of the single layer was controlled by adjusting the viscosity of the solution. Films of higher thickness were obtained by repeating the spinningfiring cycle. When film reached the desired thickness, final annealing was done at 700 °C. We could prepare films with a thickness of 1.5 m in this way. Films were found to be polycrystalline, continuous, dense, and free from any particulates and were used for the electrical studies. Structure of the films was analyzed by x-ray diffraction 共XRD兲. The XRD patterns were recorded with Rigaku Geigerflex x-ray diffractometer 共RU-200B兲 using Cu K ␣ radiation. The surface morphology of the films was analyzed by scanning electron microscopy 共SEM兲 and the thickness measured from the SEM cross section. Electrical measurements were performed on films on platinum substrates. Several aluminum 共Al兲 dots were evaporated through a mask on the film to form metal–ferroelectric–metal 共MFM兲 capacitors. Small signal ac 共100 mV兲 capacitance, loss tangent, and ac conductivity were measured with HP 4284 LCR meter and 4192A impedence analyzer in the frequency range 100 Hz–2 MHz for a wide range of temperatures 共500 to 20 K兲. Capacitance–voltage (C – V) measurements were performed with 4192A impedence analyzer by superimposing an ac signal of amplitude 100 mV of various frequencies with dc bias. Leakage currents at different voltages were measured by means of a Keithley 617 programmable electrometer/source. Polarization–electric field ( P – E) hysteresis loops were recorded with RT66A ferroelectric test system.
1481
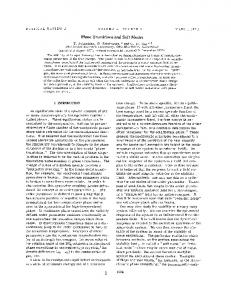
FIG. 1. X-ray diffraction pattern of BaTiO3 thin film on platinum annealed at 700 °C.
III RESULTS AND DISCUSSIONS A. Structure and morphology
Crystalline nature of the film was identified by x-ray diffraction. The pyrolized 共450 °C兲 films were found to be amorphous, and postdeposition annealing was required to develop crystallinity. Figure 1 shows the XRD pattern of the BaTiO3 film on Pt substrate annealed at 700 °C for 15 min. All the peaks corresponding to BaTiO3 could be indexed according to the perovskite structure of tetragonal BaTiO3 phase with lattice constants a⫽3.999 A and c⫽4.031 A. The c/a ratio of 1.01 is in good agreement with that reported by Joshy and Desu26 and Reji et al.27 Polycrystalline nature and absence of preferred orientation are evident from the XRD. Moreover, the XRD pattern of the sample showed a small peak at a diffraction angle of about 24°, corresponding to some unknown phase and hence segregation of small amount of BaO–TiO2 related compound cannot be ruled out in the present BaTiO3 sample. At room temperature the c axis of tetragonal BaTiO3 is longer than the a axis by only 1% which is why the XRD patterns of the tetragonal and cubic BaTiO3 phases look very similar as in Fig. 1. Furthermore, the observation of C – V butterfly curve and hysteresis loop suggest ferroelectric behavior and tetragonal structure of BaTiO3 film. The morphology of the films was found to depend on the deposition conditions. Spinning with viscous solution resulted in translucent films with cracks, where as the films coated with dilute solutions were transparent and crack free. Thicker films coated with repeated spinning-firing cycles were transparent without any cracks. We could fabricate 1.5 m thick films by multiple coatings. Figure 2共a兲 illustrates the typical surface morphology of 1.5 m thick BaTiO3 film on platinum substrate annealed at 700 °C. The surface shows continuous and fine-grained microstructure with no particulates and cracks. The figure also reveals uniform grains 共of size ⬃0.05 m兲 with dense microstructure and uniform surface. Figure 2共b兲 shows the typical cross sectional view of the BaTiO3 film on silicon annealed at 700 °C. To obtain the cross sectional view of the film, cleaving was induced from
Downloaded 19 Mar 2006 to 134.94.165.15. Redistribution subject to AIP license or copyright, see http://jap.aip.org/jap/copyright.jsp
1482
J. Appl. Phys., Vol. 90, No. 3, 1 August 2001
Thomas et al.
FIG. 3. Variation of ⑀⬘ and tan ␦ of BaTiO3 films as a function of frequency at different temperatures.
FIG. 2. 共a兲 Typical surface morphology of 1.5 m thick BaTiO3 on platinum annealed at 700 °C and 共b兲 Cross sectional view of BaTiO3 on silicon annealed at 700 °C.
the back surface of the silicon substrate; thus, it started in the silicon to minimize the effect of fracture on films induced by cleaving. The cross sectional view reveals a dense microstructure with uniform thickness. The figure exhibits a well defined interface suggesting that no significant reaction between BaTiO3 film and silicon substrate has taken place during annealing at the interface confirming the integrability of BaTiO3 film deposited directly on silicon surface. B. Dielectric response
In this section we discuss the dielectric properties of BaTiO3 thin films on platinum in ambient air. The dielectric response of the film is analyzed in terms of ⑀⬘ and tan ␦ as functions of temperature and frequency. Applied ac electric field 共100 mV兲 used for the measurements was less than the coercive field of the material so that the ac field does not alter the polarization state. This small signal applied to the film minimizes the domain wall contribution and allows the comparison of the film with the bulk material.28 Figure 3 shows the variation of dielectric constant 共⑀⬘兲 and loss tangent 共tan ␦兲 as a function of frequency for films at different temperatures. A drop in ⑀⬘ at higher temperatures 共150 and 200 °C兲 may be noted from figure. This observed drop is due to the disappearance of spontaneous polarization as the struc-
ture transforms to a paraelectric cubic form at 120 °C. The room temperature ⑀⬘ and tan ␦ were 430 and 0.015, respectively, at 10 kHz for 700 °C annealed film having a thickness of 1.5 m. The observed ⑀⬘ value is quite low as compared to the value 共⬃2000兲 reported for bulk ceramics,29 which may be due to 共i兲 porosity or second phase, 共ii兲 a thin interfacial layer of low dielectric constant near the free surface and internal interfaces 共grain boundaries兲,30 and 共iii兲 small grain size in the thin films.31 Some workers have assumed space charge depletion layer near the bottom and top electrodes of the film. High built-in fields present in these layers may lead to a field-induced reduction in the dielectric constant.32 In the figure, a ⬍7% decrease in ⑀⬘ has been observed when the frequency increases from 102 to 104 Hz. But the variation in ⑀⬘ is small in frequency range 104 – 106 Hz and relaxation was absent. This behavior can be taken as an indication of the absence of space charge effect and low dielectric constant interfacial layer, which usually results in large low frequency dispersion and relaxation. Hence, the porosity and small grain size 共which is inherent in all sol–gel processed films兲 may be responsible for the low dielectric constant value. Also, the tan ␦ value is higher than that of the bulk ceramic as well as single crystals. The reasons for such high losses of thin films lay in the microstructure as well as in the influence of the metal electrodes.31 It can also be seen from Fig. 3, that tan ␦ is increasing with temperature and this trend is more at lower and higher frequencies. The increase of tan ␦ at lower frequencies with temperature may be due to the increase in the thermally generated free carriers in the sample. The increase in tan ␦ at high frequencies is extrinsic in nature as discussed below. The loss shows a minimum in the range 104 – 5⫻105 Hz. The ⑀⬘ and tan ␦ show very strong increase at frequencies higher than 106 Hz. The possible sources for such dispersion are: the influence of the finite resistance of the electrode, the presence of a barrier layer between the insulating film, and the electrode surface and leaky grain boundaries.33–35 Simi-
Downloaded 19 Mar 2006 to 134.94.165.15. Redistribution subject to AIP license or copyright, see http://jap.aip.org/jap/copyright.jsp
J. Appl. Phys., Vol. 90, No. 3, 1 August 2001
FIG. 4. Variation of ⑀⬘ and tan ␦ of BaTiO3 films as a function of temperature at different frequencies.
lar frequency dispersion due to resonance effect was also reported on lead lanthanum titanate thin films.30 At the frequencies of the order of a few MHz, the stray inductance of the contact and leads may induce L – C resonance 关 f r ⫽1/冑 (LC) 兴 . 28 For thin films having capacitance of the order of 2 nF or so 共as in the present case兲, a stray inductance of the order of few micro-Henry can induce resonance in the mega Hertz range. This seems to be the reason for the strong dispersion in ⑀⬘ and tan ␦ in the high frequency region. Since the resonance behavior starts around 1 MHz, most of the dielectric measurements were conducted at frequencies much lower than this resonance frequency. It has been reported that the electrical properties of BaTiO3 ceramics are affected by moisture and this behavior has been related to the microstructure of the material.25,36 In our case, a sharp peak in the dielectric constant and loss 共figure not shown兲 occurred at 50 °C, presumably due to the moisture effect since it was absent while cooling the sample from high temperature. Similar observation has been reported by Kamalasanan et al.25 The measurements, thus, were taken during cooling cycle. Figure 4 depicts the variation of ⑀⬘ and tan ␦ as a function of temperature at different frequencies. It may be noted that dielectric constant increases with increasing temperature and goes through a broad maximum around 125 °C and then decreases with further increase in temperature. This broad maxima around 125 °C is attributed to the phase transition from tetragonal ferroelectric state to cubic paraelectric state. In conventional BaTiO3 ceramics or single crystals, the dielectric constant shows a pronounced temperature dependence with the maxima at the phase transition temperature 共120 °C兲. Lobo et al.37 reported diffuse phase transition 共DPT兲 in fine grained BaTiO3 ceramic obtained by sol–gel route. As a result of DPT instead of a specific transition temperature, the system yields a smearing of physical anomalies at the transition as, for instance, in the dielectric properties. Also due to DPT, the temperature at which the transition occurs may also change with the fre-
Thomas et al.
1483
quency of the applied signal.16 But in the literature, the data are not consistent about the phase transition at 120 °C in BaTiO3 thin films. For fine grained BaTiO3 thin films, no sharp maximum in the ⑀ ⬘ (T) characteristics in the operating temperature range of the capacitor is observed and is attributed to the small grain size.31 There are reports on the slight reduction in the transition temperature in thin films for the transition from tetragonal to cubic state which is also attributed to the small grain size.38 The observed small shift may be associated with the fact that films are strained due to the presence of the substrate. As far as the present behavior of ⑀ ⬘ (T) of sol–gel processed BaTiO3 thin films is concerned, we observe 共i兲 broadening of the peak, 共ii兲 shift in the transition temperature to the lower side, and 共iii兲 variation of transition temperature with frequency. Based on the above discussion, we attribute the observed ⑀ ⬘ (T) characteristics as due to the diffuse phase transition. Usually diffuse phase transition occurs in solid solutions of tungsten-bronze and perovskite structure and its origin is associated with the defects in the material, such as stoichiometric fluctuation, grain configuration, structural disorder, and microscopic inhomogenities. Even though sol–gel processing results in fine grained microstructure, the small grain size alone cannot be considered responsible for DPT in BaTiO3 , since Kinoshita and Yamaji39 observed much reduced diffuse character of the transition in high purity small grained ceramics of BaTiO3 . Thus, it will be inappropriate to link the diffusivity of the phase transition totally to the grain size. Other contributing factors could be the presence of charged defects on the grain surface, which may interact with the order parameter, giving rise to defect-anticipated and defect-delayed phase transition as in the case of fine grained BaTiO3 ceramics.37 The presence of vacancies and charged centers are usually observed in these kind of oxide systems. Thus, the combined effect of very small grain size, lattice imperfections, and strain in the film seem likely to play a major role in the DPT in the sol–gel processed BaTiO3 thin films. It can also be seen from Fig. 4 that variation of tan ␦ is small for lower temperatures up to 120 °C. The temperature at which the peak observed in the ⑀⬘ showed no such peaking in the tan ␦ except for the curve at 1 MHz. The plots for 1, 10, and 100 kHz do not show any peak in tan ␦, but showed a change in slope. The observed peak in the loss tangent for 1 MHz curve was not exactly at same temperature as that observed for the ⑀ ⬘ (T). As mentioned before, in the case of DPT the temperature at which ⑀⬘ peaks depends on the frequency of measurement, and does not generally coincide with the peak of dielectric loss, as in normal ferroelectrics.16 Hence, we presume this behavior as a consequence of diffuse phase transition. Similar behavior in tan ␦(T) was reported on electrochemically prepared BaTiO3 ceramic thin films.40 The change of slope of tan ␦(T) curve at lower frequencies around 125 °C can be taken as the indication of existence of two structures before and after it.
C. Electrical conduction mechanism
In spite of extensive studies on the dielectric properties of BaTiO3 thin films, their ac conductivity ( ac) has not
Downloaded 19 Mar 2006 to 134.94.165.15. Redistribution subject to AIP license or copyright, see http://jap.aip.org/jap/copyright.jsp
1484
Thomas et al.
J. Appl. Phys., Vol. 90, No. 3, 1 August 2001
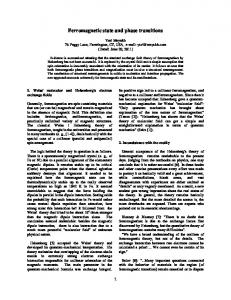
room temperature is a few orders of magnitude less than the ac conductivity and its variation with temperature is also different. This is not unusual because the dc conductivity is determined by the most difficult transition in complete percolation paths between the electrodes, while the ac conductivity is determined by the easiest local movement of the charges. Thus, it is natural to expect that absolute magnitude of these two parameters may not be closely related, and it is evident that their temperature dependence is completely different. The dc was found to increase as the temperature increases and the linear relation between log dc and 103 /T in this temperature range suggests the validity of the relation
dc⫽ 0 exp⫺
FIG. 5. 共a兲 ac conductivity as a function of frequency at different temperatures and 共b兲 variation of conductivity with 1000/T for various frequencies.
been discussed much in the literature. The principal objective of the work described in this section is to check and discuss electrical conduction in ferroelectric thin films of BaTiO3 within the frame work of accepted theories. Frequency dependence of the ac conductivity ( ac) of BaTiO3 films was measured in the range 102 – 2⫻106 Hz for different temperatures is shown in Fig. 5共a兲. For frequencies below 105 Hz, the slope of the curve was 0.9 which corresponds to ac ⬀ ; whereas for frequencies above 105 Hz, the slope changes to 1.8 which corresponds to ac⬀ 2 . These points will be discussed later. The temperature dependence of conductivity 共 ac and dc兲 was measured in the range 300– 480 K. Figure 5共b兲 shows the log 共兲 plot as the function of 1000/T (K ⫺1 ) for various frequencies including dc. The dc conductivity at
冉 冊
E cond , k BT
共1兲
where 0 is a constant, E cond the activation energy for conduction, k B the Boltzman’s constant, and T the temperature. The rise in conductivity may be due to thermally generated carriers in the sample, and hence a semiconductor-type conduction becomes apparent. Also, the curve shows the linear behavior with two different slopes; one in the high temperature and the other in the low temperature region. The activation energies calculated from the slopes were 0.25 and 0.40 eV at high and low temperature regions, respectively. This may be due to the phase transition from tetragonal to cubic structure.25 It seems that the phase transition affects the energies of the trapped carriers, thereby affecting the activation energies of the dc conduction, resulting in two different slopes of the curve. As compared with dc , ac does not show much change with temperature in the measurement range because of its weak dependence on extrinsic factors. But at low frequencies, an increasing trend in ac is observed with increasing temperature which is consistent with the explanation given before in Sec. B on tan ␦. The frequency dependence of ac conductivity may arise due to free, as well as bound carriers. If the conduction is due to free carries then the conductivity must decrease with increase in frequency.25 In our case, ac increases with increasing frequency and therefore the observed ac conductivity must be related to the bound carriers trapped in the sample. As can be seen from the Fig. 5共a兲, the frequency dependence of ac is practically linear upto 105 Hz, and changes into a quadratic variation from 105 Hz onwards. The phenomenon of increasing conductivity with increasing frequency may be interpreted in terms of the Shottky barrier at the metal– dielectric interface, Maxwell–Wagner type conduction and hopping conduction.34 It has been suggested that a final check of the electrode barrier can be made by observing a sharp drop in ⑀⬘ in the conductivity regime of the sample where the ac has a superlinear dependence on the frequency and a saturation of conductivity thereafter.25 Instead, in our case, an increase in ⑀⬘ is observed and the saturation region was absent, which gives enough evidence to rule out this conduction process. In dielectric materials having various regions of different dielectric constants and conductivities, Maxwell–Wagner type polarization may occur.41 This coexistance of low dielectric constant phase with high dielectric constant phase can influence the piling of charges at the interface and hence
Downloaded 19 Mar 2006 to 134.94.165.15. Redistribution subject to AIP license or copyright, see http://jap.aip.org/jap/copyright.jsp
Thomas et al.
J. Appl. Phys., Vol. 90, No. 3, 1 August 2001
1485
Maxwell–Wagner type polarization. This type of conduction can be possible here as the material show the existence of an unknown phase, revealed by the XRD pattern. But compared to the BaTiO3 phase, this unknown phase is a very small fraction as revealed by the intensities of the peak in the XRD pattern. Thus, Maxwell–Wagner type conduction may be excluded in BaTiO3 thin films on platinum substrate as the dominant conduction mechanism. Further, frequency and temperature dependence of the ac conductivity resembles that of hopping type conduction. We now analyze our results in terms of hopping conduction. Hopping of charge carries among the trap levels situated in the band gap of the material may give rise to a frequency dependent ac conductivity with a frequency dependence ⬃ s , where s is ⬍1 or more precisely the relation is42
共 兲⫽
冋 册
2 N 2 ⑀ 8e 2 6 s , 24 ⑀ W m 0
共2兲
where W m ⫽B⫺(W 1 ⫹W 2 ), B is the band gap of the material, W 1 and W 2 are the energies associated with the hopping centers, ⑀ is the dielectric constant of the material, e the electronic charge, N is the concentration of the localized states, and 0 is the effective relaxation time, which is expected to have a value of the order of inverse of phonon frequencies. The parameter s in the expression depends on temperature and tends to be 1 at absolute zero. Elliot42 found ‘‘s’’ decreasing with increasing temperature. In this type of oxide thin films, presence of charge traps in the band gap of the insulator are expected.27 The oxygen vacancies are one kind of charge trap, the other charge traps may include interface charges, polarization charges, etc.43 So the above explained hopping type conduction between these trap centers seems a possibility in our case also. From Fig. 5共a兲, ⬀ 0.9 in the frequency range 102 – 105 Hz confirms this observation. Also from the figure, it can be seen that s ⫽0.9 共at 40 °C兲 and is found to decrease with increasing temperature. This kind of variation is also predicted by the above explained model. Hence, we conclude that ac conduction in BaTiO3 film is the hopping type conduction. At high frequencies, it shows a quadratic dependence. The observed slope of 1.8 obtained in this case must be due to the resonance effect of test circuit as explained in the ⑀⬘ and tan ␦ variation with frequency. Even though the observed frequency dependance of ac is best described by the hopping model in the low frequency region, we wish to emphasize one thing about this well known model. This classic model was framed for a single homogenous medium, with two perfect symmetric ohmic contacts. But in the present case, the film is heterogenous 共grains and grain boundaries兲 sandwiched between two asymmetric electrodes, therefore the deviations from the classic model are expected due to inhomogenities existing in the system. Still, for thin films, it is worth considering this model along with the effects of impurities and defects, and their role should be considered theoretically and experimentally in detail.
FIG. 6. Low temperature variation of ⑀⬘ and tan ␦ of BaTiO3 films at different frequencies.
D. Low temperature dielectric properties
The three transitions which BaTiO3 undergoes are of first order and the temperature dependence of ⑀⬘ and tan ␦ shows discontinuities at the transitions. To study the behavior of the sol–gel derived BaTiO3 thin films on platinum substrate at lower temperatures, the dielectric properties of the film were investigated from room temperature down to 10 K and the results are shown in Fig. 6. These low temperature measurements were done with the aid of a cryostat 共APD Cryogenics, Inc兲 in vacuum of 10⫺4 Torr. The dielectric constant and loss tangent were 470 and 0.015 at 300 K at 10 kHz. A previously reported work revealed a drop in ⑀⬘ and tan ␦ when the measurement atmosphere changed from humid 共35%兲 air to dry air. This drop in ⑀⬘ and tan ␦ were explained on the basis of humidity effect and the subsequent space charge polarization.25 In our case, at 10 kHz, ⑀⬘ increases from 430 to 470 and tan ␦ remains unchanged as the measurement atmosphere is changed from air to vacuum. At present we cannot assign exact reason for this behavior. It can be seen that ⑀⬘ decreases as the sample is cooled and the decrease is sharp at the very low 共⬍70 K兲 temperatures and the trend was same for all the frequencies of the applied ac signal. What is important here is the lack of any anomalies in the ⑀ ⬘ (T) curve at the phase transition temperatures. A similar observation in ⑀ ⬘ (T) and tan ␦(T) has been reported on BaTiO3 thin films on BaPbO3 ceramics.44 In polycrystalline BaTiO3 ceramics, an increase of the polarization due to the domain wall vibration from the tetragonal to orthorhombic phase and from orthorhombic to rhombohedral phase eliminates a sharp change in ⑀⬘ of the ceramic, and which is most likely to occur in the case of thin film as well due to its polycrystalline nature.45 This effect along with the small grain size in thin films may result in the suppression of anomaly in the ⑀ ⬘ (T) curve at transitions. But the dielectric losses in the ferroelectric phase are determined mainly by the domain wall motion and a temperature dependent tan ␦ is expected even in the case of polycrystalline ceramic. As a
Downloaded 19 Mar 2006 to 134.94.165.15. Redistribution subject to AIP license or copyright, see http://jap.aip.org/jap/copyright.jsp
1486
J. Appl. Phys., Vol. 90, No. 3, 1 August 2001
Thomas et al.
result of transition from the paraelectric to ferroelectric state, tan ␦ increases sharply because of the appearance of domain structure and because of the vibration of the domain wall. Similarly, tan ␦ also increases as a result of transition from tetragonal to orthorhombic and orthorhombic to rhombohedral phase due to the increase in the wall mobility. But in the present case, variation of the loss tangent with temperature showed a different behavior. The tan ␦ was found to decrease as the temperature falls and a flat behavior is observed for the intermediate temperature range 共225–125 K兲. But at low temperatures, the loss monotonically increases with decreasing temperature as was also observed by Kuwabara et al.44 Here also, as in the case of ⑀⬘, the trend was almost the same for all frequencies. In short, no distinct anomaly is observed in the tan ␦(T) curve corresponding to the phase transitions at 278 and 183 K as reported for single crystals or bulk ceramics. The small grain size effect along with the interaction of grains via depolarization field, stress from the substrate, elastic strain, and thermal fluctuations can mask the measurable properties at the transitions resulting in such suppression.
E. Ferroelectric properties
The nonlinear dielectric 共ferroelectric兲 properties of the sol–gel grown BaTiO3 films were studied by observing the variation of the capacitance at different bias voltages. A small ac signal of 100 mV was applied and the dc field was swept from positive bias to negative bias and back again. Figures 7共a兲 and 7共b兲 show the C – V plot for the film at 1 and 100 kHz. Measurement of the C – V in MFM configuration demonstrates the ferroelectric properties and gives the information about domain switching, although there is no exact determination of spontaneous polarization and remanent polarization.26 The two maxima, which are due to the ferroelectric polarization reversal, are clearly seen in Fig. 7. This butterfly loop is an indication of ferroelectricity in the film. To analyze the broad phase transition around 120 °C as explained in Sec. C, we have plotted the C – V curve at different temperatures. Figures 8共a兲– 8共c兲 show the curves at 10 kHz for different temperatures of 40, 135, and 170 °C. The figures reveal the existence of a weak ferroelectricity even at 135 °C as is evidenced by the presence of the weak butterfly loop. The loop is more pronounced at 40 °C, where the material as a whole is in the ferroelectric state. This type of behavior confirms the diffuse type phase transitions in the present BaTiO3 film in the Curie range, which is due to the coexistence of paraelectric and ferroelectric phases in this temperature range. In this case, any temperature within the Curie region corresponds to the curie temperature of a small fraction of the total volume while some microregions are above their curie temperature and others are below as explained before in Sec. B. As a result, a complex behavior in the dielectric and ferroelectric properties is expected as reflected in the dielectric studies and now in the C – V curves. The disappearance of ferroelectricity 共absence of butterfly loop兲 at higher temperature 共above the curie range兲 is clear from Fig. 8共c兲 due to the paraelectric nature of the film.
FIG. 7. C – V plot of the Pt/BaTiO3 /Al structure at 共a兲 1 kHz and 共b兲 100 kHz.
The ferroelectric properties of these films were also measured using a RT-66 ferroelectric test system. The P – E hysteresis loop obtained is shown in Fig. 9. The remanent polarization ( P r ) and the coercive field (E c ) were 2.0 C/cm2 and 27 kV/cm, respectively. The value of P r was much lower than the value of BaTiO3 single crystals; however, the value of E c was found to be larger. Even for single crystals, the values reported show wide variations with the accepted values of P r ⫽26 C/cm2 and E c ⫽1 kV/cm. 46 For ceramic BaTiO3 , some what higher value for coercive field 共3.5 kV/ cm兲 and less value for polarization 共8 C/cm2兲 have been reported.46 These observations point out the distribution of values for individual grains, each of which is constrained by
Downloaded 19 Mar 2006 to 134.94.165.15. Redistribution subject to AIP license or copyright, see http://jap.aip.org/jap/copyright.jsp
Thomas et al.
J. Appl. Phys., Vol. 90, No. 3, 1 August 2001
1487
FIG. 8. Change in shape of the C – V butterfly loop for 10 kHz frequency with temperature 共a兲 at 40 °C, 共b兲 135 °C, and 共c兲 170 °C.
its neighbor for the polycrystalline material. Further, in the case of thin films, substrate can effect the properties to a large extent. Generally it introduces stress in the film during the film growth due to the lattice and thermal mismatch between them. Small grain size of the polycrystalline materials
also reduces the remanent polarization.26 The ferroelectric domain structure of fine grained BaTiO3 ceramic can be different from that of normal tetragonal BaTiO3 . In small grained BaTiO3 , the ferroelectric domains showed 71° wall instead of normal 90° walls.47 Based on the above discussion, the observed difference in P r and E c in our film may be due to the small grain sizes and stress introduced in the film during their growth. Similar results were reported for polycrystalline BaTiO3 film prepared by metalorganic solution deposition and rf-magnetron sputtering techniques.26,48 IV. CONCLUSIONS
FIG. 9. Typical P – E hysteresis loop of BaTiO3 thin films on platinum annealed at 700 °C.
Ferroelectric thin films of BaTiO3 having a thickness of ⬃1.5 m were successfully prepared on platinum substrates. The surface morphology study revealed continuous surface and fine grained microstructure with no particulates on the surface and cracks. The peaks corresponding to the BaTiO3 could be indexed according to the perovskite structure of the tetragonal BaTiO3 and lattice constants calculated were a ⫽b⫽3.999 Å and c⫽4.031 Å. The dielectric constant and loss tangent were 430 and 0.015 at 10 kHz under ambient conditions. The dielectric constant showed a broad peak in the Curie range and this behavior was attributed to the diffuse type phase transition. Conductivity ( ac) showed a linear dependence on frequency up to 105 Hz and was explained on the basis of hopping type conduction. The
Downloaded 19 Mar 2006 to 134.94.165.15. Redistribution subject to AIP license or copyright, see http://jap.aip.org/jap/copyright.jsp
1488
reported low temperature phase transitions in the ferroelectric BaTiO3 single crystals have been found suppressed in the thin film. Ferroelectric nature of the film was confirmed with observation of C – V butterfly loop. Remanent polarization and coercivity were calculated from the P – E hysteresis loop and were found to be 2.0 C/cm2 and 27 kV/cm, respectively. 1
Thomas et al.
J. Appl. Phys., Vol. 90, No. 3, 1 August 2001
W. Ousi-Benomar, S. S. Xue, R. A. Lessard, A. Singh, Z. L. Wu, and P. K. Kuo, J. Mater. Res. 9, 970 共1994兲. 2 P. P. Phule and S. H. Risbud, Mater. Res. Soc. Symp. Proc. 121, 275 共1988兲. 3 G. H. Haertling, J. Vac. Sci. Technol. A 9, 414 共1991兲. 4 T. Sumi et al., Jpn. J. Appl. Phys., Part 1 35, 1516 共1996兲. 5 R. Thomas and D. C. Dube, Jpn. J. Appl. Phys., Part 1 36, 7337 共1997兲. 6 A. M. Glass, Science 235, 1003 共1987兲. 7 L. M. Shepperd, Ceram. Bull. 71, 85 共1992兲. 8 A. S. Bhalla and K. M. Nair, J. Am. Ceram. Soc. 25 共1992兲. 9 R. Thomas and D. C. Dube, Electron. Lett. 33, 218 共1997兲. 10 R. Thomas and D. C. Dube, Proceedings of the Asia Pacific Microwave Conference, 1996, p. 1207. 11 J. S. Horwitz, D. B. Chrisey, J. M. Pond, R. C. Y. Auyeung, C. M. Cotell, K. S. Grabowski, P. C. Dorsey, and M. S. Kluskens, Integr. Ferroelectr. 8, 53 共1995兲. 12 D. C. DeGroot, J. A. Beal, R. B. Marks, and D. A. Rudman, IEEE Trans. Appl. Supercond. 5, 2272 共1995兲. 13 Yu. A. Boikov, Z. G. Ivanov, A. N. Kiselev, E. Olsson, and T. Cleason, J. Appl. Phys. 78, 4591 共1995兲. 14 F. Abbas, L. E. Davis, and J. C. Gallop, IEEE Trans. Appl. Supercond. 5, 3511 共1995兲. 15 H. P. Rooksby and H. D. Megaw, Nature 共London兲 155, 484 共1945兲. 16 M. E. Lines and A. M. Glass, Principles and Applications of Ferroelectrics and Related Materials 共Clarendon, Oxford, 1977兲. 17 E. B. Slamovich and I. A. Aksay, J. Am. Ceram. Soc. 79, 239 共1996兲. 18 M. Grant Norton, K. P. B. Cracknell, and C. Barry Carter, J. Am. Ceram. Soc. 75, 1999 共1992兲. 19 P. C. Van Buskirk, R. Gardiner, P. S. Kirlin, and S. Nutt, J. Mater. Res. 7, 542 共1992兲. 20 G. Q. Li, P. T. Lai, S. H. Zeng, M. Q. Huang, and B. Y. Liu, Appl. Phys. Lett. 66, 2436 共1995兲.
G. M. Davis and M. C. Gower, Appl. Phys. Lett. 55, 112 共1989兲. R. A. Mackee, F. J. Walker, E. D. Specht, G. E. Jellison, Jr., and L. A. Boater, Phys. Rev. Lett. 72, 2741 共1994兲. 23 C. Feldman, Rev. Sci. Instrum. 26, 463 共1955兲. 24 P. Bendale, S. Venigalla, J. R. Ambrose, E. D. Verink, Jr., and J. H. Adair, J. Am. Ceram. Soc. 76, 2619 共1993兲. 25 M. N. Kamalasanan, N. Deepak Kumar, and S. Chandra, J. Appl. Phys. 74, 5679 共1993兲. 26 P. C. Joshy and S. B. Desu, Thin Solid Films 300, 289 共1997兲. 27 R. Thomas, D. C. Dube, M. N. Kamalasanan, and S. Chandra, Thin Solid Films 346, 212 共1999兲. 28 P. C. Joshy and S. B. Desu, J. Appl. Phys. 80, 2349 共1996兲. 29 J. W. Jang, S. J. Chung, W. J. Cho, T. S. Hahn, and S. S. Choi, J. Appl. Phys. 81, 6322 共1997兲. 30 S. K. Dey and J. J. Lee, IEEE Trans. Electron Devices 39, 1607 共1992兲. 31 R. Waser, Integr. Ferroelectr. 15, 39 共1997兲. 32 K. Abe and S. Komatsu, Jpn. J. Appl. Phys., Part 1 32, 4186 共1993兲. 33 R. Thomas, D. C. Dube, M. N. Kamalasanan, S. Chandra, and A. S. Bhalla, J. Appl. Phys. 82, 4484 共1997兲. 34 A. I. Lakatos and Abkowitz, Phys. Rev. B 3, 1791 共1971兲. 35 M. A. Sayer, A. Mansingh, A. K. Arora, and A. Lo, Integr. Ferroelectr. 1, 129 共1992兲. 36 A. J. Mountwala, J. Am. Ceram. Soc. 54, 544 共1971兲. 37 R. P. S. M. Lobo, N. D. S. Mohallem, and R. L. Moreira, J. Am. Ceram. Soc. 78, 1343 共1995兲. 38 G. Art, D. Hennigs, and G de With, J. Appl. Phys. 58, 1619 共1985兲. 39 K. Kinoshita and A. Yamaji, J. Appl. Phys. 47, 371 共1976兲. 40 K. Yamashita, M. Matsuda, Y. Inda, T. Umegaki, M. Ito, and T. Okura, J. Am. Ceram. Soc. 80, 1907 共1997兲. 41 M. Kitao, Jpn. J. Appl. Phys. 11, 1472 共1972兲. 42 S. R. Elliot, Philos. Mag. 36, 1291 共1977兲. 43 B.-S. Chiou and M.-C. Lin, Thin Solid Films 248, 247 共1994兲. 44 M. Kuwabara, S. Takahashi, and T. Kuroda, Appl. Phys. Lett. 62, 3372 共1993兲. 45 G. W. Taylor, Ferroelectricity and Related Phenomena 共Gordon and Breach, New York兲, Vol. 3, Chap. 8. 46 B. Jaffe, W. R. Cook, and H. Jaffe, Piezoelectric Ceramics 共Academic, New York, 1971兲. 47 D. Hennings and G. Rosenstein, J. Am. Ceram. Soc. 67, 249 共1964兲. 48 M. H. Song, Y. H. Lee, T. S. Hahn, M. H. Oh, and K. H. Yoon, J. Appl. Phys. 79, 3744 共1996兲. 21 22
Downloaded 19 Mar 2006 to 134.94.165.15. Redistribution subject to AIP license or copyright, see http://jap.aip.org/jap/copyright.jsp