2Technical Support Engineer, Concentrix India Pvt Ltd, Chennai, Tamilnadu, India. AbstractâMassive integration of information technologiesintoall aspects of ...
International Journals of Advanced Research in Computer Science and Software Engineering ISSN: 2277-128X (Volume-7, Issue-6)
Research Article
June 2017
Digital Clock Recognition using SVM Based Template Matching 1
1
Vairaprakash Gurusamy, 2K. Nandhini Department of Computer Applications, School of IT, Madurai Kamaraj University, Madurai, Tamilnadu, India 2 Technical Support Engineer, Concentrix India Pvt Ltd, Chennai, Tamilnadu, India
Abstract—Massive integration of information technologiesintoall aspects of modern life caused demand for processing images as conceptual resources in information systems. Here we are using two different types of algorithm. One is OTSU thresholding. Otsu is an automatic threshold selection region based segmentation method. It is used for Image Segmentation and is one of the most fundamental and difficult problems in image analysis. Image segmentation is an important part of image processing. Anotherone is canny edge detection. Edge detection is one of the most important stages in image processing. This algorithm is most widely used edge detection algorithm because of its advantages. In this paper, we present OTSU and aCanny algorithm implemented on digital clock image extraction by using matlab. Keywords – Digital clock, OTSU thresholding, canny edgedetection. I. INTRODUCTION Thresholding is an important technique in image segmentation applications. The basic idea of thresholding is to select an optimal gray-level threshold value for separating objects of interest in an image from the background based on their graylevel distribution. While humans can easily differentiable an object from thecomplex background and image thresholding is a difficult task to separate them. The gray-level histogram of an image is usually considered as efficient tools for development of image thresholding algorithms Thresholding creates binary images from grey-level ones by turning all pixels below some threshold to zero and all pixels about that threshold to one. Edge detection is an essential preprocessing step in many computer vision algorithms. Within this project, we implement one of these methods, the Canny Edge Detector. The Canny edge detector is a popular method for detecting edges that begin by smoothing an image by convolving it with a Gaussian of a given sigma value. Based on the smoothed image, derivatives in both the x and y-direction are computed; these, in turn, are used to compute the gradient magnitude of the image. Once the gradient magnitude of the image has been computed, a process called “non-maximum suppression” is performed; in which pixels are suppressed if they do not constitute a local maximum. The final step in the Canny edge detector is the hysteresis operator, in which pixels are marked as either edges, non-edges and in-between, this is done based on threshold values. The next step is to consider each of the pixels that are in-between if they are connected to edge pixels these are marked as edge pixels as well. Theresult of this edge detector is a binary image in which the white pixels closely approximate the true edges of the original image. canny_edges (MAX, MIN, SIGMA) In which MAX is the maximum threshold value for hysteresis, and MIN value is the minimum, SIGMA is used for generating the Gaussian kernels. II. CLASSIFIERS A. Svmtechnique More formally, a support vector machine constructs a hyperplane or set of hyperplanes in a high- or infinite- dimensional space, which can be used for classification, regression, or other tasks. Intuitively, a good separation is achieved by the hyperplane that has the largest distance to the nearest training data point of any class (so-called functional margin), since in general the larger the margin the lower the generalization error of the classifier. SVMs are a new type of pattern classifier based on a novel statistical learning technique. Unliketraditional methods (e.g. Neural Networks), which minimize the empirical trainingerror, SVMs aim at minimizing an upper bound of the generalization error throughmaximizing the margin between the separating hyperplane and the data. SinceSVMs are known to generalize well even in high-dimensional spaces under smalltraining sample conditions and have shown to be superior to traditional empiricalrisk minimization principle employed by most of theneuralnetworks, SVMs havebeen successfully applied to a number of applications ranging from face detection, verification, and recognition, object detection and recognition, handwritten character and digit recognition, textdetection and categorization, speech and speaker verification, recognition, information and image retrieval, predictionandetc. SVM approach has some advantages compared to others classifiers. They are robust, accurate and very effective even in cases where the number of training samples is small. SVM technique also shows greater ability to generalize and agreater likelihood of generating goodclassifiers. © www.ijarcsse.com, All Rights Reserved
Page | 337
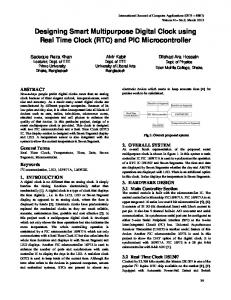
Gurusamy et al., International Journals of Advanced Research in Computer Science and Software Engineering ISSN: 2277-128X (Volume-7, Issue-6) B. Templatematching Template matching is a technique in digital image processing for finding small parts of an image which match a template image. It can be used in manufacturing as a part of quality control, a way to navigate a mobile robot, or as a way to detect edges in images. This algorithm has the characteristics of high speed and real-time. The template matching method is one of the effective ways to achieve the classification of discrete input mode. Its essence is to measure a certain similarity between the input mode and the sample, then take maximum similarity as the category of the input mode, which is different from SVM and BP neural network classifier. It extracts features according to the intuitive form of the character and uses therelated matching principle to discern, that means the input character and standard character matching in a classifier. It is often very fast. 1. SCOPE i. Template Matching is the algorithm thatapplied to recognize the characters. ii. Characterstobetestedarealphabet (A–Z). iii. Grey-scaleimageswereusedwithTimesNewRomanfonttype. iv. Usingbitmapimageformat v. Using240x240imagesize vi. Tocomparebetweentwoimagesofalphabet
Fig. 1 Workflow of the Template Matching Algorithm 2. TEMPLATE MATCHING STEPSFOR RECOGNITION Thetemplate-matchingalgorithmimplementsthefollowingsteps: i. Firstly,thecharacterimagefromthedetectedstringisselected. ii. Afterthat,theimagetothesizeofthefirsttemplateisrescaled. iii. After rescalingthe image to the size of the first template (original) image,thematchingmetriciscomputed. iv. Then the highest match found isstored. If the image is not matchedrepeatagainthethirdstep. v. Theindexofthebestmatchisstoredastherecognizedcharacter. The value of the data that was entered will be extracted from the images, comprising letters. The image is converted into 12x12 bitmap. The bitmapis represented by 12x12- matrix or by144 vectors with 0 and 1 coordinates. III. MODULES OF CANNY EDGEALGORITHM A. ImageSmoothing It is inevitable that all images taken from a camera will contain some amount of noise. To prevent that noise is mistaken for edges, noise must be reduced. Therefore the image is first smoothed by applying a Gaussian filter. The effect of smoothing the test image with this filter is shown in Fig. 2 © www.ijarcsse.com, All Rights Reserved
Page | 338
Gurusamy et al., International Journals of Advanced Research in Computer Science and Software Engineering ISSN: 2277-128X (Volume-7, Issue-6)
Fig 2: The original grayscale image is smoothed with a Gaussian filter to suppress noise. B. Findinggradients The Canny algorithm basically finds edges where the grayscale intensity of the image changes the most. These areas are found by determining gradients of the image. Gradients at each pixel in the smoothed image are determined by applying what is known as the Sobel-operator.
Fig. 3 Smoothed and Gradientmagnitudes C. Non-maximum suppression The purpose of this step is to convert the “blurred” edges in the image of the gradient magnitudes to “sharp” edges. Basically, this is done by preserving all local maxima in the gradient image and deleting everything else. The algorithm is for each pixel in the gradientimage: 1. Round the gradient direction θ to nearest 45◦, corresponding to the use of an 8-connected neighborhood. 2.
3.
Compare the edge strength of the current pixel with the edge strength of the pixel in the positive and negative gradient direction. I.e. if the gradient direction is north (THETA = 90 ◦), compared with the pixels to the north andsouth. If the edge strength of the current pixel is largest; preserve the value of the edge strength. If not, suppress (i.e. remove) thevalue.
A simple example of non-maximum suppression is shown in Figure 4. Almost all pixels have gradient directions pointing north. They are therefore comparedwith the pixels above and below. The pixels that turn out to be maximal in this comparison are marked with white borders. All other pixels will be suppressed. Figure 5 shows the effect on the test image.
Fig 4.Illustration of non-maximum suppression. The edge strengths are indicated both as colors and numbers, while the gradient directions are shown as arrows.The resulting edge pixels are marked with white borders. © www.ijarcsse.com, All Rights Reserved
Page | 339
Gurusamy et al., International Journals of Advanced Research in Computer Science and Software Engineering ISSN: 2277-128X (Volume-7, Issue-6)
Fig. 5 Gradient Value
Edges after Non maximumsuppression
Edgepixels are only preserved where the gradient has localmaxima. D. Doublethresholding The edgepixels remaining after the non-maximum suppression step are (still) marked with their strength pixel- bypixel.Manyofthesewillprobablybetrueedgesintheimage, but some may be caused by noise or color variations for instance due to rough surfaces. The simplest way to discern between these would be to use a threshold so that only edges stronger that a certain value would be preserved. The Canny edge detection algorithm uses double thresholding. Edge pixels stronger than the high threshold are marked as strong, edge pixels weaker than the low threshold are suppressed and edge pixels between the two thresholds are marked as weak. The effect on the test image with thresholds of 20 and 80 is shown in Figure6.
Fig.6 Thresholding of edges. In the second image, strong edges are white, while weak edges are gray.Edges with a strength below both thresholds are suppressed. E. Edge tracking byhysteresis Strong edges are interpreted as “certain edges”, and can immediately be included in the final edge image. Weak edges are included if and only if they are connected to strong edges. The logic is, of course, that noise and other small variations are unlikely to result in a strong edge (with proper adjustment of the threshold levels). Thus strong edges will (almost) only be due to true edges in the original image. The weak edges can either be due to true edges or noise/color variations. The latter type will probably be distributed independently of edges on the entire image, and thus only a small amount will be located adjacent to strong edges. Weak edges due to true edges are much more likely to be connected directly to strongedges. Edge tracking can be implemented by BLOB-analysis (Binary Large Object). The edge pixels are divided into connected BLOB‟s using 8-connected neighborhood. BLOB‟s containing at least one strong edge pixel are then preserved, while other Blobs‟s are suppressed. The effect of edge tracking on the test image is shown in Figure 7.
Fig. 7 Double thresholding © www.ijarcsse.com, All Rights Reserved
Edge tracking by hysteresis Final output Page | 340
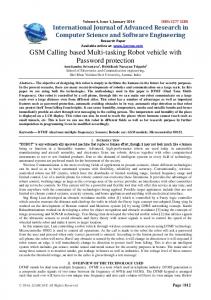
Gurusamy et al., International Journals of Advanced Research in Computer Science and Software Engineering ISSN: 2277-128X (Volume-7, Issue-6) The middle image shows strong edges in white, weak edges connected to strong edges in blue, and other weak edges in red. Implementation of Canny Edge Detection As noted in Section 1, all images in this worksheet (except the original) are produced by our implementation. A few things should be noted with regards to this: 1. The (source) image and the thresholds can be chosen arbitrarily. 2. Only a smoothing filter with a standard deviation of σ=1.4 is supported 3. The implementation uses the correct Euclidean measure for the edge strengths. 4. The different filters cannot be applied to edge pixels. This causes the output image to be 8 pixels smaller in eachdirection. The last step in the algorithm known as edge tracking can be implemented as either iterative or recursive BLOB analysis [4]. A recursive implementation can use the grassfire algorithm. However, our implementation uses the iterative approach. First, all weak edges are scanned for neighbor edges and joined into groups. At the same time, it is marked which groups are adjacent. Then all of these markings are examined to determine which groups of weak edges are connected to strong edges (directly or indirectly). All weak edges that are connected to strong edges are marked as strong edges themselves. The rest of the weak edges are suppressed. This can be interpreted as BLOB analysis where theonly BLOB‟s containing strong edges are preserved (and considered as one BLOB). IV. PROPOSEDSYSTEM A. Datasets The 3 datasets are taken for the analysis based on thesizeofDigitalImages.Thesizesofimagesare1.8inches,2.5 inches and 4.0 inch. In 1.8 size images having 20 three digital format images and 30 four digital format images.In 2.5 size images having 20 three digital format images and 25 four digital format images. In 4.0 size images having 20 three digital format images and 22 four digital format images. B. Technique For templates without strong features, or for when the bulk of the template image constitutes the matching image, a template-based approach may be effective. As aforementioned, since template-based template matching may potentially require sampling of a large number of points, it is possible to reduce the number of sampling points by reducing the resolution of the search and template images by the same factor and performing the operation on the resultant downsized images (multi-resolution) or Pyramid (imageprocessing)), providing a search window of data points within the search image so that the template does not have to search every viable data point or a combination ofboth. C. Accuracy It is defined as the ratio of a number of characters accurately detected to the number of characters in theimage. Accuracy=Total number of characters detected inCorrect Manner /Total Number of characters*100% The below Table 1 shows the experimental result of the various types of input images. Finally, the accuracy is calculated. Table 1 Experimental Results Size of the Number of Number of digital Number of total Number of digital Input Image total characters in digital characters character recognized inputImages input image in correct manner 1.8 20 3 60 45 30 4 120 108 2.5 20 3 60 52 25 4 100 83 4.0 20 3 60 49 22 4 88 76
Accuracy In Percentage 75 90 87 83 82 86
Fig. 8 Accuracy Graph © www.ijarcsse.com, All Rights Reserved
Page | 341
Gurusamy et al., International Journals of Advanced Research in Computer Science and Software Engineering ISSN: 2277-128X (Volume-7, Issue-6) Proper Output In Figure 9, the input image is captured. It is in RGB color. So it is converted to grayscale image in figure 10. To perform image processing operations, noises are removed in figure 11 and the width is increased to get the approximation image. Approximation image is then converted to abinary image by using Otsu threshold method in figure 12.
Fig. 9InputImage
Fig. 10 Gray ConversionImage
Fig. 11 Approximation Image
Fig. 12 Threshold Image
In the figure, 13 edges are detected using Canny edge detection method. Then the text is extracted in figure 14. Infigure15, 16 and 17 the digits are individually extracted.
Fig. 13 Canny Edge Detection
Fig.15Fig. 16
Fig. 14 Text Extraction Region
Fig.17 Individually Extracted Digits
In the figure 18, 19, 20 the digital characters are classified using SVM with the help of Template matching.
Fig. 18 © www.ijarcsse.com, All Rights Reserved
Fig. 19 Page | 342
Gurusamy et al., International Journals of Advanced Research in Computer Science and Software Engineering ISSN: 2277-128X (Volume-7, Issue-6)
Fig. 20 Mismatched Output In figure 21, the Input Image is captured which is an RGB image. Then the RGB image is converted into Gray Scale image in figure 22 to perform Image Processing Operations. Then the Gray Scale Image is converted into Approximation Image in figure 23 for removing the noise and increasing the width of the digit. Then the Approximation Image is converted into threshold image in figure 24 to convert into abinaryimage.
Fig. 21 Input Image
Fig. 23ApproximationImage
Fig. 22Gray Scale image
Fig. 24ThresholdImage
Edges are Detected in the binary images in figure 25 using Canny Edge Detection. In figure 26, Texts are located using the Text Confidence.
Fig. 25 Canny Edge Image
Fig. 26 Text Confidence image
In the fig. 26,27,28,29 the digits are individuallyextracted.
Fig. 26Fig. 27 © www.ijarcsse.com, All Rights Reserved
Fig. 28
Fig. 29 Page | 343
Gurusamy et al., International Journals of Advanced Research in Computer Science and Software Engineering ISSN: 2277-128X (Volume-7, Issue-6) Digital characters are classified using SVM with the help of Template matching. In Figure 30, the input digit zero is mismatched as digit eight.
Fig. 30 Mismatched digit V. CONCLUSION The digital clock characters are recognized by the trained digital clock character recognition. The DCR is able to detect automatically of the letters of three digital letter size 1.8, 2.5 and 4.0. For the accuracy scenario, 2.5 size digital letters are produced higher accuracy than other size of the digital characters in which three digital characters are presented. For the four digital characters involved as an input image, 1.8 size digital letters are produced good accuracy compare with all other. In future, extend the DCR concept for various size of digital letter and increase the prediction accuracy rate to higher and the normal digits 0-9 are classified and recognized in various different type of fonts. REFERENCES [1] Ashraf A. Aly, Safaai Bin Deris, NazarZaki (2011) “Research Review for Digital Image Segmentation Techniques”, International Journal of Computer Science & Information Technology (IJCSIT). Vol 3, No 5,2011 [2] Anita Pal &Dayashankar Singh (2010)“Handwritten English Character Recognition Using Neural Network” International Journal of Computer Science & Communication Vol. 1, No. 2, pp. 141-144.2010. [3] Anshulgupta,Manishasrivastava (2008) has proposed an “Offline Handwritten Character Recognition” Image Processing: An International Journal (IPIJ) Vol.4, No.5,2008 [4] Boykov Y and Funka-Lea G(2006) “Graph cuts and efficient n-d image segmentation,” International Journal of Computer Vision, vol. 70, no. 2, pp. 109–131,2006 [5] DishaBhattacharjee, DeeptiTripathi, RubiDebnath, VivekHanumante and Sahadev Roy(2014) “A Novel Approach for Character Recognition,” International Journal of Engineering Trends and Technology (IJETT) – Volume 10 Number6,2014 [6] Fazlul Kader M D and Kaushik Deb(2011) “neural network-based English alphanumeric character recognition” International Journal of Computer Science & Information Technology (IJCSIT) Vol 3,No 6,2011 [7] Hoover A, Kouznetsova V and Goldbaum M(2000) “Locating blood vessels in retinal images by piecewise threshold probing of a matched filter response,” IEEE Transactions on Medical Imaging, vol. 19, no. 3, pp. 203– 210. [8] Kauleshwar Prasad, Devvrat C. Nigam, AshmikaLakhotiya and DheerenUmre(2013) “Character Recognition Using Neural Network” International Journal of Science and Technology Vol. 6, No. 1,2013 [9] Lakshmi.S, Dr.V.Sankaranarayanan(2010) “A study of Edge Detection Techniques for Segmentation Computing Approaches”, IJCA Special Issue on “Computer Aided Soft Computing Techniques for Imaging and Biomedical Applications” CASCT,2010 [10] Mousavinezhad H,Jeong-Young Song, and Mahasukhon, P(2012)“Ridge-based vessel segmentation in color images of the retina,” IEEE International Conference on Electro/Information Technology(EIT),2012 [11] Martinez-Perez M E, Hughes A D, Thom S A, Bharath A A, and Parker K H(2007) “Segmentation of blood vessels from red-free and fluorescein retinal images,” Medical image analysis, vol. 11, no. 1, pp.47–61,2007 [12] NishaVasudeva, Hem JyotsanaParashar and Singh Vijendra(2012) “Offline Character Recognition System Using Artificial Neural Network” International Journal of Machine Learning and Computing, Vol. 2, No. 4,2012 [13] Nayan Patel ,AbhishekShah, KrutiDangarwala has proposed(2014) “A Study of Digital Image Filtering Techniques in Spatial Image Processing” International Conference on Convergence of Technology,2014 [14] Pradeep. J.,Srinivasan, E. and Himavathi S(2011)“Neural Network Based Handwritten Character Recognition System without Feature Extraction,” International Conference on Computer, Communication and Electrical Technology (ICCCET),2011 © www.ijarcsse.com, All Rights Reserved
Page | 344
[15] [16] [17] [18] [19]
[20] [21]
Gurusamy et al., International Journals of Advanced Research in Computer Science and Software Engineering ISSN: 2277-128X (Volume-7, Issue-6) RanitaBiswas,Jaya Sil(2012) ”An Improved Canny Edge Detection Algorithm Based on Type-2 Fuzzy Sets”, 2nd International Conference on Computer, Communication, Control and Information Technology( C3IT-2012). Rashmi,MukeshKumar, and RohiniSaxena(2013) has proposed an “Algorithm And Technique On Various Edge Detection ”Signal & Image Processing: An International Journal (SIPIJ) Vol.4, No.3,2013 ShashankAraokar(2012) “Visual Character Recognition using Artificial Neural Networks ”International Journal of Computer Science, Engineering and Applications (IJCSEA)Vol.2, No.4,2012 Shrivakshan G T, Dr.C. Chandrasekar(2012) “A Comparison of various Edge Detection Techniques used in Image Processing”, IJCSI International Journal of Computer Science Issues, Vol. 9, Issue 5, No 1,2012 StaalJ,Abramoff M D, NiemeijerM,Viergever M A and van Ginneken B(2004), “Ridge-based vessel segmentation in color images of the retina,” IEEE Transactions on Medical Imaging, vol. 23, no. 4, pp. 501– 509,2004 VivekShrivastava and NavdeepSharma(2012) “artificial neural network based optical character recognition” Signal & Image Processing: An International Journal (SIPIJ) Vol.3, No.5,2012 Youssef EsSaady, Ali Rachidi, MostafaYassa, DrissMammass (2011) “Amazigh Handwritten Character Recognition based on Horizontal and Vertical Centerline of Character” International Journal of Advanced Science and Technology Vol. 33,2011
© www.ijarcsse.com, All Rights Reserved
Page | 345