Rincon and Perez
Discret-event Simulation Software Decision Support Venezuelan Oil Industry
Discrete-event Simulation Software Decision Support in the Venezuelan Oil Industry Gladys Rincon Universidad Simon Bolivar
[email protected]
Maria Perez. Universidad Simon Bolivar
[email protected]
ABSTRACT
A successful technological transfer requires a proven manpower and information input of the resources and needs of the recipient organization. Applying the above framework to the logistics area of the petroleum industry, the use of discreteevent simulation software is required to properly simulate these systems. This kind of software has a wide market demand, which means that a selection process is necessary. This research proposes an evaluation and selection process of the IT from a technological viewpoint, specifically concentrating on the discrete-event simulation software that is going to be acquired by the Venezuelan oil industry. The applicability of the Systemic Quality Model-SQMO+ was successfully run in the evaluation of the discrete-event simulation software, this evaluation showed that three commercial software complied with the minimum technical requirements established in this research. This process enabled the choice of the best software from a technological standpoint. Keywords
Discrete-event simulation software; technological transfer; oil industry; systemic quality INTRODUCTION
Pavón and Hidalgo (1999) state that it is utterly impossible for organizations to keep up with the fast pace of technological change and complexity. Additionally, Paredes (1991) states that organizations in developing countries have either the tradition or the know-how to develop state-of-the-art technologies. Therefore, the technological transfer from developed nations becomes an imperative. As it has been stated in the opening paragraph, a viable technological transfer requires substantial information of the resources available and specific needs of the recipient organization (Avalos, 1989). Information technology (IT), as a technology, does not escape this fact. Rojas, Mendoza and Perez (2001), reveal that many organizations have the common practice of underestimating or ignoring important aspects in the selection and use of the IT they acquire. This practice leads to wrong choices, which incurs in financial loss. Kavi and Nahouraii (1996), state that designing the criteria to evaluate the IT and rating its benefits is a very difficult question. Nikoukaran, Hlupic and Paul (1999), cite that to have a successful IT evaluation requires the existence of a list of criteria based on a decision model, so that the maximum rationality in the technological transfer operation is guaranteed. Avalos (1989) states that technology evaluation and selection must be done from different points of view, which are not mutually exclusive, albeit complementary, with no perceptible distinction among them. The evaluation must include social, financial and technological aspects, and also including the provider. According to Hlupic (1999) there exists in the market a wide range of high quality simulation software packages. This makes the selection and purchase of a simulation package difficult. Additionally, this kind of software when it is going to be used\as a decision support tool has to have a great number of specific attributes. These have (as yet) not been clearly identified adding to this that it is still unclear how to quantify the quality and importance of these attributes. Furthermore, the adoption of this kind of software has as a primary aims the technological aspects. Therefore, this research proposes an evaluation and selection process of the IT from a technological standpoint, specifically concentrating on the discrete-event simulation software that is going to be acquired by the Venezuelan oil industry. The evaluation process rests on a systemic quality model specific for this kind of software. This paper is outlined as follows: the first section briefly describes the kind of enterprise and the specific area within it where the proposal was applied. The second part presents the Systemic Quality Model-SQMO+ as specific software that evaluates discrete-events. The third section deals with the evaluation process seen from a technological viewpoint. The last section explains how the selection is made, followed by the conclusions of the research paper. Proceedings of the Tenth Americas Conference on Information Systems, New York, New York, August 2004
538
Rincon and Perez
Discret-event Simulation Software Decision Support Venezuelan Oil Industry
THE VENEZUELAN OIL INDUSTRY
An affiliate to the Venezuelan oil industry that provides the guidelines for the investment planning, maximization of ancillary facilities, and cost reduction, is in charge of the evaluation and selection of the IT. The IT is used specifically in the logistics of the Venezuelan oil industry. In the oil industry the term “logistics" is referred to the working capital and goods related to the handling and distribution of hydrocarbons; these include the use of pipelines, polyducts, tanks, transport fleets (tankers, containers, etc), terminals and storage. This ''logistics'' is a very complex operation which requires capital investments. As an example of the substantial cost of logistics (excluding the cost regarding raw material), which is one of the most significant areas in the value chain of the oil industry, one source estimates that it lies within the 15-25% of the product cost. Furthermore, the same source states that the goods devoted to the "logistics" , whether internal or contracted, can exceed 30% of the total goods of the process companies (Erzinger and Norris 2000). Falconer and Guy (1998) estimate that, within the investment projects of the oil industry, approximately 40-50% of the total capital investment is applied to process and logistics ancillary facilities. The logistics of the oil industry deals with the arrival and departure of oil tankers to and from seaports for loading and unloading purposes. This is a perfect example in which a series of random factors interact, and, as a result, produce probabilistic phenomena and event occurrences that escape time periodicity. The collection of these independent occurrences are known as “discrete-events”. Concurrently to the above phenomena, these procedures involve “continuous-operations” such as the filling and emptying of tanks, the transfer of crude and products through oil pipelines and polyducts and other secondary related tasks. Complex systems such as these require the support of some kind of software that makes their simulation possible. The discrete-event simulation software has the quality to recognize discrete and continuous variables, it shall be referred to by its acronym DESS-c. To evaluate the quality of this technology, a list of evaluation criteria is imperative. This complies with the requisite previously stated that all the important context information is necessary in order to achieve a successful technological transfer. SYSTEMIC QUALITY MODEL – SQMO+
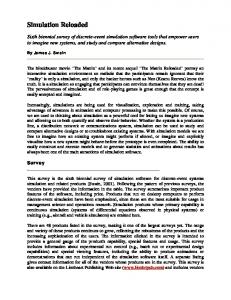
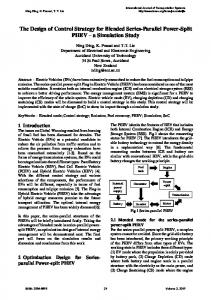
The Systemic Quality MOdel (SQMO) (Mendoza, Perez, Griman and Rojas, 2002) was developed in the year 2001 by Universidad Simón Bolívar (Venezuela). Since then, the University has adopted the SQMO for software evaluations. SQMO takes the best from Dromey (1996); ISO/TEC 9126 (1998) and ISO/IEC 15504-2 (1998). The research carried out by Ortega Perez and Rojas (2003); Diaz, Perez, Mendoza and Grimán (2002); and Martin (2003), is an example of a successful implementation of SQMO. The SQMO is aimed at estimating the systemic quality within an organization engaged in software development. It is based on the systemic quality model proposed by Callaos and Callaos (1996). Systemic Quality MOdel + (SQMO+) (Rincon, Alvarez, Perez and Hernandez, 2003) is an adaptation of the SQMO. The purpose of the SQMO+ is to specify the systemic quality of the discrete-event simulation software. This model has the added advantage of also evaluating the software’s capacity in simulating continuous operations. One of the limitations of SQMO and SQMO+ is that it does not account for social and financial aspects because it evaluates only software technical specifications. The SQMO+ outline is shown in Figure 1. Level 0: Dimensions. It is formed by the Product Effectivity dimension. For this Dimension level, Effectivity measures the quality between the obtained and the obtainable. Combining this definition with Product, the result is Product Effectivity, whose aim is to measure the quality of the software in the context under which it is run. It is very important to evaluate the software´s quality characteristics in its running time; it has to be added, that for this task, only the manuals and demo versions provided by the vendors were used. Level 1: Categories. According to Mendoza et al (2002), the starting point of the application of SQMO for Level 1 is the FUNCTIONALITY category. On the other hand, the stakeholders decided that the USABILITY and EFFICIENCY categories were the most important, and as such, had to be present in the software to be evaluated. The categories are defined as follows (Rincon et al, 2003): FUNCTIONALITY refers to the capacity of the software to provide specific functions. USABILITY refers to features of the software offering a friendly user interface, easily
understood and learnt by the user under specific conditions. EFFICIENCY refers to the ability of the software to provide a consistent performance in relation to the resources used. Proceedings of the Tenth Americas Conference on Information Systems, New York, New York, August 2004
539
Rincon and Perez
Discret-event Simulation Software Decision Support Venezuelan Oil Industry
Figure 1. Diagram of the Systemic Quality Model (SQMO+)
Level 2: Characteristics. Each category has a set of characteristics that define key areas that must be complied with in order to ensure and control their quality.
The characteristics that evaluate the FUNCTIONALITY category are the following: Fit to Purpose (FPU). This characteristic assesses whether the software is capable of providing a proper set of features according to the user-specific tasks and goals. Interoperability (INT). This characteristic evaluates the ability of the DESS-c to interact with one or more systems. Security (SEC). This characteristic evaluates if the software is capable of protecting information so that unauthorized persons cannot access it but only authorized persons or systems The following are the characteristics of the USABILITY category: Ease of understanding and learning (EUL). This characteristic assesses the software’s ability to make it easier for the user to understand and to use the software. It also evaluates the facilities that enable the user to learn the application Graphical Interface (GIN). This characteristic is associated to those software attributes that render it more attractive for the user, such as the use of color and the nature of the graphic design Operability (OPR). This characteristic evaluates if the software is capable of enabling the user to operate it and control it The characteristics that evaluate the EFFICIENCY category are as follows: Execution Performance (EPE). This characteristic is used to assess if the software is capable of providing proper responses and processing times under specific conditions. Resources Utilization (RUT). This characteristic is aimed at evaluating if the software uses the resources properly when it is performing its functions under specific conditions. Level 3. Sub-characteristics. SQMO+ has 40 sub-characteristics. Each characteristic has its set of sub-characteristics arranged in the following manner: FUNCTIONALITY: 22 sub-characteristics evaluate the Fit to Purpose characteristic, 3 sub-characteristics evaluate Interoperability, and 1 sub-characteristic evaluates Security. USABILITY: Ease of Understanding and Learning is evaluated by 5 sub-characteristics, 2 sub-characteristics evaluate Graphical Interface, and Operability is evaluated by 3 sub-characteristics.
Proceedings of the Tenth Americas Conference on Information Systems, New York, New York, August 2004
540
Rincon and Perez
Discret-event Simulation Software Decision Support Venezuelan Oil Industry
EFFICIENCY: 2 sub-characteristics evaluate the Execution Performance characteristic, and Resources Utilization is evaluated by 2 sub-characteristics.
Level 3: Metrics. When the product quality is estimated, each sub-characteristic has its own set of metrics, which are related
to attributes of the software to be evaluated. SQMO+ is formed by 131 metrics that estimate the quality of the 40 subcharacteristics. The 131 metrics are distributed as follows: 66% correspond to the FUNCTIONALITY category, 29% belong to the USABILITY category, and the EFFICIENCY category has the remaining 5% metrics. Three of the 22 sub-characteristics that evaluate the Fit to Purpose characteristic are shown in Table 1 with its corresponding metrics. The Table shows how the sub-characteristics from FPU15 to FPU17 explore the facilities provided by the software to execute certain phases involved in simulation projects. The sub-characteristic Experimentation (FPU15), assesses the possibility of conducting simulation experiments. The sub-characteristic Output statistical analysis (FPU16), assesses the software capability to perform statistical data analysis. Its metrics examine if the software automatically calculates: a) statistics for selected elements; b) statistics for multiple run outputs; c) confidence interval; and d) goodness of fit. The subcharacteristic Cost Analysis (FPU17), is related to the calculation of the operating costs of the system represented in the model. It only has one metric that measures the possibility of automatically determining these costs. For more detailed information about other sub-characteristics, see Rincón et al (2003). Tags
Sub-characteristics
FPU 15 Experimentation
FPU 16
Output statistical analysis
FPU 17 Cost Analysis
Tags
Metrics
importance-level
FPU 15 1 Specifying initial model conditions.
4
FPU 15 2 Specifying model warm-up period.
4
FPU 15 3 Replications of simulation runs. FPU 15 4 Sensitivity analysis.
2
FPU 15 5 Automatic optimization of model parameters.
3
FPU 16 1 Automatic calculation of statistics for selected elements.
5
FPU 16 2 Automatic calculation of statistics for replications FPU 16 3 Confidence intervals estimation.
3
FPU 16 4 Goodness of fit test.
3
FPU 17 1 Automatic calculation of the operating costs.
3
Table 1: Fit to purpose Characteristic - Example of Sub-characteristics and Metrics assessed by SQMO+
The sub-characteristic Support and training (EUL05) that evaluates the Ease of understanding and learning characteristic is described in Table 2. It is related to the support and training offered by the provider. Its metrics assess the availability of introductory and advanced training courses, as well as the availability of training courses tailored to meet the requirements of an organization. Other metric explore alternatives available for technical support and the response time of the provider. This aspect has to be considered when evaluating the provider since SQMO+ is essentially technical, all other non-technical aspects is province of the management. Tags
EUL 05
Sub-characteristics
Support and training
Tags
Metrics
importance-level
EUL 05 1 Availability of introductory training courses.
5
EUL 05 2 Availability of advanced training courses.
4
EUL 05 3 Availability of tailor-made training courses. EUL 05 4 Phone technical support.
5
EUL 05 5 On-line support.
5
Table 2: Ease of understanding and learning Characteristic - Example of Sub-characteristics and Metrics assessed by SQMO+ Proceedings of the Tenth Americas Conference on Information Systems, New York, New York, August 2004
541
Rincon and Perez
Discret-event Simulation Software Decision Support Venezuelan Oil Industry
EVALUATION FROM A TECHNOLOGICAL STANDPOINT
The evaluation from a technological perspective takes into account three aspects: the first is the technology quality, the next one is the favorable adoption of the technology by the company, and the last one is the impact it has within the company (Avalos, 1989). The proposed evaluation process assesses the kind of organization and the area of application. Additionally, the IT under study is favorable to the situation of the Venezuelan oil industry, since this type of software reinforces the decision-making in the areas of investment planning and logistics optimization. The following objectives are established: 1) the application of the software in the logistics area, 2) the particular aims of the organization. This process of evaluation requires the creation of two multidisciplinary work-teams: the Analysis and Selection Team on one hand, and the Experts Team on the other. The first team is responsible for executing the evaluation and selection of the software. Venezuelan oil experts and simulation consultants make up the other group. In this context, the metric that has a compulsory quality is defined as Mandatory, while the Non-Mandatory metric is only desirable. The definition of which metrics are Mandatory is strictly related to the Venezuelan oil industry. It was established, through the valuable assessment of the Experts Team, that out of a total of 131 metrics, 77 are Non-Mandatory (59%), and 54 are Mandatory (41%). As an example, the Mandatory metrics are highlighted in gray in both Tables 1 and 2. The “importance-level” defines the importance of one metric over another, withholding any value judgment of “best” and “worst”. The “importance-level” has only strict reference to the Venezuelan oil industry. The Experts Team established the ”importance-level” for each Non-Mandatory metric using the Lickert type scale, which gives “1” point to the “minimum importance”, and “5” points to the “maximum importance” (Tables 1 and 2). With the aim of saving time and money, a screening was made to reduce the software that is to be evaluated. The survey developed by Swain (1999) was taken as a starting point for this study. The vendors based upon a survey of important product features, price and platform provided the information survey. This procedure identified 46 software that are contained in the Long List (LL). This exhaustive examination identified the following requirements. a) fields of application and use, b) capability of modeling discrete and continuous systems; c) exclusion of libraries and languages. The process of screening reduced to five the number of software that complied with the three requirements. This number of software is identified as the Medium List (ML). The existence of the Mandatory metrics pertaining to the ML software was analyzed. Of the five software that remained, only one lacked at least one of the required metrics and it was automatically excluded from the list. Subsequently, a Short List (SL) was formed with the remaining four software which complied with all the Mandatory metrics, these will be identified as software A, B, C, and D, for safe guarding confidentiality of the licensor. The four software contained in the SL were evaluated by means of the Non-Mandatory metrics. The result of this evaluation was quantified by means of an algorithm that converts the responses obtained from SQMO+ into "values" which follow a rating scale assigned to each metric. The following algorithm quantifies the assessments of the evaluation. • • • •
Multiply the “value” by the “importance-level” of its metric. The product obtained is the given value of the metric of its sub-characteristic. The products are added to estimate the score of each category evaluated. The percentage parameter defined as Quality Rate is calculated by dividing the total value obtained by the software in each category by the total maximum value that the software could have reached in this category.
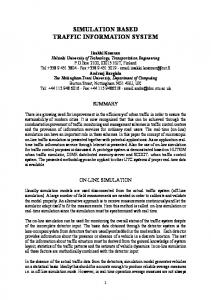
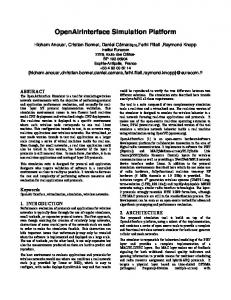
From 77 Non-Mandatory metrics, the four remaining DESS-c obtained the same evaluation “value” in 37 metrics. The study was made with the 40 remaining metrics, where at least one DESS-c produced a different evaluation “value”. The performance of the four software in the EFFICIENCY category was 100% conclusive. As a result, this category was excluded from this analysis. The four software contained in the SL have the capacity to be adequately installed and run in the technological platforms commonly used in the oil industry, therefore, all of them guaranteeing a satisfactory performance. Figure 2 shows the Quality Rates for each of the four evaluated software. The Figure shows that in the FUNCTIONALITY category, the B, C, and D software present Quality Rates with near and high values to each other (70-77%), which means that they gather a great number of functions demanded from a software by the logistics of the Venezuelan oil industry; the A software presents a low Quality Rate (38%).
Proceedings of the Tenth Americas Conference on Information Systems, New York, New York, August 2004
542
Rincon and Perez
Discret-event Simulation Software Decision Support Venezuelan Oil Industry
The B software stands out among the rest in the USABILITY category and this may clearly be seen in Figure 2. This prominence is due to attributes related to the ease of use and understanding of its functions, operations and concepts, for its on-line support, and for the inclusion of a great number of model examples related to the logistics of the oil industry. Due to the fact that software A scored below 50% (38% FUNCTIONALITY and 47% USABILITY) in both Quality Rate categories, they were discarded from the list. All future analyses will exclude this software. The information obtained from the Quality Rate, established that software B, C, and D, complied with the minimum technical requirements demanded by the Venezuelan oil industry. 100%
Quality Rate
90%
81%
77%
80%
71%
70%
70%
60%
40%
53%
47%
50%
38%
38%
30% 20% 10% 0%
Functionality A
Usability B
C
D
Figure 2: Quality Rate THE IT SELECTION FOR THE VENEZUELAN OIL INDUSTRY
To obtain the IT appropriate, a Sensitivity Analysis was proposed, because it provides the key elements for the selection of the software, ratifies the consistence of the evaluation process and produces the essential information to settle the hierarchy of the software. The Sensitivity Analysis was grounded on three selection strategies: • Weighed Global Quality Rate strategy. This strategy will be identified by its acronym in capital letters as WGQR. • Results Consistency strategy. This strategy will be identified by its acronym in capital letters as RC. • Generic Functions strategy. This strategy will be identified by its acronym in capital letters as GF. The WGQR strategy analyses the behavior of the software within the hierarchy when it quantifies the influence of the "Weight" assigned to each category, FUNCTIONALITY and USABILITY. The WGQR is estimated as a function of the Quality Rate and of the "Weights" of the categories. The WGQR is defined as follows:
(
WGQR = ∑ QR i × Weight i i
FUNCTIONALITY
and
USABILITY
)
where, QR i
Quality Rate in category i (i = FUNCTIONALITY, USABILITY)
Weight i
“Weight” of the category (i = FUNCTIONALITY, USABILITY)
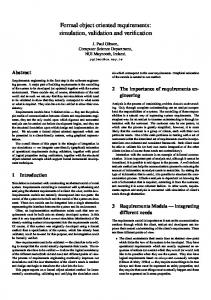
The "Weights" of the two categories should sum 100% Figure 3 illustrates the WGQR results for the three software, for the two categories. The Figure indicates that the WGQR runs along the y axis, and along the x axis the "Weights" of the FUNCTIONALITY and USABILITY categories are represented in complementary scales. The FUNCTIONALITY category increases from left to right (from 0% to 100%); the USABILITY category increases in the opposite direction, from right to left.
Proceedings of the Tenth Americas Conference on Information Systems, New York, New York, August 2004
543
Rincon and Perez
Discret-event Simulation Software Decision Support Venezuelan Oil Industry
In Figure 3 it can be seen that software B maintained its first place in the hierarchy, independently of the variation of the "Weight" assigned to the FUNCTIONABILITY and USABILITY categories. Additionally, the hierarchy of the software was stable between 0 and 90% FUNCTIONALITY. As a result, the order in the hierarchy was settled with software B in the first place, followed by software D and C respectively. 100%
Weighed Global Quality Rate
90% 80% 70% 60% 50% 40% 30% 20% 10% 0% 0%
10
20
30
40
50
60
70
80
90
10
Func tiona lity We ig ht Us a bility We ig ht
A
B
C
D
Figure 3: WGQR strategy RC strategy. This is a comparative strategy that aims at analyzing whether the order in the software hierarchy is maintained
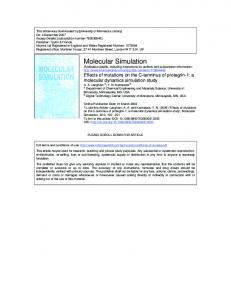
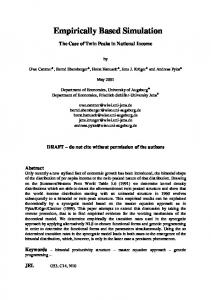
under variations made in the "importance-level" assigned to the Non-Mandatory metrics. For this purpose, the "importance-level" was modified in the following three scenarios: Imp 5, Imp 5&4, and Imp 3, respectively. • Imp 5 scenario: The object is to maintain in 5 the "importance-level" of the metrics whose value is 5, and assign the value of 1 to the rest. This strategy proves whether the software obtains the rating based on the high estimations in the metrics with "importance-level" 5. • Imp 5&4 scenario: The aim is to keep in 5 the "importance-level" of the metrics whose value was 5, maintain in 4 those whose " importance-level " was 4, and assign the value of 1 to the rest of the metrics. This strategy shows whether the software obtains the rating based on the high evaluations in the metrics with "importance-level" 5 and 4. • Imp 3 scenario: Maintain in 3 the "importance-level" of all the metrics. This comparative RC strategy requires a reference case. This case is named "50-50 Case". The "50-50 Case" shows the “importance-level” for the Non-Mandatory metrics established by the Experts Team. When the WGQR is applied, the "Weight" of each category must be assigned. The same "Weight" was assigned to each category. Figure 4 illustrates the comparison between the three scenarios and the "50-50 Case". It also indicates how the software B maintains its first place, independently of the "importance-level" assigned to the attributes, and besides, the order in the hierarchy of the three software remained the same. GF strategy. This strategy aims to analyze the quality of the software in relation to generic functions. To achieve this, the Quality Rates for the category FUNCTIONALITY will have to be re-calculated by excluding the Non-Mandatory metrics FPU11 at FPU14 (Rincon et al, 2003). These metrics evaluate the software capability of working directly with continuous operation.
To effectively study how the rank order of the software behaves regarding GF strategy, the WGQR is plotted in connection with the “Weight” variation of the FUNCTIONALITY and USABILITY categories (Figure 5). Proceedings of the Tenth Americas Conference on Information Systems, New York, New York, August 2004
544
Rincon and Perez
Discret-event Simulation Software Decision Support Venezuelan Oil Industry
Weighed Global Quality Rate
100% 90% 80%
86%
83%
79%
70%
62%
60%
55%
55%
55%
Imp5&4
Imp3
50%
50%
68%
64%
59%
58%
40% 30% 20% 10% 0%
50- 50 Ca se
Imp5
B
C
D
Figure 4: RC strategy
After analyzing Figure 5 reveals below 80% for the FUNCTIONALITY category, the established order is maintained. The Sensitivity Analysis demonstrated that the behavior of the software is stable under variations done to the “Weights” of both categories, under modifications made in the “importance-level” assigned to the metrics, and also when excluding the software’s capacity to simulate continuous operations. However, before making a final recommendation, the Selection Team deemed convenient to analyze the purchase cost impact of the software. A search of the approximate costs related to the purchase of the DESS-c was performed. This search established that the cost of the three DESS-c were similar and by no account was there to be expected a reversal in the order of the established preferences, unless substantial price reductions could be obtained in the later stages of this evaluation. The cost analysis does not consider the software implementation and maintenance cost. 100% 90%
Weighed Global Quality Rate
80% 70% 60% 50% 40% 30% 20% 10% 0% 0%
10
20
30
40
50
60
70
80
90
10
Func tiona lity We ig ht Us a bility We ig ht
A
B
C
D
Figure 5: GF strategy Proceedings of the Tenth Americas Conference on Information Systems, New York, New York, August 2004
545
Rincon and Perez
Discret-event Simulation Software Decision Support Venezuelan Oil Industry
REFLECTIONS UPON LESSONS LEARNED
These comments are the product of this research, which concentrated on the evaluation and selection process of a software package applied to a case study. • The experience enabled to gather a set of characteristics that specify the quality of the DESS-c. This set of characteristics (SQMO+) is transferable to any Latin American organization that is in need of selecting a discrete-event simulation software. • SQMO+ allows to assess the characteristics that define the quality of the software, the sensitivity analysis complements this process. The sensitivity analysis is the process that supports the selection. The evaluation and sensitivity analysis combined as a process, may well be used by other organizations when faced with this kind of decision problem. • The proposed evaluation and selection process from the technological standpoint was formulated in such a way as to make possible its application in order to decide on the acquisition of a quality software, that adjusts to the needs of an area and organization in particular. • This method is considered systemic, since it includes in its framework the surrounding context. As an example we mention a couple of variables such as: a) which metrics are to be Mandatory and which Non-Mandatory; and b) which is to be the “importance-level” of the Non-Mandatory metrics. These variables are function of the organization and application area. The proposed method can bear a contextual decision-making. CONCLUSIONS
The research shows that its proposal can support the technical selection of the IT that best adapts to the situation of the Venezuelan oil industry. The Systemic Quality Model SQMO+ showed its applicability to evaluate discrete-event simulation software. To have a successful technological transfer, the evaluation and selection of the IT has to be made from a technological standpoint that includes the organization´s needs and specific area of application. The software evaluation and selection process proposed is transferable to any Latin American organization that requires the selection of a discrete-event simulation software. The proposed model operates contextual decision-making situations. This IT selection and evaluation process was applied for the selection of the discrete-event simulation software in the logistics area of Venezuelan oil industry. The three commercial software, complied with the minimum technical requirements established in this research. Additionally, the proposed method selected the best software among the three competitors. In future research SQMO will include social and financial aspects which are not currently assessed. The financial aspect will consider Milis and Mercken (2004) methodology. ACKNOWLEDGEMENTS
This research was sponsored by and conducted with the aid of the Research Deanship of the Universidad Simón Bolívar through the project Herramientas de Soporte en Logística para la Industria Petrolera (DI-CAI-004-02) and Intevep-PDVSA. The authors wish to thank the vendors who kindly provided demos and documentation of their products and who took part in the development of the case study. REFERENCES
1. Avalos, I. (1989) El Desarrollo Tecnológico Como Soporte del Desarrollo Industrial. Estrategias, Planificación y Gestión de Ciencia y Tecnología. Editorial Nueva Sociedad. 2. Callaos, N. and Callaos, B. (1996) Designing with a Systemic Total Quality, Proceeding of the International Conference on Information Systems Analysis and Synthesis, ISAS, 15-23. 3. Díaz, G., Perez, M., Mendoza, L. and Grimán, A. (2002)Ampliación de MOSCA para la Evaluación de Software Educativo. LII Convención Anual de AsoVAC, Venezuela, 53, 1, 361-362. 4. Dromey, G. (1996) Comering the Cimera, IEEE Software, 33-43. 5. Erzinge,r F. and Norris, M. (2000) Meeting the e-Chain Challenge: The Catalyst for Large Scale Change, Technical Report CC-00-157, NPRA Computer Conference, Chicago. 6. Falconer, D. and Guy, B. (1998) Trully Optimal Offsite, The Chemical Engineer, 28-33. Proceedings of the Tenth Americas Conference on Information Systems, New York, New York, August 2004
546
Rincon and Perez
Discret-event Simulation Software Decision Support Venezuelan Oil Industry
7. Hlupic, V. (1999) Discrete-Event Simulation Software: What the Users Want, Simulation, 73:6. 362-370. 8. ISO/TEC 9126 1.2. (1998) Information Technology–Software Product Quality, Part 1, Quality Model, ISO/IEC JTC1/SC7/WG6. 9. ISO/IEC TR 15504-2. (1998) Information Technology–Software Process Assessment, Part 2, A Reference e Model Processes and Process Capability, Canada, ISO/IEC JTC 1/SC 7. 10. Kavi, K. and Nahouraii, E. (1996) Software Tools Assessment. IEEE Software, 23-26. 11. Martín, C.(2003) Propuesta de Modelo Sistémico de Calidad de Software (MOSCA) en la Dimensión Usuario-Cliente. LISI – USB / Universidad Católica Andrés Bello. Venezuela. 12. Mendoza, L., Perez, M., Griman, A. and Rojas, T. (2002) Algoritmo para la Evaluación de la Calidad Sistémica del Software, 2das. Jornadas Iberoamericanas de Ingeniería del Software e Ingeniería del Conocimiento (JIISIC 2002), Brasil, 1-11. 13. Milis, K. and Mercken, R. (2004) The use of the Balanced Scorecard for the Evaluation of Information and Communication Technology Projects, International Journal of Project Management, 22:2. 14. Nikoukaran, J., Hlupic, V. and Paul, R. (1999), Criteria for simulation software evaluation, Proceedings Winter Simulation Conference, Eds. D. Medeiros, E. Watson, J. Carson y M. Manivannan, Department of Information Systems and Computing of Brunel University. 399-406. 15. Ortega, M., Perez, M. and Rojas, T. (2003) Software Quality Journal, 11, 219-242. 16. Paredes, L. (1991) Gestión Tecnológica y Reconversión Industrial. Revista Espacios, 12: 3, 59-77. 17. Pavón, J. and Hidalgo, A. (1999) Gestión e Innovación. Un Enfoque Estratégico. Edición Pirámide, Madrid. 18. Rincon, G., Alvarez, M., Perez, M. and Hernandez, S. (2003) Modelo de Calidad (MOSCA+) para Evaluar Software de Simulación de Eventos Discretos, Proceedings of the IDEAS, Paraguay. 167-177. 19. Rojas, T., Mendoza, L. and Perez, M. (2001) Indicadores Organizacionales para Comparación de Herramientas CASE en Venezuela. Revista de la Facultad de Ingeniería de la UCV, 16: 1. 95-112. 20. Swain, J. (1999) Simulation Software Survey. INFORMS OR/MS Today, 42-51.
Proceedings of the Tenth Americas Conference on Information Systems, New York, New York, August 2004
547