3022 • The Journal of Neuroscience, February 29, 2012 • 32(9):3022–3031
Neurobiology of Disease
Disruption of Prefrontal Cortex Large Scale Neuronal Activity by Different Classes of Psychotomimetic Drugs Jesse Wood, Yunbok Kim, and Bita Moghaddam Department of Neuroscience, University of Pittsburgh, Pittsburgh, Pennsylvania 15260
In the absence of overt cellular pathology but profound perceptual disorganization and cognitive deficits, schizophrenia is increasingly considered a disorder of neural coordination. Thus, different causal factors can similarly interrupt the dynamic function of neuronal ensembles and networks, in particular in the prefrontal cortex (PFC), leading to behavioral disorganization. The importance of establishing preclinical biomarkers for this aberrant function has prompted investigations into the nature of psychotomimetic drug effects on PFC neuronal activity. The drugs used in this context include serotonergic hallucinogens, amphetamine, and NMDA receptor antagonists. A prominent line of thinking is that these drugs create psychotomimetic states by similarly disinhibiting the activity of PFC pyramidal neurons. In the present study we did not find evidence in support of this mechanism in PFC subregions of freely moving rats. Whereas the NMDA receptor antagonist MK801 increased PFC population activity, the serotonergic hallucinogen DOI dose-dependently decreased population activity. Amphetamine did not strongly affect this measure. Despite different effects on the direction of change in activity, all three drugs caused similar net disruptions of population activity and modulated gamma oscillations. We also observed reduced correlations between spike-rate and local field potential power selectively in the gamma band suggesting that these drugs disconnect spike-discharge from PFC gamma oscillators. Gamma band oscillations support cognitive functions affected in schizophrenia. These findings provide insight into mechanisms that may lead to cortical processing deficits in schizophrenia and provide a novel electrophysiological approach for phenotypic characterization of animal models of this disease.
Introduction Schizophrenia is associated with aberrant information processing in the prefrontal cortex (PFC) (Weinberger et al., 1986; Goldman-Rakic, 1994; Lewis, 1995; Andreasen et al., 1997; Artigas, 2010). The mechanism underlying this disruption is poorly understood. Psychotomimetic drugs are an important modeling tool in this regard because, despite acting on distinct groups of receptors, they similarly disrupt behavior. For example, serotonin (5HT)2A agonists produce hallucinations and sensory disturbances in humans, and hyperlocomotion and cognitive deficits in rodents (Bowers and Freedman, 1966; Vollenweider et al., 1998; Aghajanian and Marek, 2000; Gonza´lez-Maeso et al., 2007; Geyer and Vollenweider, 2008). Likewise, NMDA receptor antagonists and amphetamine produce schizophrenia-like symptoms in humans and aberrant locomotion and cognition in rodents (Snyder, 1976; Krystal et al., 1994). A prominent theory in the field is that, although these drugs act on different receptor and neurotransmitter systems, they all disrupt PFC information processing by disinhibiting pyramidal cells (Aghajanian and Marek,
Received Dec. 21, 2011; accepted Dec. 23, 2011. Author contributions: B.M. designed research; J.W. and Y.K. performed research; J.W. and Y.K. analyzed data; J.W., Y.K., and B.M. wrote the paper. This work was supported by the National Institute of Mental Health (B.M.), the Pittsburgh Life Sciences Greenhouse (B.M.), and the Andrew Mellon Foundation for a predoctoral fellowship (J.W.). The authors declare no competing financial interests. Correspondence should be addressed to Bita Moghaddam, University of Pittsburgh, Department of Neuroscience, A210 Langley Hall, Pittsburgh, PA 15260. E-mail:
[email protected]. DOI:10.1523/JNEUROSCI.6377-11.2012 Copyright © 2012 the authors 0270-6474/12/323022-10$15.00/0
2000; Lewis and Moghaddam, 2006; Gray and Roth, 2007a,b; Gonza´lez-Maeso et al., 2008; Gonza´lez-Maeso and Sealfon, 2009). Application of 5HT2 agonists (and serotonin) to medial PFC slices produces excitatory postsynaptic effects (Aghajanian and Marek, 1997; Marek and Aghajanian, 1999; Zhang and Marek, 2008) and increases discharge of medial PFC neurons projecting to midbrain areas in anesthetized animals (Puig et al., 2003). Likewise, NMDA antagonists increase the activity of PFC neurons (Jackson et al., 2004; Homayoun and Moghaddam, 2008). These findings have had important mechanistic implications for schizophrenia and drug target development (Marek and Aghajanian, 1998a; Moghaddam, 2003, 2004; Gray and Roth, 2007a; Gonza´lez-Maeso et al., 2008; Gonza´lez-Maeso and Sealfon, 2009). However, despite evidence of an excitatory role for serotonergic hallucinogens, they inhibit neurons in motor, orbitofrontal (OFC), and anterior cingulate (ACC) cortices of anesthetized animals (Ashby et al., 1989; El Mansari and Blier, 2005). More importantly, their impact on PFC discharge or local field potential (LFP) oscillations in awake animals is unknown. This is critical as the excitatory influence of NMDA receptor antagonists on PFC neurons is observed selectively in awake animals (Jackson et al., 2004; Homayoun and Moghaddam, 2007) but not slice preparations (Wong et al., 1986; Huettner and Bean, 1988). Here, we compared the effects of a serotonergic hallucinogen with other psychotomimetic drugs on PFC neuronal activity of freely moving rats, to determine whether they share a common cellular or network outcome. We measured neuronal activity in OFC and ACC, two regions implicated in the pathophysiology of
Wood et al. • Cortical Dynamics and Psychotomimetics
J. Neurosci., February 29, 2012 • 32(9):3022–3031 • 3023
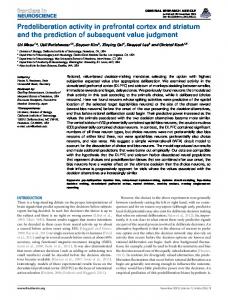
Figure 1. Experimental design, electrode array placement, and baseline activity. A, Examples of randomized drug delivery schedules, with 1 week washout between test sessions. Each recording session consisted of a drug-free 27 min baseline, followed by a 108 min postinjection period. Rats were administered one injection per session. B, Placement of electrodes in anterior cingulate or orbitofrontal cortices is shown.
schizophrenia (Heckers et al., 1998; Kopp and Rist, 1999; Carter et al., 2001; Alain et al., 2002; Weiss et al., 2003; Ragland et al., 2004). Animals were implanted with stationary electrode arrays and received the hallucinogenic 5HT2A/C agonist 1-(2,5dimethoxy-4-iodophenyl-2-aminopropane) (DOI), NMDA antagonist MK801, and amphetamine in a randomized design. We analyzed neuronal population activity, LFP power, and correlations between spike-discharge and LFP power. We find differential modulation of population activity but similarly reduced network integrity and decoupling of spiking and gamma power. These convergent outcomes are mechanisms by which diverse molecular factors may disrupt cortical function.
Materials and Methods Subjects and surgical procedure. Male Sprague Dawley rats (⬃400 g, Harlan) were housed on a 12 h light/dark cycle (lights on at 7:00 P.M.). Microelectrode arrays were implanted bilaterally in the OFC (n ⫽ 11 rats) or in the OFC and contralateral ACC (n ⫽ 6 rats) of isoflurane anesthetized rats, and secured with dental cement for chronic recording, as previously reported (Jackson et al., 2004). The following coordinates (Paxinos and Watson, 1998) were used (relative to bregma): ACC ⫽ ⫹3.0 mm anterior, ⫹0.5 mm lateral, ⫺ 2.2 mm ventral from skull; OFC ⫽ ⫹3.0 mm anterior, ⫹3.3 mm lateral, ⫺ 4.5 mm ventral. Recording sessions began after 7 d of postoperative recovery. At the completion of all recordings, rats were anesthetized with 400 mg/kg i.p. chloral hydrate and perfused with saline and 10% buffered formalin. Coronal slices of frontal cortex were taken from each brain and cresyl-violet stained. Locations of electrode arrays were confirmed via light microscope. Data from rats with incorrect placements were discarded from all analyses. All procedures were in accordance with the National Institute of Health’s Guide to the Care and Use of Laboratory Animals, and approved by the University of Pittsburgh Institutional Animal Care and Use Committee. Experimental design. Neuronal activity was recorded from freely moving rats in a clear polycarbonate home cage with bedding. Rats were habituated to all aspects of the recording process for 2 d. After a 30 min baseline recording, animals received an intraperitoneal injection of DOI, amphetamine, MK801 or saline vehicle. Neuronal activity was recorded for 120 min after injection. Multiple doses of ⫹/⫺DOI (1.0, 3.0, and 5.0 mg/kg) were used because this was the first electrophysiology study to examine the effects of this drug in awake PFC. Previous reports have demonstrated that similar doses of DOI produce psychotomimetic effects (Pranzatelli, 1990; Gewirtz and Marek, 2000; Zhang and Marek, 2008). The doses of MK801 (0.1 mg/kg) and amphetamine (2.0 mg/kg) were chosen based on previous studies showing a signif-
Table 1. Mean baseline discharge rate Drug
OFC
ACC
VEH DOI 1.0 DOI 3.0 DOI 5.0 MK AMP
3.87 ⫾ 0.53 4.05 ⫾ 0.47 4.30 ⫾ 0.51 3.82 ⫾ 0.44 4.77 ⫾ 0.55 3.87 ⫾ 0.60
6.98 ⫾ 1.05 5.84 ⫾ 0.87 5.38 ⫾ 0.74 5.73 ⫾ 1.02 6.29 ⫾ 0.89 6.30 ⫾ 0.91
The mean baseline firing rates of each sample of OFC (left) and ACC (right) units, in each recording session. Data are listed as mean and SE in units of hertz. There were no significant differences between population baseline discharge 2 2 rates within a region in any sample region (OFC, Kruskal–Wallis (5) ⫽ 6.107; ACC, Kruskal–Wallis (5) ⫽ 3.635; all p ⬎ 0.05).
icant influence on PFC single unit activity and PFC-dependent behaviors (Aultman and Moghaddam, 2001; Homayoun et al., 2004; Jackson et al., 2004; Moghaddam and Homayoun, 2008). Each drug was administered according to a random design with a 7 d washout between injections. Electrophysiology. Single unit activity and LFP were recorded simultaneously via bilateral eight-channel Teflon-insulated stainless steel 50 m microwire arrays (NB Laboratories). Unity-gain junction field effect transistor headstages were attached to a headstage cable and commutator that did not restrict the animal’s movement. Signals were amplified via a multichannel amplifier (Plexon). Spikes were bandpass filtered between 220 Hz and 5.9 kHz, amplified 500⫻, and digitized at 40 kHz. LFP was bandpass filtered between 0.7 Hz and 8 kHz, amplified 1000⫻, and digitized at 40 kHz. The digitized LFP recording was down sampled to 1 kHz. Single unit activity was then digitally high-pass filtered at 300 Hz and LFP were low-pass filtered at 125 Hz. Threshold crossing spike waveforms and LFP were stored for offline analysis. Single units were sorted using standard techniques and the Offline Sorter software package (Plexon). Single unit activity was only used if the neuron displayed a stable waveform throughout the session. Because each animal was allowed 1 week of washout between recording sessions, we chose to treat units recorded in different sessions as different units despite the fact that the same unit may have been serially recorded. This approach allowed for the most conservative assessment of unit identity. All units meeting these criteria were used in all single unit analyses. We did not remove putative fast-spiking interneurons from our samples as ⬍3% of neurons met criteria for putative fast-spiking interneurons. Furthermore, there was no correlation between baseline discharge rate and the direction of any drug effect (see Results). Data analysis. Analysis of single unit data was conducted with Matlab (MathWorks) and SPSS statistical software (IBM). The first 3 min of the
Wood et al. • Cortical Dynamics and Psychotomimetics
3024 • J. Neurosci., February 29, 2012 • 32(9):3022–3031
Table 2. Correlation of drug effect and baseline discharge rate OFC ACC Drug
Early
Late
Early
Late
VEH DOI 1.0 DOI 3.0 DOI 5.0 MK AMP
⫺0.21 ⫺0.08 ⫺0.02 0.11 0.21 ⫺0.07
⫺0.19 ⫺0.19 ⫺0.20 0.06 0.08 ⫺0.13
⫺0.33 0.15 ⫺0.26 ⫺0.35 0.08 ⫺0.02
⫺0.38 0.21 ⫺0.38 ⫺0.25 0.05 ⫺0.25
The correlation coefficient of each sample of OFC (left group of columns) and ACC (right group of columns) unit baseline discharge rates and postinjection responses. Data are listed as Spearman correlation coefficients. In each group, left column represents early postinjection bin and right column represents late postinjection bin.
30 min baseline were excluded to ensure a stationary baseline. The last 12 min of the postinjection period were excluded to yield a postinjection period four times longer than the 27 min baseline period (108 min) (Fig. 1 A). For all single unit analyses, 180 s bins were used. Differences in baseline firing rate between samples of units were assessed with Kruskal–Wallis tests. Single unit activity was Z-score normalized against the mean baseline firing rate. In some analyses, normalized activity was absolute value transformed to examine the net change in activity without respect to direction of change. Changes in population activity were assessed by computing the normalized mean baseline and postinjection activity of all units, during the baseline, and two 27 min bins following the injection (27–54 and 78 –105 min postinjection). These time periods were chosen because they generally contained stationary population and single unit activity levels. These periods were used for all statistical comparisons, although data from the entire experiment are displayed for clarity. Similar to previous reports, a unit was classified as significantly activated or inhibited if three or more consecutive bins exceeded a 95% confidence interval around the baseline mean (Homayoun et al., 2005; Homayoun and Moghaddam, 2007). The stringency of these criteria was verified by bootstrap analysis of the baseline activity (10,000 samples; expected false-positive rate ⫽ 0.002). These criteria for classification were chosen to be sensitive to a wide range of changes in discharge rate, although it should be noted that the majority of drug-induced changes in discharge rate were of longer duration. We assessed the cross-correlation in spike-discharge between each pair of simultaneously recorded unit pairs within each region. For this analysis, spike counts were quantified in 10 ms bins, inside a 200 ms window centered on the reference spike. A pair was classified as having a significant response if three consecutive bins of the resulting cross-correlation function exceeded a 99% confidence interval of the expectation under the assumption of a Poisson distribution. In rats with implants in both OFC and ACC, LFP data were analyzed using customized Chronux (http://www.chronux.org) routines (Mitra and Bokil, 2008). LFP voltage traces were Fourier transformed inside of a sliding time window of 4 s, with 2 s steps. A standard multitaper approach was used (Mitra and Pesaran, 1999; McCracken and Grace, 2009) in which nine tapers were applied to each window. Power spectra were calculated from the multitapered Fourier transformations and spectral data in each frequency bin were Z-score normalized against the baseline period, and each animal’s data were averaged together to yield group mean spectral data. Each animal’s spectral power during the baseline and two postinjection bins (27–54 and 78 –105 min postinjection) was used for statistical comparisons. To more accurately describe the modulation of power in the gamma band, we divided gamma into low (30 –55 Hz) and high (55– 80 Hz) gamma bands for all analyses. We assessed the relationship between gamma power and single unit discharge rate with a Pearson correlation. Each unit’s discharge rate and the simultaneously recorded high and low gamma band power were correlated across nine consecutive 180 s bins. The correlation coefficient of each unit was transformed to a Fisher’s Z score. Normalized correlation coefficients were averaged to yield a population mean correlation during the baseline, early postinjection, and late postinjection period. While correlations between units are often strongly associated with single unit and gamma power correlations, we did not factor between unit correlations into our calculations.
Figure 2. Modulation of unit activity in OFC and ACC. A—L, The normalized activity of OFC (A–F ) and ACC (G–L) units before and after injection. Baseline activity is normalized to zero, and injection occurred at time ⫽ 0. Each row depicts an individual unit and units are sorted by direction and magnitude of change. The administered drug appears to the left of each row of color plots. Color scale for A–L appears at right. The total number of units (n) recorded from each rat ( N), are listed below for each injection group. DOI 1.0, 3.0, 5.0 mg/kg; OFC: n ⫽ 97, 77, 91. N ⫽ 12, 11, 12. ACC: n ⫽ 27, 33, 36. N ⫽ 5, 6, 6. MK801 0.1 mg/kg; OFC: n ⫽ 91, N ⫽ 12. ACC: n ⫽ 24, N ⫽ 4. AMP 2.0 mg/kg; OFC: n ⫽ 86, N ⫽ 12. ACC: n ⫽ 27; N ⫽ 6. VEH control; OFC: n ⫽ 88, N ⫽ 11. ACC: n ⫽ 30, N ⫽ 4. Note that each drug group was associated with both increases and decreases in activity level. Statistical testing of LFP power and single unit population data followed the same procedure. Interactions between drug groups and time were assessed with two-way repeated-measures ANOVA for both OFC and ACC. One-way between groups ANOVA was used to detect differences between each drug group in a given time bin (baseline, early, or late postinjection). Post hoc analyses were done with protected Fisher’s LSD tests. For each drug group, one-way repeated-measures ANOVA was used to determine whether postinjection time points were significantly different from baseline. For all tests, the Greenhouse–Geisser correction was applied as necessary. Statistically significant differences in baseline firing rate between samples were assessed with Kruskal–Wallis tests. Spearman rank-order correlation was used to assess the relationship between postinjection activity and baseline discharge rate. Pearson correlation was used to assess the relationship between dose of DOI and neuronal activity. For single unit data, differences in the distribution of responses (activated, inhibited, or no change) between drug and vehicle samples were assessed with a 2 test of independence. A similar procedure was used to assess modulation of the proportion of units with a significant cross-correlation. All ␣ levels were set to 0.05.
Results Distinct effects of DOI, MK801, and amphetamine on unit activity of prefrontal cortex neurons Drugs were administered in a randomized design (Fig. 1A). In total, 527 OFC and 177 ACC units were recorded from histologically verified electrodes (Fig. 1B). There was no difference in mean baseline
Wood et al. • Cortical Dynamics and Psychotomimetics
J. Neurosci., February 29, 2012 • 32(9):3022–3031 • 3025
majority of units tested and produced significant differences in the distribution of responses compared with vehicle (Fig. 3B; 3.0 2 2 mg/kg, (2) ⫽ 31.240; 5.0 mg/kg, (2) ⫽ 25.582, all p ⬍ 0.001). The higher doses (3.0 and 5.0 mg/kg) produced similar proportions of inhibited neurons (Fig. 3B). The effect of DOI on suppressing OFC population activity was consistent throughout the recording session (Fig. 3C), and dose was negatively correlated with the early and late postinjection effect (early, r ⫽ ⫺0.245; late, r ⫽ ⫺0.145). ACC population activity was suppressed by DOI in a similar fashion. Unlike larger doses of DOI, the 1.0 mg/kg dose failed to produce a significant effect on population activity (Fig. 3D). Although 1.0 mg/kg produced activation in the majority of units with a significant response, there was no significant difference in the response distribution compared with vehicle (Fig. 3E). Larger doses of DOI reduced population activity. In the early postinjection bin, 3.0 mg/kg DOI reduced population activity compared with baseline (Fig. 3D; F(2,64) ⫽ 4.922, p ⫽ 0.010). The 5.0 mg/kg dose reduced ACC population activity at both early and late postinjection bins (Fig. 3D; F(2,72) ⫽ 16.769, p ⬍ 0.001). Suppression of activity by 3.0 or 5.0 mg/kg occurred in the majority of inFigure 3. OFC and ACC postinjection population activity. A, OFC mean normalized population activity from early and late dividual units (Fig. 3E). All doses of DOI postinjection periods. In each group, left bar represents early and right bar represents late postinjection period. Data are displayed produced a sustained effect on ACC popas mean and SE. Asterisks indicate statistically significant difference compared with drug-free baseline. Number signs (#) indicate statistical significance relative to vehicle control. Legend appears at right, center of figure. B, Proportion of OFC units in each ulation activity (Fig. 3F ). There was a negsample, which were classified as “activated” or “inhibited.” Solid colors indicate inhibited units and dashed bars indicate activated ative correlation between dose of DOI and units. Number signs indicate statistical significance compared with vehicle control group. C, The normalized OFC population activity ACC postinjection effect (early, r ⫽ before and after DOI or vehicle injection are shown. Data are displayed as normalized mean ⫾ SE (shaded area). Horizontal lines ⫺0.307; late, r ⫽ ⫺0.334). above abscissa indicate “early” and “late” postinjection periods. Injection occurs at time ⫽ 0 (dashed vertical line). D, ACC mean In contrast to the effects of DOI, normalized population activity. Format same as A. E, Proportion of activated or inhibited ACC units in each sample, which were MK801 increased population activity in classified as “activated” or “inhibited.” Format same as B. F, The normalized ACC population activity before and after injection. both brain regions (OFC, F (2,180) ⫽ 16.89; Format same as in C. Legend appears at right, center of figure. ACC, F(2,46) ⫽ 10.092; all p ⬍ 0.001) during both postinjection periods (Fig. discharge rate before administration of each drug (Table 1). There 3 A, D). The most common change in activity was activation, crewas no systematic correlation between single unit baseline firing ating significant differences in the MK801 and vehicle single unit 2 rates and the postinjection effect in any group (Table 2). Each drug response distributions (Fig. 3 B, E; OFC, (2) ⫽ 19.076, p ⬍ 0.001; 2 ACC, (2) ⫽ 7.851, p ⫽ 0.020). Amphetamine increased OFC evoked sustained changes in the activity of a subpopulation of units, population activity compared with vehicle only in the late postinjecwhereas vehicle was associated with weaker and more sporadic tion bin (Fig. 3A). Amphetamine nonsignificantly suppressed ACC changes in activity (Fig. 2A–L). In OFC and ACC, a significant inpopulation activity (Fig. 3D). The lack of strong effects on either teraction between drug group and time was detected (OFC, F(10,1076) ⫽ 11.497; ACC, F(10,350) ⫽ 7.188; all p ⬍ 0.001). These effects were population can be explained by the fact that amphetamine simultacaused by significant differences between drug groups during the neously increased the activity of many single units while decreasing two postinjection bins, but not the baseline period (OFC early bin, the activity of many others, cancelling out a population effect. In F(5,546) ⫽ 13.507; OFC late bin, F(5,546) ⫽ 11.611; ACC early bin, both regions, this resulted in significant differences in the distribu2 F(5,180) ⫽ 8.740; ACC late bin, F(5,180) ⫽ 7.856; all p ⬍ 0.001). tion of responses compared with vehicle (Fig. 3B,E; OFC, (2) ⫽ 2 In the OFC, 1.0 mg/kg DOI significantly reduced population 15.540, p ⬍ 0.001; ACC, (2) ⫽ 6.510, p ⫽ 0.039). Together, DOI mediated decreases in population activity that were distinct from activity compared with baseline in both postinjection bins (Fig. 3A; those of other psychotomimetic drugs. F(2,190) ⫽ 6.309, p ⫽ 0.008). Larger doses produced greater population suppression compared with baseline (3.0 mg/kg, F(2,156) ⫽ 17.618; 5.0 mg/kg, F(2,192) ⫽ 28.151; all p ⬍ 0.001) or vehicle (Fig. Similar levels of population disruption by DOI, MK801, 3A). These effects on population activity were echoed by the effects and amphetamine of DOI on individual units. While 1.0 mg/kg DOI did not strongly Given that each drug drove both increases and decreases in single affect the activity of many units, larger doses of DOI inhibited the unit activity and distinctly different patterns of population activ-
3026 • J. Neurosci., February 29, 2012 • 32(9):3022–3031
Wood et al. • Cortical Dynamics and Psychotomimetics
ity, we reasoned that their psychotomimetic nature may arise, in part, from the net disruption of self-organized activity levels. The normalized activity of each unit was absolute value transformed to examine disruptions of activity, without respect to the direction of the disruption (Fig. 4 A–D). In OFC and ACC, a significant interaction between time and drug was detected (OFC, F(10,1082) ⫽ 5.064, p ⬍ 0.001; ACC, F(10,350) ⫽ 3.093, p ⫽ 0.001). In both regions there were significant differences between drug groups in both postinjection periods (OFC early, F(5,541) ⫽ 6. 604, p ⬍ 001; OFC late, F(5,541) ⫽ 3.562, p ⫽ 0.004; ACC early, F(5,175) ⫽ 4.567, p ⬍ 0.001; ACC late, F(5,175) ⫽ 2.610, p ⫽ 0.026). In OFC and ACC, DOI dosedependently elevated absolute value transformed population activity above vehicle levels (Fig. 4 A–D). In OFC, 1.0 mg/kg DOI produced significant disruptions of population activity only in the early postinjection bin (Fig. 4 B), while this Figure 4. Disruption of OFC and ACC population activity. A, The normalized activity of each unit was absolute value transformed dose did not produce significant disrup- so that inhibition and activation were represented similarly. Absolute value transformed OFC (A) population activity is displayed as tions of activity in the ACC (Fig. 4C,D). mean ⫾ SE (shaded area). Horizontal lines above abscissa indicate “early” and “late” postinjection periods. Injection occurs at Larger doses of DOI produced greater lev- time ⫽ 0 (dashed vertical line). B, Absolute value of mean normalized OFC population activity during early and late postinjection els of population disruption in both peri- period. In each group, left bar represents early and right bar represents late postinjection period. Data are displayed as mean and ods and both brain regions (Fig. 4 B, D). In SE. Number signs (#) indicate statistical significance compared with vehicle control. C, ACC absolute value transformed population OFC, MK801 and amphetamine also pro- activity. Format same as A. D, ACC absolute value transformed activity during early and late postinjection period. Format same as duced increased levels of disruption com- B. Legend appears at right, center of figure. pared with vehicle during both the early and late postinjection periods (Fig. 4 B). A similar pattern was Table 3. Proportion of unit-pairs with a significant cross correlation detected in ACC (Fig. 4 D). There was little difference in the magOFC OFC nitude of disruption produced by each psychotomimetic drug. Drug Base Early Late Base Early Late MK801, amphetamine, and 3.0 and 5.0 mg/kg DOI all produced VEH 0.17 0.25 0.25 0.17 0.38 0.45 equivalent levels of OFC population disruption (Fig. 4 B). An DOI 1.0 0.31 0.20 0.20 0.30 0.12 0.12 identical relationship was found in ACC (Fig. 4 D). DOI 3.0 0.14 0.18 0.24 0.24 0.23 0.19 Cross-correlation analysis between each pair of simultaneously DOI 5.0 0.23 0.24 0.23 0.13 0.15 0.17 recorded units within the OFC or ACC, which is a rough measure of MK 0.28 0.21 0.23 0.27 0.25 0.28 the functional connectivity between units, detected no consistent AMP 0.26 0.20 0.22 0.21 0.11 0.22 effect of any psychotomimetic drugs (Table 3). It should be noted The proportion of OFC (left group of columns) and ACC (right group of columns) unit-pairs classified as having a significant cross-correlation in discharge are listed in the baseline, early, and late postinjection period. that, in both regions, the lowest dose of DOI decreased the proportion of significant pairs compared with baseline (Table 3; OFC early, 2 2 (1) F(5,26) ⫽ 5.254; high gamma late bin, F(5,26) ⫽ 6.744; all p ⬍ ⫽ 9.133, p ⫽ 0.003; OFC late, (1) ⫽ 9.756, p ⫽ 0.002; ACC 2 2 early, (1) ⫽ 14.990, p ⬍ 0.001; ACC late, (1) 0.001). Similarly, in ACC there were significant interactions be⫽ 14.990, p ⬍ 0.001). However, this should be interpreted cautiously as the vehicle sestween time and drug detected in both low and high gamma bands sions were characterized by instability in the proportion of pairs that (low gamma, F(10,40) ⫽ 11.999; high gamma, F(10,40) ⫽ 8.240; all 2 p ⬍ 0.001). Both postinjection periods were marked by signifipossessed a significant cross-correlation (Table 3; OFC early, (1) ⫽ 2 2 4.701, p ⫽ 0.030; OFC late, (1) cant differences between groups (low gamma early bin, F(5,20) ⫽ ⫽ 5.128, p ⫽ 0.024; ACC early, (1) 2 ⫽ 16.910, p ⬍ 0.001; ACC late, (1) ⫽ 29.212, p ⬍ 0.001). 16.668; low gamma late bin, F(5,20) ⫽ 14.896; high gamma early bin, F(5,20) ⫽ 9.911; high gamma late bin, F(5,20) ⫽ 18.234, all p ⬍ 0.001). The 3.0 mg/kg dose of DOI decreased OFC low and high Effect of DOI, MK801, and amphetamine on LFP oscillations gamma power (Fig. 6 A, B; low gamma, F(2,10) ⫽ 18.624, p ⬍ The most consistent effect on LFP oscillations by all drugs was 0.001; high gamma, F(2,10) ⫽ 10.479, p ⫽ 0.004). The 5.0 mg/kg modulation of gamma power (Fig. 5A–L). To more accurately dose reduced OFC low gamma (F(2,10) ⫽ 13.706, p ⫽ 0.011) but describe the results, we divided the gamma band into low and not high gamma power (Fig. 6 A, B). The effect of DOI was sushigh ranges. In OFC, significant interactions between time and tained throughout the entire postinjection period in both low drug were detected in both low (30 –55 Hz) and high (55– 80 Hz) and high gamma bands (Fig. 6C). A similar trend was found in gamma bands (low gamma, F(10,52) ⫽ 7.166; high gamma, F(10,52) ⫽ 4.235; all p ⬍ 0.001). In both cases, these were driven by sigACC. The 3.0 mg/kg dose significantly decreased low gamma nificant differences between drug groups during both postinjecpower (Fig. 6 D; F(2,8) ⫽ 9.832, p ⫽ 0.007). High gamma power was also reduced by 3.0 mg/kg in the early postinjection period tion periods but not the baseline (low gamma early bin, F(5,26) ⫽ 7.203; low gamma late bin, F(5,26) ⫽ 7.294; high gamma early bin, (Fig. 6 E; F(2,8) ⫽ 6.208, p ⫽ 0.024). At the 5.0 mg/kg dose of DOI,
Wood et al. • Cortical Dynamics and Psychotomimetics
J. Neurosci., February 29, 2012 • 32(9):3022–3031 • 3027
and high gamma bands (Fig. 7A–D). We observed that vehicle weakly reduced the correlation between gamma power and discharge rate, while psychotomimetic drugs modulated this correlation more strongly (Fig. 7A–D). In OFC, 1.0 and 5.0 mg/kg DOI and MK801 significantly decreased mean correlations between spikedischarge and high gamma power compared with vehicle in the early postinjection period (Fig. 7B; F(5,149) ⫽ 3.057, p ⫽ 0.012, all post hoc tests p ⬍ 0.05). DOI at 5.0 mg/kg also decreased the mean correlation in the late postinjection period (F(5,149) ⫽ 2.494, p ⫽ 0.034, post hoc test p ⬍ 0.05). In ACC, more robust differences between vehicle and psychotomimetic drugs were observed. DOI (1.0 mg/ kg), MK801, and amphetamine decreased discharge-low gamma power correlation in the early postinjection period (Fig. 7C; F(5,183) ⫽ 2.954, p ⫽ 0.014, all post hoc tests p ⬍ 0.05). All drugs except the lowest dose of DOI significantly reduced the ACC discharge-low gamma power correlation compared with vehicle during the late postinjection period (Fig. 7C; F(5,183) ⫽ 4.193, p ⫽ 0.001, post hoc test p ⬍ 0.05). Similarly, all drugs except the lowest dose of DOI decreased the ACC discharge-high gamma power correlation compared with vehicle (Fig. 7D; early, F(5,183) ⫽ 5.706, p ⬍ 0.001; late, F(5,183) ⫽ 5.848, p ⬍ 0.001; all post hoc tests p ⬍ 0.05). Of note, we did not observe consistent changes in the correlation between spikedischarge and spectral power in other frequency bands (data not shown). Furthermore, we did not observe modulation of spike-field coherence by these drugs at any frequency band in either brain region (data Figure 5. Modulation of LFP power in OFC and ACC. A–L, The normalized change in power of LFP oscillations in OFC (A–F ) and not shown). Together, these data indicate ACC (G–L) before and after injection. Baseline activity is normalized to zero, and injection occurs at time ⫽ 0. The administered that a common detrimental effect of differdrug appears to the left of each row of spectrograms. Color scale appears at right. ent classes of psychotomimetic drugs in the low and high gamma power were reduced during both postinjecPFC is to reduce the spontaneous coupling of single unit activity with tion periods (Fig. 6 D, E; low gamma, F(2,8) ⫽ 33.340, p ⬍ 0.001; gamma oscillations. high gamma, F(2,8) ⫽ 16.580, p ⫽ 0.001). In ACC, reductions of gamma power were temporally consistent and dose dependent Discussion (Fig. 6 F). Despite distinct pharmacological profiles, serotonergic halluciMK801 strongly increased gamma power in ACC, with less nogens, NMDA receptor antagonists, and amphetamine are all effect in OFC (Fig. 6 A, B, D, E). There was a modest and nonsigpsychotomimetic in humans, and produce cognitive deficits in nificant increase in the power of low gamma activity in OFC (Fig. humans and laboratory animals. This suggests that these drugs 6 A, B). ACC gamma power was significantly increased in both similarly disrupt the function of brain networks that lead to ablow and high gamma bands (Fig. 6 D, E). Amphetamine increased errant behaviors related to schizophrenia. Understanding the naOFC low gamma power (Fig. 6 A) and high gamma power (Fig. ture of these network level disruptions may provide insight into 6 B). In ACC, high gamma power was increased more than low mechanisms by which different molecular factors can lead to gamma power (Fig. 6 D, E). Thus, in contrast to DOI, both amsimilar behavioral endpoints. We found that while these drugs phetamine and MK801 increased gamma power. had different inhibitory or excitatory effects on OFC and ACC population activity in awake animals, they similarly disrupted DOI, MK801, and amphetamine reduce coupling of spikenet population activity, selectively modulated LFP gamma discharge and gamma power power, and reduced the correlation of spike rate and gamma The correlation between changes in gamma power and single unit power. discharge rate was examined for all treatments in both the low
3028 • J. Neurosci., February 29, 2012 • 32(9):3022–3031
Wood et al. • Cortical Dynamics and Psychotomimetics
Effects on single unit and population activity The serotonergic hallucinogen DOI dosedependently inhibited spontaneous population activity of ACC and OFC neurons. In contrast, MK801 increased population activity, and amphetamine activated or suppressed many units, thus weakly influencing population activity. While the impact of amphetamine and MK801 on PFC population activity has been reported before (Jackson et al., 2004; Homayoun and Moghaddam, 2008), this is the first investigation of the effects of serotonergic hallucinogens on cortical neurophysiology in awake animals. The lowest dose of DOI drove weak and sporadic increases in ACC single unit activity, which did not modulate population activity. Higher doses of DOI predominantly decreased the activity of individual ACC units in a sustained fashion. DOI predominantly suppressed OFC single unit activity at all doses. In contrast to MK801 and amphetamine, DOI dose-dependently decreased OFC and ACC population activity. Our population level findings agree with previous anesthetized recordings, demonstrating reduced neuronal activity in medial PFC (including ACC) and OFC following iontophoresis of DOI (Ashby et al., 1989, 1990; Rueter et al., 2000). DOI reduces the intrinsic excitability of corti- Figure 6. Modulation of gamma power in OFC and ACC. A, B, The normalized change in OFC low (A) and high (B) gamma power cal neurons and activates inhibitory cir- (30 –55 Hz and 55– 80 Hz, respectively) are depicted as mean and SE for each group. Left bar represents early and right bar cuits, which could potentially drive these represents late postinjection period. Asterisks indicate statistically significant difference relative to drug-free baseline. Number effects (Sheldon and Aghajanian, 1990; signs (#) indicate statistical significance compared with vehicle control. C, Modulation of OFC gamma power by DOI. The normalized Abi-Saab et al., 1999; Zhou and Hablitz, mean changes in low and high gamma power are depicted for each dose of DOI in OFC. Solid lines represent low gamma and dashed lines represent high gamma. Horizontal lines above abscissa indicate “early” and “late” postinjection periods. Injection occurs at 1999; Carr et al., 2002) (but see Ashby et time ⫽ 0 (dashed vertical line). Note that only mean without error is displayed for clarity. Legend appears at right. D—E, The al., 1990). In contrast to these studies, normalized change in ACC low (D) and high (E) gamma power. Format same as A and B. Legend appears at right. F, Modulation of DOI mediates excitatory postsynaptic ef- ACC gamma power. Format same as C. fects in slice preparations from prelimbic and infralimbic cortices (Aghajanian and chotic drug action, suggest psychotomimetic NMDA receptor Marek, 1997, 1999; Marek and Aghajanian, 1998b, 1999; Zhang antagonists and serotonergic hallucinogens disinhibit the PFC and Marek, 2008). Thus, our results are in agreement with some uniformly and through a common mechanism (Aghajanian and previous studies, but contrast with others. This difference may be Marek, 2000; Gray and Roth, 2007a,b; Gonza´lez-Maeso et al., due to differential serotonergic modulation of pyramidal cell ac2008; Gonza´lez-Maeso and Sealfon, 2009). However, our data tivity in PFC subregions. Previous studies reporting excitatory show that MK801 increased discharge in the same networks ineffects have focused mainly on rat prelimbic and infralimbic corhibited by DOI, suggesting that disinhibition theories of psychottices, whereas inhibitory effects were observed mainly in piriform omimetic states require reevaluation. cortex, OFC, and ACC (Ashby et al., 1989, 1990; Sheldon and Although each drug had different effects on neuronal populaAghajanian, 1990; Aghajanian and Marek, 1997, 1999; el Mansari tion activity, when the activity of each unit was absolute value and Blier, 1997; Marek and Aghajanian, 1998b, 1999; Rueter et transformed, equivalently sized disruptions of population actival., 2000; Scruggs et al., 2000; Puig et al., 2003; Scruggs et al., 2003; ity were observed. The integrity of cortical networks depends on Muschamp et al., 2004; Zhang and Marek, 2008). Furthermore, maintaining a delicate balance of inhibitory and excitatory neurecordings in prelimbic and infralimbic cortices have targeted rotransmission (van Vreeswijk and Sompolinsky, 1996). Thus, mostly cells in layer V of the PFC, whereas our data set was comexcitation or inhibition produced by these drugs at any node in a prised of a more heterogeneous sample of cortical neurons. Preneuronal network could potentially disrupt the activity of that vious reports of inhibitory effects from OFC and ACC have network, leading to perceptual disorganization and cognitive defsampled across cortical layers as well (Ashby et al., 1989, 1990; el icits (London et al., 2010). Along these lines, antipsychotic effiMansari and Blier, 1997; Rueter et al., 2000). Collectively, these cacy may be a product of restoring network activity to selfdata suggest that serotonergic hallucinogens do not produce a organized levels. In support of this mechanism, antipsychotic uniform disinhibitory influence on all PFC subregions and layers. Current theories, which factor in novel mechanisms of antipsydrugs normalize both psychotomimetic drug-induced in-
Wood et al. • Cortical Dynamics and Psychotomimetics
J. Neurosci., February 29, 2012 • 32(9):3022–3031 • 3029
or baseline, most prominently in ACC, despite the fact that they had divergent effects on population activity and gamma power. While a causal link between these correlations and the effects on population activity, gamma power modulation, or behavior has not been established, previous work suggests that both NMDA receptor antagonists and amphetamine decouple PFC gamma oscillators from their controlling networks (Pinault, 2008; Uhlhaas and Singer, 2010). It has also been suggested that decreased correlations between spike-rate and gamma power represent decoupling of a neuron’s spike output from the activity of the population (Nir et al., 2007). Together, our data demonstrate that psychotomimetic drugs decouple single unit discharge from rhythmic oscillations in OFC and ACC, and thereby decrease coordination of neuronal populations. This mechanism is Figure 7. Modulation of the correlation in gamma power and discharge rate in OFC and ACC. A, B, The change in correlation in line with our observation that each between OFC single unit discharge rate and OFC low (A) and high (B) gamma power are depicted as mean Fisher’s Z score drug disrupted population activity to a normalization of Pearson’s correlation coefficient for each group. The three time points represent baseline, early, and late postinsimilar degree, suggesting that the net dejection period. C, D, The change in correlation between ACC single unit discharge and ACC low (C) and high (D) gamma power. struction of well controlled spikeFormat same as in A and B. Legend appears at right, center of figure. discharge and disconnection from network oscillations may be a shared outcreases and decreases in neuronal discharge (Homayoun and come of these psychotomimetic drugs. Moghaddam, 2008). Collectively, these data suggest that the psychotomimetic effect of these drugs may arise, in part, from Conclusions the decreased integrity of signaling by cortical populations. In freely moving animals, the serotonergic hallucinogen DOI reduced population activity and the power of gamma oscillations Effects on local field potentials across PFC regions. In contrast, NMDA receptor antagonists inIn both OFC and ACC, psychotomimetic drugs modulated the creased population activity and gamma power. While each psypower of gamma oscillations. DOI reduced gamma power, an chotomimetic drug produced diverse effects on the activity of effect which disrupts spike timing (Fuchs et al., 2007), and may individual neurons, they produced comparable levels of net disengender a schizophrenia-like state by disrupting the organizaruption on population activity and decoupled single unit distion of spike-discharge within neuronal networks (Uhlhaas and charge from gamma oscillations in both PFC subregions. As Singer, 2010). DOI modulated both low and high gamma power, opposed to disinhibition of PFC populations, disorganization of but had a stronger effect on low gamma. On the other hand, the the spiking and oscillator activity in PFC networks may be comeffects of amphetamine were larger in upper gamma band. Low mon pathways through which distinct molecular factors can lead and high gamma bands are pharmacologically dissociable (Oke et to disorganized behavior and psychosis. These findings suggest al., 2010) and differentially modulate PFC-dependent cognition that large scale analysis of cortical activity, such as population (Wyart and Tallon-Baudry, 2008; Chaumon et al., 2009). Our disruptions or spike-field interactions, may provide a novel elecdata indicate that, while psychotomimetic drugs preferentially trophysiological approach to characterize animal models of disrupt gamma power, these effects are dissociable in terms of the schizophrenia. direction of change in gamma power as well as the frequency ranges that are impacted. Gamma oscillations are reflective of References local network activity and support working memory, attention, Abi-Saab WM, Bubser M, Roth RH, Deutch AY (1999) 5-HT2 receptor regulation of extracellular GABA levels in the prefrontal cortex. Neuropsyand other aspects of human cognition affected in schizophrenia chopharmacology 20:92–96. (Fries et al., 2001, 2007; Buzsa´ki and Draguhn, 2004; Traub et al., Aghajanian GK, Marek GJ (1997) Serotonin induces excitatory postsynaptic 2004; Womelsdorf et al., 2006; Lisman and Buzsa´ki, 2008; Schrpotentials in apical dendrites of neocortical pyramidal cells. Neuropharoeder and Lakatos, 2009; Uhlhaas and Singer, 2010). Thus, dismacology 36:589 –599. ruption of spontaneous gamma power may be indicative of, or Aghajanian GK, Marek GJ (1999) Serotonin, via 5-HT2A receptors, incause, disrupted network signaling and cognitive impairments. creases EPSCs in layer V pyramidal cells of prefrontal cortex by an asynchronous mode of glutamate release. Brain Res 825:161–171. Spontaneous correlations between spike-rate and gamma Aghajanian GK, Marek GJ (2000) Serotonin model of schizophrenia: power are associated with cognitive processing in humans and emerging role of glutamate mechanisms. Brain Res 31:302–312. laboratory animals (Liu and Newsome, 2006; Nir et al., 2007; Alain C, McNeely HE, He Y, Christensen BK, West R (2002) NeurophysioDenker et al., 2011). During baseline recordings in freely moving logical evidence of error-monitoring deficits in patients with schizophreanimals, we found a positive correlation between fluctuations in nia. Cereb Cortex 12:840 – 846. gamma power and neuronal discharge rate. All psychotomimetic Andreasen NC, O’Leary DS, Flaum M, Nopoulos P, Watkins GL, Boles Ponto LL, Hichwa RD (1997) Hypofrontality in schizophrenia: distributed drugs decreased this spontaneous correlation relative to vehicle
3030 • J. Neurosci., February 29, 2012 • 32(9):3022–3031 dysfunctional circuits in neuroleptic-naive patients. Lancet 349:17301734. Artigas F (2010) The prefrontal cortex: a target for antipsychotic drugs. Acta Psychiatr Scand 121:11–21. Ashby CR Jr, Edwards E, Harkins K, Wang RY (1989) Effects of (⫹/⫺)-DOI on medial prefrontal cortical cells: a microiontophoretic study. Brain Res 498:393–396. Ashby CR Jr, Jiang LH, Kasser RJ, Wang RY (1990) Electrophysiological characterization of 5-hydroxytryptamine2 receptors in the rat medial prefrontal cortex. J Pharmacol Exp Ther 252:171–178. Aultman JM, Moghaddam B (2001) Distinct contributions of glutamate and dopamine receptors to temporal aspects of rodent working memory using a clinically relevant task. Psychopharmacology 153:353–364. Bowers MB Jr, Freedman DX (1966) “Psychedelic” experiences in acute psychosis. Arch Gen Psychiatry 15:240 –248. Buzsa´ki G, Draguhn A (2004) Neuronal oscillations in cortical networks. Science 304:1926 –1929. Carr DB, Cooper DC, Ulrich SL, Spruston N, Surmeier DJ (2002) Serotonin receptor activation inhibits sodium current and dendritic excitability in prefrontal cortex via a protein kinase C-dependent mechanism. J Neurosci 22:6846 – 6855. Carter CS, MacDonald AW 3rd, Ross LL, Stenger VA (2001) Anterior cingulate cortex activity and impaired self-monitoring of performance in patients with schizophrenia: an event-related fMRI study. Am J Psychiatry 158:1423–1428. Chaumon M, Schwartz D, Tallon-Baudry C (2009) Unconscious learning versus visual perception: dissociable roles for gamma oscillations revealed in MEG. J Cogn Neurosci 21:2287–2299. Denker M, Roux S, Linde´n H, Diesmann M, Riehle A, Gru¨n S (2011) The local field potential reflects surplus spike synchrony. Cereb Cortex 21:2681–2695. el Mansari M, Blier P (1997) In vivo electrophysiological characterization of 5-HT receptors in the guinea pig head of caudate nucleus and orbitofrontal cortex. Neuropharmacology 36:577–588. El Mansari M, Blier P (2005) Responsiveness of 5-HT(1A) and 5-HT2 receptors in the rat orbitofrontal cortex after long-term serotonin reuptake inhibition. J Psychiatry Neurosci 30:268 –274. Fries P, Reynolds JH, Rorie AE, Desimone R (2001) Modulation of oscillatory neuronal synchronization by selective visual attention. Science 291:1560 –1563. Fries P, Nikolic´ D, Singer W (2007) The gamma cycle. Trends Neurosci 30:309 –316. Fuchs EC, Zivkovic AR, Cunningham MO, Middleton S, Lebeau FE, Bannerman DM, Rozov A, Whittington MA, Traub RD, Rawlins JN, Monyer H (2007) Recruitment of parvalbumin-positive interneurons determines hippocampal function and associated behavior. Neuron 53:591– 604. Gewirtz JC, Marek GJ (2000) Behavioral evidence for interactions between a hallucinogenic drug and group II metabotropic glutamate receptors. Neuropsychopharmacology 23:569 –576. Geyer MA, Vollenweider FX (2008) Serotonin research: contributions to understanding psychoses. Trends Pharmacol Sci 29:445– 453. Goldman-Rakic PS (1994) Working memory dysfunction in schizophrenia. J Neuropsychiatry Clin Neurosci 6:348 –357. Gonza´lez-Maeso J, Sealfon SC (2009) Psychedelics and schizophrenia. Trends Neurosci 32:225–232. Gonza´lez-Maeso J, Weisstaub NV, Zhou M, Chan P, Ivic L, Ang R, Lira A, Bradley-Moore M, Ge Y, Zhou Q, Sealfon SC, Gingrich JA (2007) Hallucinogens recruit specific cortical 5-HT(2A) receptor-mediated signaling pathways to affect behavior. Neuron 53:439 – 452. Gonza´lez-Maeso J, Ang RL, Yuen T, Chan P, Weisstaub NV, Lo´pez-Gime´nez JF, Zhou M, Okawa Y, Callado LF, Milligan G, Gingrich JA, Filizola M, Meana JJ, Sealfon SC (2008) Identification of a serotonin/glutamate receptor complex implicated in psychosis. Nature 452:93–97. Gray JA, Roth BL (2007a) Molecular targets for treating cognitive dysfunction in schizophrenia. Schizophr Bull 33:1100 –1119. Gray JA, Roth BL (2007b) The pipeline and future of drug development in schizophrenia. Mol Psychiatry 12:904 –922. Heckers S, Rauch SL, Goff D, Savage CR, Schacter DL, Fischman AJ, Alpert N (1998) Impaired recruitment of the hippocampus during conscious recollection in schizophrenia. Nat Neurosci 1:318 –323. Homayoun H, Moghaddam B (2007) NMDA receptor hypofunction pro-
Wood et al. • Cortical Dynamics and Psychotomimetics duces opposite effects on prefrontal cortex interneurons and pyramidal neurons. J Neurosci 27:11496 –11500. Homayoun H, Moghaddam B (2008) Orbitofrontal cortex neurons as a common target for classic and glutamatergic antipsychotic drugs. Proc Natl Acad Sci U S A 105:18041–18046. Homayoun H, Stefani MR, Adams BW, Tamagan GD, Moghaddam B (2004) Functional interaction between NMDA and mGlu5 receptors: effects on working memory, instrumental learning, motor behaviors, and dopamine release. Neuropsychopharmacology 29:1259 –1269. Homayoun H, Jackson ME, Moghaddam B (2005) Activation of metabotropic glutamate 2/3 receptors reverses the effects of NMDA receptor hypofunction on prefrontal cortex unit activity in awake rats. J Neurophysiol 93:1989 –2001. Huettner JE, Bean BP (1988) Block of N-methyl-D-aspartate-activated current by the anticonvulsant MK-801: selective binding to open channels. Proc Natl Acad Sci U S A 85:1307–1311. Jackson ME, Homayoun H, Moghaddam B (2004) NMDA receptor hypofunction produces concomitant firing rate potentiation and burst activity reduction in the prefrontal cortex. Proc Natl Acad Sci U S A 101:8467– 8472. Kopp B, Rist F (1999) An event-related brain potential substrate of disturbed response monitoring in paranoid schizophrenic patients. J Abnorm Psychol 108:337–346. Krystal JH, Karper LP, Seibyl JP, Freeman GK, Delaney R, Bremner JD, Heninger GR, Bowers MB Jr, Charney DS (1994) Subanesthetic effects of the noncompetitive NMDA antagonist, ketamine, in humans. Psychotomimetic, perceptual, cognitive, and neuroendocrine responses. Arch Gen Psychiatry 51:199 –214. Lewis DA, Moghaddam B (2006) Cognitive dysfunction in schizophrenia: convergence of gamma-aminobutyric acid and glutamate alterations. Arch Neurol 63:1372–1376. Lewis DA (1995) Neural circuitry of the prefrontal cortex in schizophrenia [comment]. Archives of General Psychiatry 52:269 –273; discussion 277–278. Lisman J, Buzsa´ki G (2008) A neural coding scheme formed by the combined function of gamma and theta oscillations. Schizophr Bull 34:974 –980. Liu J, Newsome WT (2006) Local field potential in cortical area MT: stimulus tuning and behavioral correlations. J Neurosci 26:7779 –7790. London M, Roth A, Beeren L, Ha¨usser M, Latham PE (2010) Sensitivity to perturbations in vivo implies high noise and suggests rate coding in cortex. Nature 466:123–127. Marek GJ, Aghajanian GK (1998a) The electrophysiology of prefrontal serotonin systems: therapeutic implications for mood and psychosis. Biol Psychiatry 44:1118 –1127. Marek GJ, Aghajanian GK (1998b) 5-Hydroxytryptamine-induced excitatory postsynaptic currents in neocortical layer V pyramidal cells: suppression by mu-opiate receptor activation. Neuroscience 86:485– 497. Marek GJ, Aghajanian GK (1999) 5-HT2A receptor or alpha1-adrenoceptor activation induces excitatory postsynaptic currents in layer V pyramidal cells of the medial prefrontal cortex. Eur J Pharmacol 367:197–206. McCracken CB, Grace AA (2009) Nucleus accumbens deep brain stimulation produces region-specific alterations in local field potential oscillations and evoked responses in vivo. J Neurosci 29:5354 –5363. Mitra P, Bokil H (2008) Observed brain dynamics. Oxford; New York: Oxford UP. Mitra PP, Pesaran B (1999) Analysis of dynamic brain imaging data. Biophys J 76:691–708. Moghaddam B (2003) Bringing order to the glutamate chaos in schizophrenia. Neuron 40:881– 884. Moghaddam B (2004) Targeting metabotropic glutamate receptors for treatment of the cognitive symptoms of schizophrenia. Psychopharmacology 174:39 – 44. Moghaddam B, Homayoun H (2008) Divergent plasticity of prefrontal cortex networks. Neuropsychopharmacology 33:42–55. Muschamp JW, Regina MJ, Hull EM, Winter JC, Rabin RA (2004) Lysergic acid diethylamide and [-]-2,5-dimethoxy-4-methylamphetamine increase extracellular glutamate in rat prefrontal cortex. Brain Res 1023:134 –140. Nir Y, Fisch L, Mukamel R, Gelbard-Sagiv H, Arieli A, Fried I, Malach R (2007) Coupling between neuronal firing rate, gamma LFP, and BOLD fMRI is related to interneuronal correlations. Curr Biol 17:1275–1285.
Wood et al. • Cortical Dynamics and Psychotomimetics Oke OO, Magony A, Anver H, Ward PD, Jiruska P, Jefferys JG, Vreugdenhil M (2010) High-frequency gamma oscillations coexist with lowfrequency gamma oscillations in the rat visual cortex in vitro. Eur J Neurosci 31:1435–1445. Paxinos G, Watson C (1998) The rat brain in stereotaxic coordinates. San Diego: Academic. Pinault D (2008) N-methyl D-aspartate receptor antagonists ketamine and MK-801 induce wake-related aberrant gamma oscillations in the rat neocortex. Biol Psychiatry 63:730 –735. Pranzatelli MR (1990) Evidence for involvement of 5-HT2 and 5-HT1C receptors in the behavioral effects of the 5-HT agonist 1-(2,5-dimethoxy4-iodophenyl aminopropane)-2 (DOI). Neurosci Lett 115:74 – 80. Puig MV, Celada P, Díaz-Mataix L, Artigas F (2003) In vivo modulation of the activity of pyramidal neurons in the rat medial prefrontal cortex by 5-HT2A receptors: relationship to thalamocortical afferents. Cereb Cortex 13:870 – 882. Ragland JD, Gur RC, Valdez J, Turetsky BI, Elliott M, Kohler C, Siegel S, Kanes S, Gur RE (2004) Event-related fMRI of frontotemporal activity during word encoding and recognition in schizophrenia. Am J Psychiatry 161:1004 –1015. Rueter LE, Tecott LH, Blier P (2000) In vivo electrophysiological examination of 5-HT2 responses in 5-HT2C receptor mutant mice. NaunynSchmiedebergs Arch Pharmacol 361:484 – 491. Schroeder CE, Lakatos P (2009) The gamma oscillation: master or slave? Brain Topogr 22:24 –26. Scruggs JL, Patel S, Bubser M, Deutch AY (2000) DOI-Induced activation of the cortex: dependence on 5-HT2A heteroceptors on thalamocortical glutamatergic neurons. J Neurosci 20:8846 – 8852. Scruggs JL, Schmidt D, Deutch AY (2003) The hallucinogen 1-[2,5dimethoxy-4-iodophenyl]-2-aminopropane (DOI) increases cortical extracellular glutamate levels in rats. Neurosci Lett 346:137–140. Sheldon PW, Aghajanian GK (1990) Serotonin (5-HT) induces IPSPs in pyramidal layer cells of rat piriform cortex: evidence for the involvement of a 5-HT2-activated interneuron. Brain Res 506:62– 69.
J. Neurosci., February 29, 2012 • 32(9):3022–3031 • 3031 Snyder SH (1976) The dopamine hypothesis of schizophrenia: focus on the dopamine receptor. Am J Psychiatry 133:197–202. Traub RD, Bibbig A, LeBeau FE, Buhl EH, Whittington MA (2004) Cellular mechanisms of neuronal population oscillations in the hippocampus in vitro. Annu Rev Neurosci 27:247–278. Uhlhaas PJ, Singer W (2010) Abnormal neural oscillations and synchrony in schizophrenia. Nat Rev Neurosci 11:100 –113. van Vreeswijk C, Sompolinsky H (1996) Chaos in neuronal networks with balanced excitatory and inhibitory activity. Science 274:1724 –1726. Vollenweider FX, Vollenweider-Scherpenhuyzen MF, Ba¨bler A, Vogel H, Hell D (1998) Psilocybin induces schizophrenia-like psychosis in humans via a serotonin-2 agonist action. Neuroreport 9:3897–3902. Weinberger DR, Berman KF, Zec RF (1986) Physiological dysfunction of dorsolateral prefrontal cortex in schizophrenia. I. Regional cerebral blood flow (rCBF) evidence. Arch Gen Psychiatry 43:114 –124. Weiss AP, Schacter DL, Goff DC, Rauch SL, Alpert NM, Fischman AJ, Heckers S (2003) Impaired hippocampal recruitment during normal modulation of memory performance in schizophrenia. Biol Psychiatry 53:48 –55. Womelsdorf T, Fries P, Mitra PP, Desimone R (2006) Gamma-band synchronization in visual cortex predicts speed of change detection. Nature 439:733–736. Wong EH, Kemp JA, Priestley T, Knight AR, Woodruff GN, Iversen LL (1986) The anticonvulsant MK-801 is a potent N-methyl-D-aspartate antagonist. Proc Natl Acad Sci U S A 83:7104 –7108. Wyart V, Tallon-Baudry C (2008) Neural dissociation between visual awareness and spatial attention. J Neurosci 28:2667–2679. Zhang C, Marek GJ (2008) AMPA receptor involvement in 5-hydroxytryptamine2A receptor-mediated pre-frontal cortical excitatory synaptic currents and DOI-induced head shakes. Prog Neuropsychopharmacol Biol Psychiatry 32:62–71. Zhou FM, Hablitz JJ (1999) Activation of serotonin receptors modulates synaptic transmission in rat cerebral cortex. J Neurophysiol 82:2989 – 2999.