Department of Computer Science, University of California, Davis, California 95616 USA. â . Center for ... Understanding the memory behavior of a parallel program requires the ...... [Online]. Available: http://doi.acm.org/10.1145/133057.133079.
Dissecting On-Node Memory Access Performance: A Semantic Approach Alfredo Gim´enez∗ , Todd Gamblin† , Barry Rountree† , Abhinav Bhatele† , Ilir Jusufi∗ , Peer-Timo Bremer† , and Bernd Hamann∗ ∗ Department
† Center
of Computer Science, University of California, Davis, California 95616 USA for Applied Scientific Computing, Lawrence Livermore National Laboratory, Livermore, California 94551 USA E-mail: ∗ {aagimenez, jusufi, bhamann}@ucdavis.edu, † {tgamblin, rountree, bhatele, ptbremer}@llnl.gov
Abstract—Optimizing memory access is critical for performance and power efficiency. CPU manufacturers have developed sampling-based performance measurement units (PMUs) that report precise costs of memory accesses at specific addresses. However, this data is too low-level to be meaningfully interpreted and contains an excessive amount of irrelevant or uninteresting information. We have developed a method to gather fine-grained memory access performance data for specific data objects and regions of code with low overhead and attribute semantic information to the sampled memory accesses. This information provides the context necessary to more effectively interpret the data. We have developed a tool that performs this sampling and attribution and used the tool to discover and diagnose performance problems in real-world applications. Our techniques provide useful insight into the memory behavior of applications and allow programmers to understand the performance ramifications of key design decisions: domain decomposition, multi-threading, and data motion within distributed memory systems.
I.
I NTRODUCTION
Modern microprocessors have reached limits in instructionlevel parallelism and on-chip power capacity. On-node concurrency levels have also increased dramatically. Moore’s law is still alive and well [1] but the increasing transistor count is now used to build additional processing units instead of faster single-threaded cores. To support on-node parallelism, the memory architecture has also become more complex. This has severely complicated the task of extracting peak performance from modern chips. For years, computational power of processors has outpaced available memory bandwidth, and this phenomenon was traditionally called the “memory wall” [2]. Indeed, onchip data motion within the cache hierarchy has long been the largest performance bottleneck and consumer of power. Keeping processors fed with work has traditionally been a matter of carefully managing a single cache hierarchy. Today, nodes with multiple levels of potentially shared caches, non-uniform memory access (NUMA) domains, and multiple sockets are ubiquitous. Optimizing data motion within this type of topology is a much more difficult problem requiring programmers to lay out application data with extreme care. Recent generations of Intel and AMD processors have included fine-grained measurement capabilities that allow tools to sample system-wide memory instructions and record performance data and metadata associated with them. These SC14, November 16-21, 2014, New Orleans c 978-1-4799-5500-8/14/$31.00 2014 IEEE
performance monitoring units (PMUs) can associate a memory operation with a particular CPU, socket, cache resource, or NUMA domain. In addition, they can report the achieved latency of specific memory acccess operations. Such robust PMUs offer new potential for performance monitoring, but their produced results can be exceedingly large and difficult to interpret. Understanding the memory behavior of a parallel program requires the software developer to understand the relationships of each memory instruction with the source code, the data structure the instruction operated on, and the processor topology. For example, in a hydrodynamics simulation, a memory address may refer to a particular volume within a large mesh, or a particular physics property of the associated material. Likewise, a particular thread executing on one socket may access that address, but memory attached to another socket may service the request. To understand the performance of a large processor topology, we may need to associate a particular memory instruction with potentially many other data points. To expose these relationships to application developers and to enable more intuitive optimization of application performance, we have developed several novel measurement and analysis techniques that allow us to associate memory behavior with code, data structures, and node topology. Our contributions are: 1)
2)
3)
A sampling technique that uses hardware PMUs and accurately filters incoming data in kernel space to provide memory access performance data at a fine granularity and with low overhead. An efficient method to attribute memory access samples with high-level information regarding the associated node hardware topology, program state and data structures, and code. This provides meaningful context for low-level data. A tool, MemAxes, that implements our methods consisting of a kernel driver module for capturing memory performance data, a source instrumentation library for attributing high-level information to memory accesses, and a program to visually analyze the acquired data interactively.
The contributions of the visualization methods developed in MemAxes are outside the scope of this paper, but we explain the relevant portions to this work in Section VI. We used our method to diagnose the performance of and
optimize benchmark applications, and we describe the results in a series of case studies. We show that our method intuitively highlights key on-node performance characteristics in HPC applications that were otherwise unobservable or difficult to understand. II.
M EMORY ACCESS P ERFORMANCE DATA AND S EMANTIC ATTRIBUTES
Modern architectures have begun to include advanced Performance Measurement Units (PMUs) with capabilities for sampling based on events. One such PMU makes possible sampling of memory access events occurring on the architectures and collection of information corresponding to those events, including instruction operands and performance results of their execution. Intel has provided the capability for accurate memory access sampling in their Precise Event-Based Sampling (PEBS) framework [3], and AMD has released similar capability in their Instruction Based Sampling (IBS) framework [4]. We used the PEBS framework for this research, but our presented methods are equally applicable for other memory access sampling frameworks. The PEBS framework provides a programmable hardware counter that supports sampling of memory access events at a specified frequency. At the retirement of each sampled access, an entry is generated containing information pertaining to that event. Each entry contains: 1) 2) 3) 4) 5) 6)
The instruction pointer The data address accessed The number of core clock cycles elapsed during the access operation The memory resource in which the address was resolved (L1,L2, etc) The processor ID that issued the access1 The socket ID on which the processor resides1
This information provides memory access performance data at a high level of detail. However, many of the values are exceedingly low-level and require further processing to become meaningful. From this data, we extract higher-level information that provides context, which we refer to as semantic attributes. These attributes must provide contexts that are intuitive for the programmer to interpret. Furthermore, different contexts elucidate different areas of performance, and thus it is essential to define a set that encompasses a representative portion of the different types of performance behavior. We categorize the semantic attributes in terms of the context they provide. These contexts are: (1) the node hardware topology, (2) the application, and (3) the source code. In some cases, a semantic attribute provides multiple contexts, here we organize them by the areas where they are most applicable. We also determine the performance characteristics associated with each context and provide examples of behavior that can be analyzed within them. 1 This information is not directly contained in a PEBS sample but can be easily determined
A. Node Hardware Topology In order to optimize software’s utilization of a node’s hardware capabilities, we have to understand the relationship between them. This includes what resources are being used and to what extent. From this we can determine imbalances, hardware bottlenecks, and improper resource utilization. Often, software practices that are aimed at improving resource utilization, such as rearranging program flow to increase locality, result in different behavior than was intended due to unexpected behavior in the hardware, compiler, or operating system. By gaining a detailed understanding of how software runs on the available hardware, we can begin to target areas for performance optimization. The node hardware topology consists of the topologies of memory and processing resources. The memory topologies in modern architectures are typically arranged as a multi-level hierarchy. At the root, we have the largest resources, such as RAM, and below them we have larger, possibly shared caches, and finally smaller, faster caches at the leaves. This organization is intrinsically related to the processor topology. Physical CPUs each typically have independent access to a set of smaller caches, such as L1 and L2, and shared access larger caches and memory. Each physical CPU may be further divided into multiple logical CPUs via multi-threading, in which case they may share small caches as well. NUMA architectures contain multiple sockets (or processor packages) on a single motherboard, each of which contains a set of CPUs, caches, and a larger memory resource shared between sockets called a NUMA domain. Of the memory access sample attributes, those that concern the utilization of these various resources are the processor ID, socket ID, and memory resource where the data was resolved. If we also know the node’s hardware topology, we can associate a memory sample with a specific portion of it. Tools such as hwloc [5] and likwid [6] exist to detect the available hardware topology on a system. We use a modification of likwid suited to integrate with our existing codebase. We annotate the performance data onto the acquired node hardware topology. This allows us to determine the precise loads on the different available resources. With this information we can also estimate the effects of data migration between resources. Under the assumption that the data is copied to all lower cache levels between the CPU that was issued the request and the memory resource where the data was resolved, we record the resources that an accessed data element must have been copied to. B. Application The term application here refers to the problem being solved by a code or the dataset it is solving a problem for. Complex simulation codes often encounter performance characteristics caused by application-specific behavior such as boundary conditions, non-deterministic execution, or unpredictable changes to the program state for given types of data. Application-specific behavior also includes elements of the abstract representation of the problem, such as the data structures and algorithms used. Several solutions exist to mitigate this issue, such as load-balancing techniques and
branch prediction. Some of these treat application-specific performance as a black box problem, modifying inputs to determine a combination for which performance is improved. Others are predictive and attempt to determine the causes for performance degradation and resolve them. The latter, in particular, requires a great deal of understanding how changes in the application affect performance behavior. In both cases, it is necessary to determine when and where application-specific behavior causes performance degradation in order to improve it. Schulz et al. noted the significance of providing context in terms of the application [7]. The programmer often has an intuition of the application of a program, and Schulz et al. found it useful to provide this intuitive context to performance data that is otherwise difficult to interpret. By nature, the application context cannot be generally determined. For this reason, we provide three semantic attributes that are generally useful in providing application context to a memory access sample and created the capability for the programmer to easily define additional attributes. The general attributes provided are the timestamp, access index, and accessed value. The timestamp can be loosely corresponded to the program state or executing iteration at the time of the access. The index indicates the location within a buffer that a piece of data was accessed from. This may be used to determine whether the access occured near a data boundary or if the flow of the program caused accesses to occur in an unexpected spatial order. This, in conjunction with the timestamp, provides insight into the access pattern achieved for a specific scenario. The accessed value may be used to determine whether there exists a correlation between anomalous data and anomalous performance, such as performing arithmetic with denormalized values or causing a divide-by-zero hardware exception. The programmer may define any additionally desired semantic attribute. Specifically, we have found it useful to define an attribution to the spatial and temporal locations in the domain of the applied dataset. For example, the spatial location may refer to the 2-dimensional coordinates of an element within an array that represents a matrix, and the temporal location may refer to the iteration or time step during a simulation. These attributes may be derived from the existing sample data or looked up directly from globally accessible variables in the program.
address. We use the same method with a slightly different implementation, as described in Section V. We also record metadata regarding an allocated data object, specifically the size of the buffer and individual data elements in conjunction with the symbol name. This allows us to understand how objects are allocated and gives additional information regarding the access pattern, for example, if a buffer is organized as an array of structs (AoS) or struct of arrays (SoA). The memory access samples thus include the original attributes along with the following appended semantic attributes: 1) 2) 3) 4) 5) 6) 7) 8)
Source Code Line Source Code File Data Symbol Buffer Size Element Size Access Index Accessed Value Resources Used
Additionally, we annotate performance data and resource traversal onto the acquired hardware topology. We gather general statistics regarding the access performance, such as number of samples, total cycles, and average cycles for each resource. III.
S YSTEM OVERVIEW
Our system is comprised of two main parts: a kernel module and a source-level instrumentation module. The kernel module manages memory access sampling, and the instrumentation library is responsible for associating data addresses with semantic values. The programmer uses the instrumentation library to specify data objects of interest and, optionally, functions to collect additional application-specific semantic attributes. The library also provides functions for configuring memory access sampling, for which it communicates with the kernel module. The module, in turn, communicates directly with the hardware.
Providing context in terms of the code is the most direct form of attribution given the data in a memory access sample. It is also one of the most essential for optimizing a program. Most forms of performance optimization involve modifying the source code (as opposed to configuring the hardware, operating system, scheduling policies, etc.) and thus attributing performance problems to the code often helps to determine what may be modified in order to improve the achieved performance.
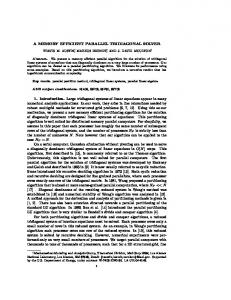
Fig. 1 shows an overview of the basic system. The library stores metadata for a programmer-provided data object in a data structure called a Semantic Memory Range (SMR). All SMRs are stored in a Semantic Memory Tree (SMT). The kernel module begins the memory access sampling unit by setting the appropriate Machine-Specific Registers (MSRs) in the hardware and registers an interrupt handler to process and collect samples as they are generated. As the module produces samples, the instrumentation library consumes them, performing semantic attribution and recording the results. Semantic attribution involves searching the SMT for the SMR associated with the data address of the sample and recording the sample data along with the semantic information provided by the SMR (and, optionally, by programmer-defined functions). After sampling is terminated, the programmer may store the acquired data for post-mortem analysis.
Attribution of memory access data to the context of the code has been recently done by Liu et al. [8] They mapped memory access samples to their associated lines of code and data objects using the instruction pointer and accessed data
In order for semantic attribution to be possible, it must occur during the execution of the program. Throughout the execution, the address range of data objects may change due to allocation and deallocation operations. In addition, during
C. Code
Fig. 1: Basic overview of our system. After buffers are allocated, the programmer populates a special data structure called an SMT containing metadata for specified data objects. When sampling begins, our library continuously reads raw samples, attributes semantic information to them, and records them. Finally, when sampling is completed, the samples may be collected for post-mortem analysis.
execution, we are able to access information regarding the program state, such as the value of accessed data. IV.
M EMORY ACCESS S AMPLING M ODULE
Because the PMUs are implemented in hardware, they gather performance data system-wide. This means memory access samples may be issued by instructions from any executing software, including the operating system. This produces a large quantity of data that is irrelevant to the program being analyzed and causes a significant amount of unnecessary overhead. For this reason, we developed a custom kernel module responsible for configuring the associated PMUs and developed functionality to filter out unwanted data. This module sets sampling options via MSRs and maintains the sample buffer for each CPU, called the Data Store (DS). The module allocates one DS per CPU in kernel memory on the NUMA node where the CPU resides. Because samples are dumped directly from the CPU to its respective DS, it is critical that the DS reside on a locally accessible resource. The module also registers an interrupt handler for the interrupt generated by a CPU when it fills the DS with a specified number of samples. This custom module allows us to accurately filter out unwanted samples. The module maintains a statically allocated FIFO queue in which it stores samples from all CPUs. Before copying a sample from the DS into the CPU, the module can perform a series of tests to determine whether the sample is unwanted. We included the functionality to filter out samples with accessed addresses outside the range of addresses marked for semantic attribution. The programmer manages memory access sampling via our library, which communicates with the kernel module to configure options in the hardware. The module configures sampling by either writing to the appropriate Machine-Specific Registers (MSRs) or by modifying the interrupt handler that processes samples. We provide functionality to configure sampling options, begin sampling, and end sampling. The configurable options include:
1) 2) 3) 4)
Sampling Frequency Overflow Threshold Latency Threshold Sampling Address Range
The sampling frequency is determined by the number of memory accesses to execute until one is sampled, i.e., for the provided value N , one sample is taken after every N access instructions are retired by the CPU. The achieved frequency varies slightly from this value due to its implementation in hardware [3]. Samples are collected continuously and saved in a block of memory called the data store (DS), which is allocated and maintained by the kernel module. When a certain amount of samples are collected, the CPU creates a local interrupt. Our kernel module handles this request by copying all collected samples from all CPUs into a single FIFO queue, from which the library may consume them and perform semantic attribution. The overflow threshold specifies the number of samples to collect before generating the interrupt. Because memory access samples are collected upon retirement, it is possible to collect only samples that used a minimum number of core cycles. This value is the latency threshold. In order to filter out accesses to data that are not interesting or relevant, we collect only samples that lie within a specified address range, using the filtering method described above. By default, the range is set to the smallest range that encompasses all SMRs. After all options are set, the programmer wraps blocks of code with functions to begin and end memory access sampling. This set of configurations makes it possible to collect memory access data at a fine granularity while avoiding unnecessary overhead. The programmer is able to specify the areas of the code, in terms of both source lines and data objects, of particular interest in performance analysis. Furthermore, a programmer can specify the level of detail of the performance data, which provides control over both the overhead and the amount of performance data to generate.
V.
S OURCE -L EVEL I NSTRUMENTATION
Semantic attribution requires the programmer to provide knowledge from which the library will extract semantic information. We developed a source-level instrumentation library that accepts the required input and performs semantic attribution in run-time. We describe the methods to use our instrumentation library and the underlying mechanisms used, and we demonstrate code snippets performing this instrumentation in a simple example. A. Specifying Data Objects The programmer specifies a set of data objects for which semantic attributes will be recorded. Data objects are contiguous allocated blocks of memory, such as single variables, arrays, and vectors. This is done by creating a Semantic Memory Tree (SMT) and populating it with Semantic Memory Ranges (SMR). The SMRs provide the necessary information to extract semantic attributes from memory access samples in run-time. The SMT is an Adelson-Velskii and Landis’ (AVL) tree, meaning it is a self-balancing binary tree. The programmer initializes an SMT by calling its constructor and populates it by inserting SMRs into it. An SMR consists of: 1) 2) 3) 4)
A label string The start and end addresses The size of each element The number of elements
this mapping. We calculate the access index using the SMR start address s, element size e, and accessed data address d, as (d−s)/e. In cases where an individual element is comprised of multiple values, such as a struct or tuple, we can also determine which value within the element was accessed. Using the data symbol and access index, we look up the accessed value for a particular piece of data and record it as well. C. Programmer-defined Semantic Attribution In addition to the semantic attributes from Section II, we provide the capability for the programmer to define functions to derive further attributes. These may be application-specific variables, such as variables values and program state at the time of a memory access. We have particularly observed the effectiveness of using programmer-defined attribution to map an accessed index to a spatial or temporal location in the context of the application. We demonstrate this with an example in the following section. Every SMR contains a function in which it performs semantic attribution for a given SMR and memory access sample. The programmer may define a set of additional attributes and write a function that accepts an SMR and a memory access sample and produces values for the additional attributes. The programmer must keep in mind that this function will run during the program execution for every sample, and thus must take necessary precautions to avoid incurring excessive overhead. D. Instrumentation Example: Matrix Multiplication
The programmer creates and inserts SMRs by passing these variables as arguments to functions within our library. Leaves in the SMT represent SMRs, and internal nodes are created such that the address range of every parent encompasses the address ranges of both its children. Whenever the library consumes a memory access sample produced by the kernel module, it searches for the SMR that contains the data address accessed. Because this happens during program execution, it is critical that the lookup be highly efficient in order to minimize overhead. We organized the SMT as an AVL tree, which guarantees O(logN) lookups. Liu and Mellor-Crummey used a splay tree for a similar purpose [8]. Both implementations have advantages; the splay tree takes advantage of temporal locality but has a worst-case complexity of O(N), while the AVL tree has a consistent complexity of O(logN). We chose the AVL tree because we cannot predict what various instrumentation and sampling configurations the programmer sets, and thus we cannot be certain if an execution will create worst-case scenarios for the splay tree. B. Semantic Attribution After the SMR associated with a memory access sample is found, the library uses this information to derive the semantic attributes listed in Section II. The data symbol, buffer size, and element size are already available in the metadata of the SMR, and the kernel module records the CPU timestamp at the time it receives a memory access sample. The resources used are available from the memory access sample. We determine the line and file of the source code using the instruction pointer and debug symbols in the code that provide
We demonstrate the instrumentation steps necessary to use our method for a simple matrix multiplication example. We show code snippets for specifying the matrix data objects and defining a custom semantic attribution. We are interested in the accesses to three data objects: the two input matrices to be multiplied and the output matrix. As described, we create an SMT and one SMR for each data object. To avoid redundancy, we show the code for specifying one of the three matrices. The syntax is as follows: #define N 1024 double A[N][N]; // matrix data object SMRTree *smrt = new SMRTree(); SMRNode *A_SMR = smrt->addSMR("A", sizeof(double), A, N*N);
By providing the pointer to the first element in each data object as well as the size and number of elements, our library can determine the complete range of addresses associated with the object. The data symbol string must be provided during instrumentation, as C does not allow code reflection. This information is sufficient to gather memory access data with the default provided semantic attributes. To specify additional attributes, we first define new attributes, as such: smrt->addIntegerAttribute("x_coord",-1); smrt->addIntegerAttribute("y_coord",-1);
The x_coord and y_coord attributes refer to the 2dimensional coordinates of a data element within a matrix. The second argument specifies the default value.
VI.
V ISUALIZATION AND A NALYSIS
We developed a tool, MemAxes, that allows a user to visually analyze the acquired memory access performance data. Here, we briefly describe the visualization methods of MemAxes and how they are interpreted, and we show screenshots of the tool to explain our results in Section VII.
(a)
(b)
Fig. 2: The radial hierarchy (sunburst) visualization for hardware topology. (a) Dark purple arcs are NUMA domains, light purple are L3 caches, dark orange are CPUs, and light orange are L1 and L2 caches. (b) shows a more complex topology with performance data annotated. We annotate the number of cycles caused by access to a resource with color; darker means more cycles. Resource traversal is indicated by lines between resources, where thicker indicates more data.
MemAxes takes advantage of the semantic attributes of the data to create intuitive visualizations with context. It features multiple coordinated views, each of which represents the data in a different context, and allows the user to specify selections in the various views. The tightly linked nature of the different views allows us to examine patterns and correlations between different contexts. We briefly describe three views featured in MemAxes, (1) the application view, (2) the hardware topology view, and (3) the parallel coordinates [9] view. A. Application As described in Section V, we can attribute memory access samples to spatial locations with respect to the applied dataset. We can then employ the same visualization methods that are typically used to show the dataset. MemAxes employs direct volume rendering (DVR), a technique capable of displaying scalar 3-dimensional data, to do so. DVR represents scalar values using colors and opacities in 3-dimensional space. In this case, locations of higher opacity and green color indicate more cycles taken to access elements mapped to a particular spatial location (shown in Fig. 4). In order to effectively navigate the 3-dimensional space, MemAxes allows interactive rotating and zooming as well. B. Hardware Topology
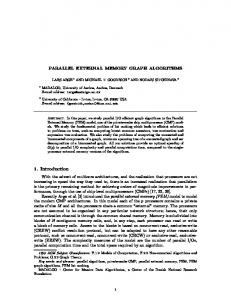
Fig. 3: The parallel coordinate visualization for a single memory access sample. The red line represents the sample, and the black lines represent its attributes. The intersections denote the values of the sample for each attribute.
With the knowledge that the matrices are stored in rowmajor ordering, we define the following function to populate these attributes: void* mat_attribution(SMRNode *smr, struct mem_sample *sample) { // Obtain the index of the address int bufferIndex = smr->indexOf(sample->daddr); // Calculate the x and y indices (row-major) sample->setAttribute("x_coord", bufferIndex % N); sample->setAttribute("y_coord", bufferIndex / N); }
The indexOf function provides the array index, with which we can calculate the x and y coordinates for a row-major ordering. The resulting data will have these values appended for every memory access sample.
We record performance data in terms of the node hardware topology, as outlined in Section V, and thus we can visualize the data laid out in a representation of the topology. MemAxes displays the hardware topology in the form of a radial hierarchy known as a sunburst chart [10]. Larger memory resources are placed in the center, CPU IDs are placed on the outer leaves, and caches are shown for their associated CPUs in between, as shown in Fig. 2. The color of each segment in the sunburst chart indicate the number of cycles associated with the access samples that resolved in a particular resource. The resource traversal is represented by black lines connecting radial segments—thicker indicates more samples were copied between a pair of resources. C. Parallel Coordinates Lastly, MemAxes employs a multidimensional visualization technique called parallel coordinates [9]. This view shows each sample as a polyline intersecting a set of parallel axes. The polyline is constructed such that the intersection between it and the parallel axes indicate the value of a single attribute in the sample. An example is shown in Fig. 3. This view enables a user to view correlations between a high number of different attributes by examining line segments between axes—crossing line segments indicate negative correlation, while parallel line segments indicate positive correlation. We modified the standard parallel coordinate implementation to include histograms along each axis in MemAxes. The
histograms represent the distribution of values along one axis for the shown data, shown in Fig. 6 and 7 D. Analysis Methodology The process of exploring the dataset to find features of interest requires the user to make interesting selections. This is often not straightforward, and as such we developed a basic methodology for useful interaction in MemAxes. This methodology is essentially (1) identify any anomalies in any of the views, and (2) select the anomalous data and look for patterns or correlations in the selected data. Here, data anomalies refer to data outliers or identifiable distributions (such as a cluster of memory accesses originating from a small set of variables). Patterns and correlations that may be observed are relative to the view in which they are visible, e.g. the hardware topology view may show that a selection of memory accesses were requested mainly from even-numbered CPUs. Parallel coordinates are particularly suited for viewing correlations between pairs of attributes— the axes may be reordered to place two dimensions next to each other, and if the lines between them are uncrossed, the data is positively correlated, while many crossings indicate a negative correlation. VII.
Fig. 4: The memory access performance data visualized in the context of the application dataset. Colored boxes in 3dimensional space indicate the number of samples taken to access a data element associated with that location over the whole execution. We selected a range of values along the z axis similar to Fig. 5 and can see a fairly uniform distribution of access cycles within it.
C ASE S TUDIES
We used our method to identify real performance problems in two different benchmark applications, LULESH and XSBench. All executions were performed on an isolated single node of the Hyperion HPC test bed [11]. This node uses an Intel Xeon E5-2660, which features 32 logical CPUs (16 physical), 16 32kB L1 caches, 16 256kB L2 caches, 2 20MB L3 caches, and 2 32GB NUMA domains. A. LULESH Livermore Unstructured Lagrangian Explicit Shock Hydrodynamics (LULESH) is a proxy application for calculating the Sedov blast problem [12]. It highlights the performance characteristics involved with performing simulations on an unstructured mesh. Specifically, as the mesh deforms to match the underlying Lagrangian structures, the changing mesh coordinate locations must be looked up via a secondary array. This indirect method for determining coodinate locations often causes memory access inefficiency. LULESH takes advantage of parallelism via OpenMP, and we hoped to determine whether the parallel decomposition could be related to its memory performance characteristics. We instrumented all persistent data buffers that contained state information for the simulated mesh. We also provided two application-specific semantic attributes: 3-dimensional location and iteration. Like the example in Section V we created a function to determine mesh coordinates. In this case, the mesh is a 3-dimensional, row-major ordered array. We also provided a function to look up and record the currently executing iteration. We ran LULESH for a 453 -resolution mesh while obtaining semantic memory access samples for the code segment that runs the iterative simulation steps. We set the memory sampling configuration to sample an access every four instructions and only those with access latencies greater than 30 cycles.
(a)
(b)
(c)
(d)
Fig. 5: The visualized memory access performance data for two executions of LULESH with different specified thread affinities. (a) and (b) correspond to the execution with the default thread affinity, and (c) and (d) correspond to the execution using an optimized thread affinity for this particular hardware. The first execution shows that while the selected data is associated with a contiguous block of locations along the z axis, the utilized resources are split between both sockets, indicating poor thread locality. The second shows the same selection, this time with utilized resources lying next to each other on a single socket, indicating improved thread locality.
Thread Affinity L1 samples L2 samples L3 samples NUMA samples Sampled Memory Access Cycles Average Cycles / Sampled Access Execution Time
Default 2745 2931 1568 4 1112677 112.77 69.64s
Optimized 1966 1996 1099 0 624305 91.48 62.65s
TABLE I: The memory access performance and execution time for running LULESH with and without optimized thread affinity. The optimized version shows a significant reduction in the number of samples, indicating fewer accesses with more than 30 cycles. In addition, no NUMA accesses were recorded in the optimized version, which typically require 500+ cycles. The total number of cycles reduced by 44%, and the total execution time reduced by 10%.
Post-mortem analysis revealed a detrimental relationship between the utilized resources and the decomposition of the dataset. In our visualization program, we selected the accesses associated with a portion of the mesh, specifically, a range of coordinates in the z-axis. Fig. 4 shows the location of this selection in terms of the application mesh. This selection represents a contiguous block of data in the application, but we can see in Fig. 5 (a) and (b) that its accesses are associated with a set of hardware resources with little locality. Initially, the OpenMP directives were unchanged from the defaults except to bind threads to CPUs. The default thread affinity is in order, meaning OMP thread N is bound to CPU N for all threads and CPUs. On architectures where consecutive CPU IDs share memory resources, this effectively enables CPUs to read and write to shared caches. However, on this architecture, the CPUs are numbered such that all oddnumbered CPUs lie on one socket, and all even-numbered CPUs lie on another. Furthermore, logical CPUs that lie on the same physical CPU are numbered such that the difference between each pair is 16 (e.g., 2 and 18 share a physical CPU). The program was originally organized with the intention of exhibiting locality between threads. The dataset was decomposed such that the portion of data processed by thread 0 be close in address space to that of thread 1. However, due to the CPU numbering scheme, the execution achieved poor locality between parallel threads. We modified the thread affinity to reflect the order originally intended by LULESH. We set it such that consecutive pairs of thread IDs lie on the same physical CPU, and neighboring pairs lie on the same socket. The resulting execution exhibited highly improved memory access performance and ran 10% faster than the execution with default thread affinity. Fig. 5 shows the achieved thread locality for each of the two executions. The detailed performance results are shown in Table I. We may also detect more subtle performance behaviors, though we cannot make any definite conclusions based on these observations, but rather form hypotheses to test. We observed a correlation between memory access performance and the executing iteration. By selecting different sets of data
Fig. 6: Parallel coordinates showing memory access samples for an execution of LULESH. The number of samples increases linearly with the iteration, indicating a possible applicationspecific performance degradation. We also see a slight negative correlation between iterations and indices (indicated by crossing lines between the two axes), which possibly attributes the degradation to low-index accesses.
objects, we found some that exhibited patterns of behavior. The data object m_dvdz in particular was sampled at a linearly increasing rate over the iterations of the execution, suggesting that access efficiency for this object degrades over time (Fig. 6). This may be due to later iterations accessing the object more frequently or more sporadically, or it may be indicative of performance issues propagating delays to later iterations. The parallel coordinates view also shows a slight negative correlation between the access index and iterations. We can hypothesize that the performance degradation is due to slow accesses at lower indices. The lowest indices show a spike in the number of accesses, possibly indicating compulsory cache misses. B. XSBench XSBench isolates a computationally costly portion of OpenMC, a code that calculates neutron criticality [13]. The portion is responsible for calculating the effects of different media on a particle’s trajectory using Monte-Carlo methods. Because the code uses a Monte-Carlo sampling method, it incurs highly random accesses across large data buffers. This access pattern violates spatial and temporal locality, thus poorly utilizing caches. We instrumented the two large data objects that are pseudo-randomly sampled, one that contains energies and another that contains nuclide information. In the acquired XSBench data, we detected unexpected behavior in the hardware. The behavior found was independent of the program and further scrutiny revealed that it also appeared in the LULESH data, though not as clearly. We found a significant correlation between the socket IDs and two clusters in the access cycles. Socket 0 was associated with a cluster of lower average latency while socket 1 was associated with one of higher average latency, as shown in Fig. 7. We hypothesized that this behavior could possibly
Threshold \Frequency 8 16 32 64 128
1 7.279616 2.974080 2.944022 2.881519 2.870055
100 6.932973 2.984340 2.97409 2.872536 2.872094
10000 6.944184 2.987014 2.949461 2.878411 2.870017
TABLE II: Execution times for different configurations of memory access sampling. Rows are different latency thresholds and columns are different frequencies. While overhead correlates highly with latency thresholds, the frequency does not greatly affect overhead. (a)
(b) Latency Threshold 8 16 32 64 128
# of Samples 16901 6239 206 92 33
TABLE III: Number of sampled memory accesses for different latency thresholds. Frequency is fixed to 1. Samples quickly drop in number for higher thresholds. (c)
(d)
Fig. 7: The visualized data for two different selections of the XSBench performance data. (a) and (c) show the views when accesses from socket 0 are selected, and (b) and (d) show the same when accesses from socket 1 are selected. There is a significant correlation between the node and two clusters of samples along the latency axis.
indicate that the frequently accessed memory resides mostly on the NUMA domain of socket 0, thus causing multiple slow remote accesses from socket 1. It could also indicate a different hardware configuration for different sockets. We tested various hypotheses and eventually diagnosed the problem as a hardware configuration issue. Specifically, the architecture has a feature for automatic frequency scaling. We checked the scaling values and found that one socket had on average a higher frequency scaling that would account for the difference in cycles between the two clusters. Work has been done in the area of frequency scaling and has shown that often the scaling does not accurately reflect the workload and is often unpredictable [14]. In the case of multiple sockets, this behavior may cause sockets to vary significantly in capability and cause load imbalances. VIII.
OVERHEAD A NALYSIS
A primary goal for our method is minimizing overhead. This includes the computation time involved in the sampling module and semantic attribution as well as the corruption of memory resources. Particularly, as the SMT is searched for data addresses, its contents may populate caches and evict data that would otherwise have not been evicted. However, we evaluated the overhead of our method in terms of the added time alone, since there is no direct way to measure cache corruption overhead without causing more corruption.
As mentioned in Section V, using programmer-defined semantic attribution functions may greatly affect overhead. We evaluated the results using the instrumented version of LULESH explained in Section VII, which involves relatively simple semantic attribution functions. We show the execution times for different sampling configurations on LULESH in Table II. Decreasing the latency threshold greatly affects the overhead, but frequency has a fairly negligible effect on overhead in this case. A threshold of less than 7 causes such excessive overhead that the program crashes. On the other hand, the difference in execution times from a threshold of 64 to a threshold of 128 was nearly negligible. We know that changing the sampling frequency changes the number of dumped samples linearly, and from this information we can observe that the relationship between the latency threshold and overhead resembles a hyperbolic function—steeply decreasing at low values and approaching constant at higher values. We also performed tests to determine the granularity of the acquired data. Because frequency did not greatly affect the overhead, we measured the sample data for a fixed frequency and varying levels of latency thresholds. The results are shown in Table III. These results confirm those of Table II—the number of samples is primarily controlled by the latency threshold. We found that our method can successfully acquire a large number of memory access samples (6000-17000 samples in a 3-7 second run) while staying within feasible limits of added overhead. However, our module can also be configured to acquire a vast amount of samples with excessive overhead, and thus care must be taken to determine the proper configuration.
IX.
R ELATED W ORK
Many tools have attempted to address the memory bottleneck. However, prior work focuses mainly on connecting memory accesses to source code and to particular variables in the source code. It does not allow rich exploration of correlations with the NUMA topology or with dynamic application data structure properties, such as mesh coordinates. A. Memory Instruction Measurement Dean et al. [15] developed the first instruction sampling techniques in their ProfileMe framework for the DEC Alpha processors. This was the precursor to modern instruction sampling techniques only now appearing in Intel and AMD chips as PEBS and IBS, respectively [4]. PAPI [16] is a portable API for hardware performance counters. PAPI’s interface allows memory events to be counted and sampled, but with less precision than modern instruction sampling. For architectures without instruction sampling, Rutar and Hollingsworth [17], [18] have developed techniques to mitigate instruction skid so that data-centric attribution can be used with traditional PMUs and PAPI. These techniques would allow our measurement techniques to be applied with some precision loss on architectures that do not provide PEBS or IBS. B. Memory profiling tools Many tools have been developed to highlight cache locality problems [19]–[21], to highlight NUMA issues in code [22], [23], and to map these issues to particular variables through static analysis [17], [21], [24]. These techniques differ from ours in that they examine a much more limited set of correlations, and do not provide intuitive linked views of the different domains for analysis. In particular, none of these views provides mapping onto a hardware topology view to highlight data movement or load imbalance. Further, none of them provides mappings onto application semantic concepts such as mesh coordinates. C. Data-centric analysis Alpern et al. [25] introduced a memory visualization showing how data structures fit into different levels of cache. The visualization was a model and was not based on detailed measurement. Xu and Mellor-Crummey [8], [26] have developed the most sophisticated existing data-centric measurement techniques within HPCToolkit. Their techniques can highlight memory access patterns, latencies, and NUMA problems. However, their tool shows data numerically or with simple memory-domain visualization. It does not show correlations to the application domain or to the processor topology, and it does not allow for rich exploration of memory data. The measurement techniques and views in their tool could be used to complement our tool with additional access pattern analysis. X.
C ONCLUSIONS AND F UTURE W ORK
We developed novel methods to understand on-node memory access performance. This method involves a new sampling technique that is highly configurable and supports the acquisition of fine-grained memory access samples while avoiding
overhead and excessive unwanted data. Furthermore, we created a novel technique to map several semantic attributes to the samples that provide several meaningful contexts. These contexts allow performance analysts to better interpret memory access data. We evaluated both the effectiveness of analyzing our acquired data and the overhead incurred by our method. The data successfully helped us detect, diagnose, and solve performance problems in benchmark applications. In terms of overhead, we found that we could gather a sufficient amount of data for analysis with low overhead. The portions of our methods that have proven most successful are the gained intuition from high-level contexts and the ability to relate information between these contexts. Understanding data for analysis often requires a point of reference. Our method provides points of reference via a set of contexts that have proven intuitive to the programmers it is intended for. However, the context is intricately tied to a set of performance characteristics that it may elucidate, so it is essential to provide a varied set of contexts. The presented case studies involved only benchmark or proxy applications. We would like to apply our method to more complex codes and domains, such as AMR codes and multi-physics simulations, and explore the available contexts in them. Although we developed the instrumentation library with simplicity in mind, it still requires moderate familiarity with the code for successful instrumentation. Data objects of interest are specified by the programmer, and therefore the programmer is responsible for determining the relevant objects and the correct areas in the code to instrument them. It is possible to remove the burden of instrumentation by performing binary analysis and interception of memory allocation calls, similar to [8], and we would like to explore the kind of semantic attribution possible in such a scenario. The idea of semantic attribution is not specific to memory access performance data. We hope to expand the definition to include different types of performance data, such as power consumption. We expect different types of data to require the definition of new contexts and attributes in order to capture the performance characteristics associated with them. ACKNOWLEDGEMENTS This work was performed under the auspices of the U.S. Department of Energy by Lawrence Livermore National Laboratory under Contract DE-AC52-07NA27344 (LLNL-CONF658626). This effort was also supported by the University of California through its UC Laboratory Fees Research Grant Program. We thank John Tramm and Tanzima Islam for their valuable input regarding the performance characteristics of XSBench and the administrators for the Hyperion test bed for helping us in the testing phase of the kernel module. R EFERENCES [1]
“The International Technology Roadmap for Semiconductors (ITRS), System Drivers, 2009, http://www.itrs.net/.”
[2]
[3] [4]
[5]
[6]
[7]
[8]
[9]
[10]
[11] [12] [13]
[14]
W. A. Wulf and S. A. McKee, “Hitting the memory wall: Implications of the obvious,” SIGARCH Comput. Archit. News, vol. 23, no. 1, pp. 20–24, Mar. 1995. [Online]. Available: http://doi.acm.org/10.1145/216585.216588 Intel 64 and IA-32 Architectures Software Developer’s Manual - Volume 3B, Intel Corporation, August 2007. P. J. Drongowski, L. Yu, F. Swehosky, S. Suthikulpanit, and R. Richter, “Incorporating instruction-based sampling into amd codeanalyst.” in ISPASS. IEEE Computer Society, 2010, pp. 119–120. [Online]. Available: http://dblp.uni-trier.de/db/conf/ispass/ispass2010. html#DrongowskiYSSR10 F. Broquedis, J. Clet-Ortega, S. Moreaud, N. Furmento, B. Goglin, G. Mercier, S. Thibault, and R. Namyst, “Hwloc: A generic framework for managing hardware affinities in hpc applications,” in Proceedings of the 2010 18th Euromicro Conference on Parallel, Distributed and Network-based Processing, ser. PDP ’10. Washington, DC, USA: IEEE Computer Society, 2010, pp. 180–186. [Online]. Available: http://dx.doi.org/10.1109/PDP.2010.67 J. Treibig, G. Hager, and G. Wellein, “Likwid: A lightweight performance-oriented tool suite for x86 multicore environments,” CoRR, vol. abs/1004.4431, 2010. [Online]. Available: http://dblp. uni-trier.de/db/journals/corr/corr1004.html#abs-1004-4431 M. Schulz, J. A. Levine, P. T. Bremer, T. Gamblin, and V. Pascucci, “Interpreting Performance Data across Intuitive Domains,” in Parallel Processing (ICPP), 2011 International Conference on. IEEE, 2011, pp. 206–215. X. Liu and J. Mellor-Crummey, “A data-centric profiler for parallel programs,” in Proceedings of the International Conference on High Performance Computing, Networking, Storage and Analysis, ser. SC ’13. New York, NY, USA: ACM, 2013, pp. 28:1–28:12. [Online]. Available: http://doi.acm.org/10.1145/2503210.2503297 A. Inselberg and B. Dimsdale, “Parallel coordinates: a tool for visualizing multi-dimensional geometry,” in VIS ’90: Proceedings of the 1st conference on Visualization ’90. IEEE Computer Society Press, Oct. 1990, pp. 361–378. J. Stasko and E. Zhang, “Focus+context display and navigation techniques for enhancing radial, space-filling hierarchy visualizations,” Information Visualization, 2000. InfoVis 2000. IEEE Symposium on, pp. 57–65, 2000. K. Light, “Hyperion: A titan of high-performance computing systems,” Science and Technology Review, pp. 15–16, Dec. 2009. “Hydrodynamics Challenge Problem, Lawrence Livermore National Laboratory,” Tech. Rep. LLNL-TR-490254. J. R. Tramm, A. R. Siegel, T. Islam, and M. Schulz, “XSBench–The development and verification of a performance abstraction for Monte Carlo reactor analysis,” mcs.anl.gov. B. Rountree, D. Ahn, B. De Supinski, D. Lowenthal, and M. Schulz, “Beyond dvfs: A first look at performance under a hardware-enforced power bound,” in Parallel and Distributed Processing Symposium
[15]
[16]
[17]
[18]
[19] [20]
[21]
[22]
[23]
[24]
[25]
[26]
Workshops PhD Forum (IPDPSW), 2012 IEEE 26th International, May 2012, pp. 947–953. J. Dean, J. E. Hicks, C. A. Waldspurger, W. E. Weihl, and G. Chrysos, “Profileme: Hardware support for instruction-level profiling on outof-order processors,” in Proceedings of the 30th Annual ACM/IEEE International Symposium on Microarchitecture, ser. MICRO 30. Washington, DC, USA: IEEE Computer Society, 1997, pp. 292–302. [Online]. Available: http://dl.acm.org/citation.cfm?id=266800.266828 P. J. Mucci, S. Browne, C. Deane, and G. Ho, “PAPI: A portable interface to hardware performance counters,” in Proc. Department of Defense HPCMP User Group Conference, Jun. 1999. N. Rutar and J. K. Hollingsworth, “Data centric techniques for mapping performance data to program variables,” Parallel Computing, vol. 38, no. 1-2, pp. 2–14, 2012. ——, “Software techniques for negating skid and approximating cache miss measurements,” Parallel Computing, vol. 39, no. 3, pp. 120–131, 2013. W. Cachegrind, “a cache-miss profiler,” http://valgrind.org/docs/manual/cg-manual.html. B. R. Buck and J. K. Hollingsworth, “Data centric cache measurement on the Intel Itanium 2 processor,” in Supercomputing (SC’04), Washington, DC, USA 2004, p. 58. M. Martonosi, A. Gupta, and T. Anderson, “Memspy: Analyzing memory system bottlenecks in programs,” in Proceedings of the 1992 ACM SIGMETRICS Joint International Conference on Measurement and Modeling of Computer Systems, ser. SIGMETRICS ’92/PERFORMANCE ’92. New York, NY, USA: ACM, 1992, pp. 1–12. [Online]. Available: http://doi.acm.org/10.1145/133057.133079 C. McCurdy and J. S. Vetter, “Memphis: Finding and fixing NUMArelated performacne problems on multi-core platforms,” in IEEE Intl. Symp. on Performance Analysis of Systems Software (ISPASS’10), March 2010, pp. 87–96. R. Lchaize, B. Lepers, and V. Qu´ema, “MemProf: a memory profilers for NUMA multicore systems,” in USENIX Annual Technical Conference (USENIX ATC’12), Berkeley, CA, 2012. R. B. Irvin and B. P. Miller, “Mapping performance data for highlevel and data views of parallel program performance,” in International Conference on Supercomputing (ICS’96), New York, NY, USA, 1996, pp. 69–77. B. Alpern, L. Carter, and T. Selker, “Visualizing computer memory architectures,” in Visualization, 1990. Visualization ’90., Proceedings of the First IEEE Conference on. IEEE Comput. Soc. Press, 1990, pp. 107–113. X. Liu and J. Mellor-Crummey, “A tool to analyze the performance of multithreaded programs on NUMA architectures,” in PPoPP ’14: Proceedings of the 19th ACM SIGPLAN symposium on Principles and practice of parallel programming. New York, New York, USA: ACM Request Permissions, Feb. 2014, pp. 259–272.