Environment properties, such as temperature and smoke density, are the .... collects and accumulates the data X = [x1,...,x5]T from outside, then fires an output ..... Teacher Forcing [71, 72, 70] refers to the learning paradigm where learning is ...... kal=net.kalmanP*transpose(drp)*inv((drp)*net.kalmanP*transpose(drp)+net.
Distributed Learning in Sensor Networks — an online-trained spiral recurrent neural network, guided by an evolution framework, making duty-cycle reduction more robust Huaien Gao
M¨unchen 2008
Distributed Learning in Sensor Networks — an online-trained spiral recurrent neural network, guided by an evolution framework, making duty-cycle reduction more robust Huaien Gao
Dissertation an dem Institut f¨ur Informatik der Ludwig–Maximilians–Universit¨at M¨unchen vorgelegt von Huaien Gao geb. 25.10.1977
M¨unchen, den 27.05.2008
Erstgutachter: Hans-Peter Kriegel Zweitgutachter: Darius Burschka Tag der m¨ undlichen Pr¨ ufung: 26.Jan.2009
Acknowledgement This thesis is completed within the joint Ph.D. program between the department of Database and Information Systems in the Institute for Computer Science in the University of Munich and the department of Learning System in Corporate Technology, Siemens AG. Many people have given valuable advises during the research and the writing. Without their support, this thesis cannot have been written. Many thanks are due to Professor Hans-Peter Kriegel who has been supportive not only on my research activities but also on my application of “Aufenthaltsbewilligung” which is very important to me. Also thanks are due to Prof. Dr. Darius Burschka for his kindly agreement to act as the second examiner of this thesis. I would like to express my sincere gratitude to Dr. Rudolf Sollacher, in Corporate Technology in Siemens AG, for he has guided, instructed, encourage, inspired and continually motivated me. I am also very grateful to Dr. Paul-Theo Pilgram, in Corporate Technology in Siemens AG, for his generous hospitality to proofread the whole manuscript, and making the thesis much smoother. I am indebted to Prof. Dr. Bernd Sch¨ urmann and Dr. Thomas Runkler, heads of department of Learning System in Corporate Technology of Siemens AG, who have been constantly supportive to my research and given me advises on the thesis. Prof. Dr. Martin Greiner and Dr. Jochen Cleve are always helpful to me, no matter it concerns about my research or other difficulty. I will remember the help from colleagues both in Siemens AG and in University of Munich. The following list is undoubtedly incomplete: Dr. Kai Yu, Anton Maximilian Schaffer, Dr. Kai Heesche, Dr. Christoph Tietz, Dr. Hans-Georg Zimmermann, Dr. Peter Mayer, Dr. Peter Kunath, Mrs. Susanne Grienberger, Dr. Volker Tresp, Yi Huang, Dr. Marco Pellegrino, Mrs. Christa Singer. More than to anyone else, I own to the constantly love and support from my family. In every stage of my life, they always encourage, support and understand me. No matter the
vi
ACKNOWLEDGEMENT
difficulties I am facing, they are the ones who tell me never give up and give me the power to confront. This thesis is dedicated to them.
Abstract The sensor networks of today tend to be built from “intelligent” sensor nodes. Such nodes have substantial processing capability and memory, are locally distributed and communicate wirelessly with one another. They are mostly battery-powered, possibly even with a lifetime battery. Power management is hence a prime concern. Such intelligent sensors, or “smart sensors”, are typically involved in some diagnosis task, which would benefit greatly from an ability to predict environment data. The best of those predictions are obtained by training a learning-model with environment data. This task is non-trivial, computationally intensive and thus expensive on energy, particularly if the model imposed by the environment data is dynamic and complex. As the training data usually come from diverse sources, not only from the nearest sensor, the learning node must communicate with other nodes to get at their measurement data. Data processors can be made very energy efficient, whereas radio is inherently wasteful. The ultimate aim is to find the right balance between prediction quality and energy consumption. Unlike conventional energy management solutions, which provide routing methods or communication protocols, this thesis introduces an efficient learning algorithm which improves prediction performance of sensors and reduces computational complexity. It introduces two techniques which both reduce the overall energy consumption of the sensor network: intra-node and inter-node solutions. Intra-node solution: A sensor’s duty cycle is the time fraction during which the sensor is active. Battery life can be extended by reducing the duty cycle of the sensor. Depending on the communication protocol, radio communication coincides with more or less of the sensor’s active time. The radio duty cycle can be reduced by communicating less frequently. This thesis introduces Spiral Recurrent Neural Networks (SpiralRNN ), a novel model for on-line prediction, where some received data get substituted by predicted data. It is shown that the SpiralRNN model works reliably, thus opening a way to significant energy savings. Inter-node solution: Communication between sensor nodes can also be diminished at network level. Transmitting data (and receiving them) consumes energy and blocks the airwaves, but the information transmitted is often irrelevant (depending on the application). This thesis introduces a heuristic evolutionary method, the evolution
viii
ABSTRACT framework, which weighs up energy consumption against prediction performance, adapting its model structure to the environment data as well as to application constraints. The complexity of the model gets lowered by removing some hidden nodes. The communication effort gets reduced by removing dependencies on various “unimportant” data (which makes communication dispensable in those cases).
Spiral Recurrent Neural Networks (SpiralRNN ), in combination with duty-cycle reduction and the evolution framework, are a powerful technique for balancing prediction performance against energy consumption, and are hence valuable in the construction of sensor network applications.
Contents Acknowledgement
v
Abstract
vii
Contents
ix
1 Introduction
1
1.1
Goal . . . . . . . . . . . . . . . . . . . . . . . . . . . . . . . . . . . . . . .
1
1.2
Challenges and Solutions . . . . . . . . . . . . . . . . . . . . . . . . . . . .
2
1.2.1
Intelligence of Sensor Node . . . . . . . . . . . . . . . . . . . . . . .
3
1.2.2
Evolution Framework . . . . . . . . . . . . . . . . . . . . . . . . . .
6
Structure of Thesis . . . . . . . . . . . . . . . . . . . . . . . . . . . . . . .
6
1.3
2 State of the Art
9
2.1
Recurrent Neural Networks . . . . . . . . . . . . . . . . . . . . . . . . . . .
9
2.2
On-line Learning Algorithms . . . . . . . . . . . . . . . . . . . . . . . . . .
17
2.2.1
Gradient Descent Learning . . . . . . . . . . . . . . . . . . . . . . .
18
2.2.2
Back-Propagation . . . . . . . . . . . . . . . . . . . . . . . . . . . .
18
2.2.3
Kalman Filters . . . . . . . . . . . . . . . . . . . . . . . . . . . . .
20
2.2.4
Learning Paradigms
. . . . . . . . . . . . . . . . . . . . . . . . . .
21
Backgrounds on Sensor Network Application . . . . . . . . . . . . . . . . .
22
2.3
x
CONTENTS 2.4
Evolution . . . . . . . . . . . . . . . . . . . . . . . . . . . . . . . . . . . .
23
2.4.1
Genetic Algorithm . . . . . . . . . . . . . . . . . . . . . . . . . . .
24
2.4.2
Evolution Strategies . . . . . . . . . . . . . . . . . . . . . . . . . .
25
2.4.3
Evolution with Neural Networks . . . . . . . . . . . . . . . . . . . .
25
3 Spiral Recurrent Neural Networks 3.1
3.2
Structure and Eigenvalues . . . . . . . . . . . . . . . . . . . . . . . . . . .
27
3.1.1
Hidden Units . . . . . . . . . . . . . . . . . . . . . . . . . . . . . .
28
3.1.2
SpiralRNN s . . . . . . . . . . . . . . . . . . . . . . . . . . . . . . .
30
3.1.3
Eigenvalues in SpiralRNN s . . . . . . . . . . . . . . . . . . . . . . .
31
Implementation of SpiralRNN s . . . . . . . . . . . . . . . . . . . . . . . .
32
3.2.1
The Forward Phase . . . . . . . . . . . . . . . . . . . . . . . . . . .
33
3.2.2
The Training Phase . . . . . . . . . . . . . . . . . . . . . . . . . . .
34
3.2.3
The Autonomous Test Phase . . . . . . . . . . . . . . . . . . . . . .
41
4 Applications with SpiralRNN s 4.1
4.2
4.3
27
43
Experimental Settings . . . . . . . . . . . . . . . . . . . . . . . . . . . . .
43
4.1.1
Tasks . . . . . . . . . . . . . . . . . . . . . . . . . . . . . . . . . . .
43
4.1.2
Networks
. . . . . . . . . . . . . . . . . . . . . . . . . . . . . . . .
45
4.1.3
Training . . . . . . . . . . . . . . . . . . . . . . . . . . . . . . . . .
47
4.1.4
Testing and Measurement . . . . . . . . . . . . . . . . . . . . . . .
48
Simulations with Time Series Prediction . . . . . . . . . . . . . . . . . . .
49
4.2.1
Spike21 Dataset . . . . . . . . . . . . . . . . . . . . . . . . . . . . .
50
4.2.2
Mackey-Glass Dataset . . . . . . . . . . . . . . . . . . . . . . . . .
51
4.2.3
Lorenz Dataset . . . . . . . . . . . . . . . . . . . . . . . . . . . . .
54
4.2.4
Discussion . . . . . . . . . . . . . . . . . . . . . . . . . . . . . . . .
55
MouseTracking with SpiralRNN s . . . . . . . . . . . . . . . . . . . . . . .
56
CONTENTS
4.4
4.5
4.6
xi
4.3.1
The MouseTracking . . . . . . . . . . . . . . . . . . . . . . . . . . .
57
4.3.2
Training Data . . . . . . . . . . . . . . . . . . . . . . . . . . . . . .
57
4.3.3
Competing Models . . . . . . . . . . . . . . . . . . . . . . . . . . .
59
4.3.4
Evaluation Methods . . . . . . . . . . . . . . . . . . . . . . . . . .
60
4.3.5
Results & Discussion . . . . . . . . . . . . . . . . . . . . . . . . . .
60
Conditional Prediction with SpiralRNN s . . . . . . . . . . . . . . . . . . .
63
4.4.1
Scenario . . . . . . . . . . . . . . . . . . . . . . . . . . . . . . . . .
64
4.4.2
Conditional Prediction with RNNs . . . . . . . . . . . . . . . . . .
65
4.4.3
Experimental Settings . . . . . . . . . . . . . . . . . . . . . . . . .
68
4.4.4
Results . . . . . . . . . . . . . . . . . . . . . . . . . . . . . . . . . .
70
NN5 Competition of Data Prediction . . . . . . . . . . . . . . . . . . . . .
75
4.5.1
Towards NN5 Competition . . . . . . . . . . . . . . . . . . . . . . .
75
4.5.2
Results . . . . . . . . . . . . . . . . . . . . . . . . . . . . . . . . . .
80
Analysis on SpiralRNN s . . . . . . . . . . . . . . . . . . . . . . . . . . . .
82
4.6.1
Stability of Attractors . . . . . . . . . . . . . . . . . . . . . . . . .
83
4.6.2
Short-Term Memory Capacity . . . . . . . . . . . . . . . . . . . . .
84
4.6.3
Associative Memory Capacity . . . . . . . . . . . . . . . . . . . . .
87
5 Solutions for Distributed Sensor Networks
91
5.1
The Duty-Cycle Reduction . . . . . . . . . . . . . . . . . . . . . . . . . . .
93
5.2
The Evolution Framework . . . . . . . . . . . . . . . . . . . . . . . . . . .
94
5.2.1
Evolution-Operation-Selector . . . . . . . . . . . . . . . . . . . . .
96
5.2.2
Constraint Conditions . . . . . . . . . . . . . . . . . . . . . . . . .
97
5.2.3
Model Training . . . . . . . . . . . . . . . . . . . . . . . . . . . . .
98
5.2.4
Fitness Values . . . . . . . . . . . . . . . . . . . . . . . . . . . . . .
99
5.2.5
Evolutionary Operations . . . . . . . . . . . . . . . . . . . . . . . . 101
5.2.6
Evolution Framework in a Nutshell . . . . . . . . . . . . . . . . . . 103
xii
CONTENTS
6 Simulations in Sensor Network Applications
105
6.1
Simulation Settings . . . . . . . . . . . . . . . . . . . . . . . . . . . . . . . 105
6.2
Simulation Results . . . . . . . . . . . . . . . . . . . . . . . . . . . . . . . 113
6.3
6.2.1
Simulation 1 . . . . . . . . . . . . . . . . . . . . . . . . . . . . . . . 114
6.2.2
Simulation 2 . . . . . . . . . . . . . . . . . . . . . . . . . . . . . . . 116
Discussion . . . . . . . . . . . . . . . . . . . . . . . . . . . . . . . . . . . . 117 6.3.1
Prediction Performance . . . . . . . . . . . . . . . . . . . . . . . . . 119
6.3.2
Energy Consumption . . . . . . . . . . . . . . . . . . . . . . . . . . 120
6.3.3
Early Depletion . . . . . . . . . . . . . . . . . . . . . . . . . . . . . 123
7 Summary and Conclusion
127
List of Appendices A Eigenvalue Spectrum of SpiralRNN s
131
A.1 Preliminaries . . . . . . . . . . . . . . . . . . . . . . . . . . . . . . . . . . 131 A.2 Eigenvalue Spectrum of Spiral Units
. . . . . . . . . . . . . . . . . . . . . 132
A.3 Eigenvalue Spectrum of SpiralRNN s . . . . . . . . . . . . . . . . . . . . . 133 B MatLab Code for SpiralRNN Models
137
C MatLab Code for MouseTracking
151
List of Figures
159
List of Tables
163
Bibliography
165
Chapter 1 Introduction Recent decades have seen widespread deployment of embedded electronic devices with forever increasing computational capabilities [1, 2, 3, 4, 5]. Examples of such devices are mobile phones, personal digital assistants, but also wireless sensor nodes [6, 7, 8, 9, 10, 11, 12]. The latter in particular - besides measuring all kinds of quantities like temperature, pressure and luminosity - are able to communicate with neighboring sensor nodes and to exchange information with each other. Due to these features, many sensor nodes together constitute a sensor network, which is applied at a large scale in periodical environment monitoring [13, 14, 15], such as pollution detection, building management, production monitoring, traffic analysis, and temperature recording. The conventional approach for sensor network applications consists in spreading sensors across the area of interest, making them measure the relevant data, and to have a central station which collects all the information from surrounding sensors and which processes the data thereafter. Even though energy for one single sensor could be saved by increasing the number of sensor nodes, so that communication via multi-hop transmission is cheaper in this high-density network, the trend [16] is to put more computing capability into the sensor node itself and to communicate with other nodes only when necessary, thus saving even more energy. Sensor nodes in the network are not subordinate to any other node but are able to collect, process and communicate information at their own will. Together they constitute a distributed sensor network.
1.1
Goal
Designing and setting up a distributed sensor network is a complicated engineering task, comprising issues [16] like: selection of the collaborative signal processing algorithms executed in each sensor node; selection of the multi-hop networking algorithms; optimal
2
1. Introduction
matching of sensor requirements with communication performance; designing a security protocol for this pervasive network. This thesis focuses on designing, for sensor networks with a prediction service, an online learning algorithm for each sensor node, and an operating framework on the network level, with the overall aim of reducing energy consumption and adapting to shifts in the environment, while maintaining sensor network performance.
1.2
Challenges and Solutions
Challenges in designing such an on-line learning algorithm and operating framework will lie mainly in the following areas: Autonomy and autarky Sensor nodes are commonly deployed in locations where cable access is either impossible or expensive. Owing to this, most sensor nodes are battery powered and impossible, or expensive, to be recharged. Therefore, energy is extremely precious in sensor nodes, making energy management one of the paramount issues when designing sensor networks. Another consequence of autonomy is the need for sensor nodes to organize themselves by learning and adapting to a changing environment. Limited computational power Progress in integrated circuit technology has vastly improved the processing capacity (including the capability for data processing and data communication as well as storage memory) of sensor-node computers. Nonetheless, the limited available energy of sensor nodes implies the usage of microprocessors and memory components with reduced capabilities. Therefore, any information processing within the sensor nodes has to take into account the corresponding limitations. A straight-forward implementation of existing algorithms will fail in most cases. Complex dynamics The dynamics of the measured environment data can be complicated, for example if the current value of the dynamics depends on the long-term historical value, or if the dynamic model at one location is related to the one at another location. In some cases, therefore, the dynamics of the measured data are a complicated system with temporal and spatial characteristics. The mentioned challenges in distributed sensor network applications are interrelated. To name a few: the limited energy can hinder a comprehensive evaluation, and can thus cause an early depletion of network energy; improvements in processing ability can optimize the consumption of energy; complicated dynamics will normally require more comprehensive data processing and larger storage memory; self-organization affects the demand for communication, which affects the consumption of energy.
1.2 Challenges and Solutions
3
The energy limitation is a major problem in these applications. Many studies have focused on this topic, particularly on the optimal topology of sensor networks [17, 18, 19]. This thesis shows a novel way of saving energy: by applying learning algorithms to the embedded sensor-node system. The approach is built around two central ideas: (1) putting intelligence into the sensor nodes, i.e. a prediction ability, which is essential for duty-cycle reduction, the reduction of communication activity; (2) using the evolution framework, i.e. giving sensor nodes the ability to exchange information and to adapt to the environment, and also to reduce the communication and computation effort to some extent.
1.2.1
Intelligence of Sensor Node
Requirements In self-organizing autonomous distributed sensor networks, any solution for the prediction of sensor data must satisfy certain requirements. They will determine the design of the prediction model. They are: < R1 > Autonomy: No or little a priori knowledge about the environment shall be available to the sensor nodes. This implies that there will be no pre-training of parameters for the given problems, and that the sensor nodes have to construct their prediction models basically from scratch and on-line. < R2 > Adaptivity: Shifts in the environment, rarely known in advance, result in the switching of dynamics. Sensor nodes must be able to detect changes, and accordingly adjust the model parameters in real-time. < R3 > Efficiency: As real-time reaction is required, the solution for prediction should be efficient in terms of fast convergence, computational costs (number of arithmetic operations) and data storage requirements. Candidate learning systems are required to be compact as well as robust. < R4 > Reliability: Unreliability of one sensor node can dramatically degrade the performance of the whole network. Thus, reliability of the system is essential, particularly for long-run performance. The reliability requirement implies that instabilities and singularities should not occur during training. Benefits A focal “intelligent” feature is the sensor nodes’ ability to predict future values of their own measurement data. Two use cases will illustrate the benefits: 1. Neighboring sensor nodes exchange their sensor data for resilience and for innetwork data interpolation. In order to increase their lifetime, sensor nodes
4
1. Introduction have to reduce energy-consuming activities, in particular wireless communication with their neighbors. If the sensor nodes are able to predict their own sensor data and those of their neighbors, they can prolong the intervals between data exchanges, thus saving energy. 2. In control applications, sensor data may be required at regular time intervals. However, wireless communication is inherently unreliable: transmissions may sometimes be corrupted or may even fail, due to interference effects. If sensor nodes are able to predict sensor data, they can at least partially compensate for such faulty transmissions.
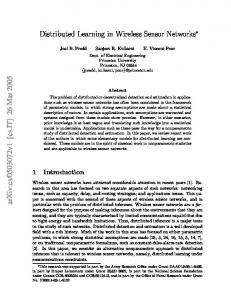
Task Environment properties, such as temperature and smoke density, are the main objectives which sensor nodes measure and predict. System dynamics of environment properties are normally temporal such that the current value depends on the previous status; it can also be spatial such that property values at one location depend on the data from their nearby surroundings. Therefore, using a description in discrete time-steps, numbered by variable t (same in the following chapters), one can use vector ~xt to represent the property value at all the sensor nodes at time t, and use eq-(1.1) to represent the system dynamics of the environment in general, where symbol U denotes the system dynamics of the property in the domain. The measurement behaviour of the sensor node is expressed by eq-(1.2). A sketch example of the environmental dynamics is shown in fig-1.1(a). These properties in the domain satisfy certain physical dynamics equations which are usually nonlinear and complicated. However, the physical insight into the environment is a black box to the observer. One needs to find an approximation model describing the dynamics of the environment.
~xt+1 = U (~xt , ~xt−1, · · · ), ~yt = M (~xt )
where ~xt = [xt,1 , xt,2 , · · · ]T
(1.1) (1.2)
Solution The multi-layer perceptron (MLP ) model is proven to be a universal approximator [20, 21] but it fails to model dynamics with long-term dependencies. Extensions of the MLP model, such as time-delayed neural networks (TDNN ) [22, 23], can to some extent compensate for this drawback by assigning more data as input information, but this requires users to be aware of physical conditions which in many cases are not available (refer to < R1 > on page-3). Based on MLP, Recurrent Neural Network (RNN) models are able to approximate a large class of dynamic systems [24], including ones with long-term dependency, because RNN models possess recurrent neurons which can store history information from input data.
1.2 Challenges and Solutions
5
xt+1 = U (~ xt , · · · ) ~st = H (~st−1 , · · · ) Win
Wout
~ yt = M (~ xt ) (a) Environment
(b) Transform
(c) Hidden Layer in RNN
Figure 1.1: Transforming between the dynamics of the environment and the ones of a recurrent neural network. (a) Environmental dynamics. The curve represents the dynamics U of the environment, which will be projected on the plane surface by the function M which reads out or measures the current data. (b) Transform of dynamics using multiplier matrices Win and Wout . Matrix Win imports the environmental data into the hidden state, whilst matrix Wout provides the mapping from the hidden-state vector space to the environment vector space. (c) Dynamics of hidden states of RNN, which have a form similar to the environmental dynamics but in a different vector space.
The RNN architecture comprises the ability of storing information on the previous history in its hidden-state vector. The typical structure of RNN consists of input layer, hidden layer and output layer, within each of which layer a vector can represent the activation value of corresponding neuron nodes, namely ~vin , ~s and ~vout for input layer, hidden layer and output layer respectively. A typical implementation of RNN can be stated as in the following equations: ~st = H (Whid~st−1 + Win~vin ) ~vout = G (Wout~st ) where Whid Win Wout denote weight matrices of synaptic connections between input, hidden and output layers; activation functions are represented by symbols H and G . For further information on recurrent neural networks, please refer to chapter-2. Note that the current value of hidden-state vector ~st is a function of its own measurement value at previous time step ~st−1 and other information (in this case, the input data ~vin ). It can therefore be regarded as an accumulation of its own history, and expressed using a mapping H , in general: ~st = H (~st−1 , · · · ), as shown in fig-1.1(c). With the Recurrent Neural Network architecture as a black-box model, one can build the approximated dynamics model of the environment from the observed data. The main idea is to use the RNN model for converting the dynamics of the environment into the dynamics of the hidden states of the RNN model, and use the read-out matrix Wout as the interpretation method for the final output. Such a dynamics
6
1. Introduction transformation is illustrated by fig-1.1(b).
1.2.2
Evolution Framework
Evolutionary operations modify the structure of the learning model instead of merely modifying model parameter values. They cause therefore usually abrupt changes of the learning model in question, which as a result requires a learning model with fast convergence. Benefits of using the evolution approach are (1) that it modifies the model structure in order to alter the dependence of the model on some data from outside, for instance the dependence of the neural network structure on one particular input data item; (2) that it reduces the complexity of the learning model because of constraints of the application and of the hardware configuration; (3) that it is robust enough to be able to adapt to drifts in the environment. However, most of the available evolution methods are based on genotype selection within a large population. These evolution methods cannot be applied in sensor networks because of the constraints on processing speed and on storage memory as well as communication bandwidth etc. Hence, one is looking for an evolution method suitable for sensor network applications, with the aim that sensor nodes can exchange information, thus better adapting to the environment.
1.3
Structure of Thesis
This thesis is roughly divided into four parts: chapter-2 describes the state-of-art on learning models and provides background on sensor network applications; the second part including chapter-3 and chapter-4 is concerned with a novel structure of RNN, including comparisons with conventional RNN models; the third part, including chapter-5 and chapter-6, focuses on the duty-cycle reduction and evolution framework schemes developed for sensor network applications and related simulations; the last part is the conclusion in chapter-7. chapter-1 (the current chapter) explains the target of this thesis and its challenges as well as the solution in general; chapter-2 presents the current research in related topics, mainly in two categories including Recurrent Neural Network structure and evolution algorithms; chapter-3 introduces a novel Recurrent Neural Network structure which is efficient and stable for long-term prediction tasks; chapter-4 compares results from the novel neural network structure with those from conventional structures;
1.3 Structure of Thesis
7
chapter-5 explains the reduction of energy consumption in sensor networks, based on the duty-cycle reduction scheme and on the evolution framework scheme; chapter-6 presents evidence of improvement in sensor networks in terms of energy consumption, by using duty-cycle reduction and evolution framework schemes chapter-7 concludes the thesis.
8
1. Introduction
Chapter 2 State of the Art Each sensor network application represents much knowledge and know-how from academia and industry, such as network topology, communication protocols, integrated circuits, and embedded learning models. In this chapter, some previous work concerned with sensor network applications will be discussed. The discussion will be limited to topics directly related to the solutions given in this thesis, as there are: neural network architectures and on-line learning algorithms, evolution algorithms and the background of sensor networks.
2.1
Recurrent Neural Networks
Modern neural network architectures, particular those used in off-line tasks, are complicated hybrid combinations of diverse neural structures [25, 26, 27, 28] with various statistics models [29, 30, 31, 32, 33]. In this section, due to the sensor nodes’ limited processing capacity, neither such hybrid structures nor those evolutionary neural models [34, 35, 36, 37] will be discussed. The state-of-the-art neural network architectures mentioned in this section basically differ from each other in the structure of recurrent coupling topology inside the hidden layer. A gradient calculation for each neural architecture will also be considered, since it is one of the main factors of the learning model. Before the discussion on recurrent neural networks (RNN), the concept of an artificial neuron will be given first. Computation with artificial neural networks was inspired by the functionality of a biological neural network, namely the human brain. Similar to a biological neuron, the artificial neuron has the structure as shown in fig-2.1(a) [38] where the neuron ~ = [x1 , . . . , x5 ]T from outside, then fires an output collects and accumulates the data X after applying a summation over a nonlinear function g(x), called the activation function, with the summation sometimes being called the “netin” of neuron. This is formulated in
10
2. State of the Art
eq-(2.1), where b is the bias of the neuron, resembling the neuron’s activation threshold. ! X y=g wi xi + b (2.1) i
An artificial neural network is an ensemble of many artificial neurons, where in most cases groups of neurons activate synchronously and propagate their activation to another group of neurons. The classical example is the feed-forward operation between two layers of neurons as shown in fig-2.1(b), with blacked-out circles representing neurons, a hollow circle denoting the bias “neuron” with activation value “1”. Note that neurons within each group (layer) are usually independent from each other. Eq-(2.2) depicts such a situation of activation of the neuron-layer. A classical artificial neural network basically consists of groups of neurons connected from one group to another, in such a way that information is propagated. ! X wi,j xj + bi , ∀i yi = g (2.2) j
x1 x2 .. . xi
w1 w2 .. .
1
b
bi g(x)
y
wi neuron (a) activation of a neuron
wi,j yi xj (b) layers of perceptrons
Figure 2.1: The activation of an artificial neuron and the feed-forward between layers of neurons. (a) Activation of a neuron with input data from outside, where the summation of input and bias will be subjected to the nonlinear function g(x). (b) Synchronization of activation between layers of neurons, with black circles as neurons and a hollow circle as the bias “neuron” with activation value “1”.
A recurrent neural networks (RNN) is a special class of artificial neural networks whose neurons within one layer can be directly or indirectly independent from each other, so that historical information can be stored in these self-coupling neurons. Forwarding in recurrent neural networks in general can be expressed as in eq-(2.3) and eq-(2.4): st = H (Wt , st−1 , xt−1 ) xt = G (Wt , st )
(2.3) (2.4)
2.1 Recurrent Neural Networks
11
where H is the mapping from input data xt−1 and the previous hidden-state vector st−1 to the current hidden state vector st , and G is the mapping from st to the network’s final output xt . Such iterative forwarding will partially accumulate the information from vector ~x and store it in the hidden state vector ~s, such that st L99 {xt−1 , xt−2 , · · · } where symbol L99 represents the data-fusion direction. From this information pool, represented by ~s, the output mapping can render a precise report to the network output. Such rendering mapping G is normally a simple linear function, with or without a squashed function on top of it. Therefore, most RNN models differ from each other in the mapping H , consequently in the topology of hidden-neuron connections or the structure of the hidden layer. A sketch of RNN in general is given in fig-2.2. In the following text, several RNN models will be discussed focusing on the difference in structure of the hidden layer.
H .. . Input Layer
St
.. .
Hidden Layer Output Layer
Figure 2.2: Sketch of the mechanism of recurrent neural network models in general, whose main contribution lies in the recurrent coupling in the hidden layer, where historical information is stored.
In the following, Wloc is used to denote the synaptic links in different locations, e.g. Win denotes the values of connection weights from the input layer to the hidden layer, Whid denotes the values of recurrent connection inside the hidden layer and Wout denotes those value of connections from the hidden layer to the output layer. Symbol b denotes the bias of hidden and output neurons. All of Wloc , b and the fixed weights1 together constitute the vector of system parameters Wt in eq-(2.3) and eq-(2.4). Note that only those trainable weights will be taken into account in the calculation of the gradient matrix (i.e. network output gradient w.r.t. trainable weights), and hence influence the computational cost of the learning algorithms. In this section, diagrams have been employed to depict the structure of different neural network models. If nothing else if stated, black dots represent the neuron nodes of neural network, arrows are synaptic connections between neurons or between layers (dashed arrows are connections under training; solid arrows are constant connections with fixed weights). Group of similar neurons are enclosed in a block circled with closed dash-dot line, in order to show the scope of mappings H and G . Depending on the size a block, connections from or to a block of neurons will be full connections of a m-to-n mapping but, for the sake 1
In this thesis, fixed weights occur only in the echo state network model which will be discussed later.
12
2. State of the Art
of simplicity, only a few of such connections are drawn. Connections from one neuron to another will always be 1-to-1 connections. Time Delay Neural Networks (TDNN ): The classic multi-layer perceptron (MLP ) architecture doesn’t have recurrent connections, but it is worth discussing since all RNN models are based on or inspired by this structure. The MLP model has been mainly used for static regression or classification problems [39, 40, 41]. However, extensions of MLP have also been applied to temporal tasks such as time series prediction and time series classification [42, 43, 22]. Besides current available data, a typical extension uses also previous data as network input in order to turn the temporal sequence into spatial patterns on the input layer of the network. Such a structure is called a time-delay neural networks (TDNN ) model [22, 23, 44]. For sufficient modeling power, the TDNN should have at least 3 layers. Otherwise it would be basically a linear autoregressive model with additional squashing of the outputs by a saturating transfer function such as the “sigmoid” function. With j = [1, . . . , d] labeling the different components of the d-dimensional data and τ denoting the number of previous data to be memorized for modeling, the 3-layer TDNN architecture has the following update equations: st = H (st−1 , wt , xt−1 ) xt = G (st , wt ) = g(ag ) = g (Wout h(ah ) + b2 ) = g (Wout h(Win st + b1 ) + b2 ) where H (. . . ) is realized as follows: � st−1,i+1+(j−1)∗τ if i = 1, . . . , τ − 1 st,i+(j−1)∗τ = ˆ t−1,j x if i = τ In this model, function h(. . .) is the identity map; activation function g(. . .) is the squash function “tanh”, where it is understood that for vector arguments the squashing function is applied to each vector component individually. The mapping H (. . .) in the TDNN model is just a shift register for input vectors and is not subject to learning. Fig-2.3(a) shows the typical structure of such a TDNN architecture for a 3-dimensional time series with τ = 4, where only the two-layered output mapping G has to be trained. The calculation of gradient Ψ in TDNN is given by the following equations: � � dxt dg ∂ag ∂ag dh ∂ah Ψ= = + dw dag ∂w ∂h dah ∂w The main drawback of the TDNN structure is the need to fix the time window for temporal memory in advance, i.e. the value of the parameter τ . This requires some
2.1 Recurrent Neural Networks
13
prior knowledge about the environment which contradicts the requirement < R4 > on page-3. In the case of an insufficient τ value, the TDNN model even fails to modulate the dynamics of a simple spike time series (ref. section-4.1.1). As shown in fig-2.3(b), black dots at the bottom represent the data stream values at successive time steps. The two shaded bars represent the input data Xt1 and Xt2 of time steps t1 and t2 respectively, and two hollowed red dots represent the corresponding target values xˆt1 and xˆt2 of TDNN. Because of the character of the spike time series, there is no difference in input data Xt1 and Xt2 , as shown in the figure. Being a static modeling architecture, the TDNN model produces outputs of the same value and fails to predict the approaching spike xˆt2 .
Output Layer
TDNN
G
1
1 1 1 1
Hidden Layer
1
111111 000000 000000 000000Xt1 111111 111111 000000Xt2 111111 τ τ xˆt1 xˆt2
H 1
1
1
(a) TDNN
1 1 1
data stream Input Layer
(b) TDNN with spike stream
Figure 2.3: (a) Example of a TDNN model, with 3-dimensional data and the number of data-patterns going up to 4. Note that the values of connection weights in the pseudo hidden layer are constant and equal to 1, which means that history is simply duplicated and shifted. (b) Example of a TDNN model being trained with a spike time stream. Black dots at the bottom denote data stream values with two peaks in the time window; the shaded bar represents data of length τ collected from the input data stream to the TDNN model, where Xt1 and Xt2 are inputs at different time steps, their corresponding targets being x ˆt1 and x ˆt2 .
Simple Recurrent Nets (SRN ): Unlike a shift register in TDNN, a recurrent neural network (RNN) model has recurrent couplings. Thus it has the theoretical ability to embed an infinite history within its recurrent hidden layer, constituting in effect an infinite impulse filter [45]. Elman [46] introduced simple recurrent neural networks (SRN ) with a duplicated context unit of the hidden layer in MLP, which at the core constituted a fully connected hidden layer of a RNN as shown in fig-2.4(a). Since then, RNNs have been applied successfully in many applications, but mostly they were trained off-line [28, 47].
14
2. State of the Art The discrete update equations of a SRN are: st = = xt = =
H (st−1 , wt , xt−1 ) = h(ah ) ˆ t−1 + b2 ) h(Whid st−1 + Win x G (st , wt ) = g(ag ) g(Wout st + b1 )
(2.5) (2.6)
where g(. . .) is the identity output activation function and h(. . .) is the “tanh” hidden activation function; Whid , Win and Wout are the corresponding synaptic weights respectively; b1 and b2 are bias parameters of output and hidden neurons. According to eq-(2.6) and eq-(2.5), the gradient Ψ is calculated as follows: � � dst dh ∂ah dst−1 = + Whid dw dah ∂w dw � � dg ∂ag dst dxt = + Wout Ψ= dw dag ∂w dw dst Note that calculation of dw is based on the RTRL method, therefore the previous derivative of state vector w.r.t. model parameters is stored at each time step.
The fully occupied matrix Whid of recurrent synaptic weights will be trained. As matrix Whid is basically unbounded, on-line training may modify the matrix value such that the recurrent layer could become dynamically unstable. Thus it could happen that learning doesn’t converge or is trapped in a bad solution, contradicting to the requirement < R4 > on page-3. Echo State Neural Networks (ESN ): Jaeger [48, 49] proposed the echo state neural networks (ESN ), aiming at simple learning while trying to avoid dynamic instabilities. ESN s can have the same topology as SRN s, as shown in fig-2.4. However, in this approach, values of entries of Whid and Win are kept fixed and initialized with random values; furthermore the former is re-scaled such that its largest absolute eigenvalue does not exceed a predefined limit λmax < 1; this “echo state” property of the hidden layer guarantees the diminishing influence of past states and consequently avoids instabilities in the dynamics of the recurrent hidden layer. This property of ESN s is responsible for its name because input information is propagated through the hidden layer like an echo, becoming weaker with each iteration. Despite this “echo-state” property of the recurrent hidden layer, ESN models are able to simulate e.g. chaotic time series. This can be achieved by an outer feedback looping from the output of the network to its input. As the only parameters which are subject to learning in the ESN model are the weights Wout of the linear output mapping, this awards the ESN model a simple learning process. The update equation for the hidden states of ESN s is similar to eq-(2.5) for SRN s, except that the matrices Win and Whid are merged into one single
2.1 Recurrent Neural Networks
15
Output Layer
Output Layer
G
G
H
H
Hidden Layer
Hidden Layer Input Layer
Input Layer
(b) ESN
(a) SRN
Figure 2.4: The SRN and ESN models, whose topology can be identical except for the difference in the variable-or-constant condition of connection weights. Both of them possess a hidden layer with random topology. (a) The SRN model with variable connection weights, particularly that of mapping H , can adjust the mapping H accordingly, though such unconstrained mappings can make system unstable; (b) The ESN model with constant connection weights except in output mapping G . Manual pre-tuning of the eigenvalue-spectrum of mapping H makes the ESN model stable and efficient, though leaving mapping H unchanged during training can reduce the robustness of the model.
matrix Wf ix indicating that the values of its entries are fixed. The update of the output states obeys eq-(2.11). st = H (st−1 , wt , xt−1 ) = h(ah ) ˆ +b ) = h (Whid st−1 + Win x � � � t−1 � 2 st−1 = h Wf ix + bf ix ˆ t−1 x xt = G (st , wt , xt−1 ) = g(ag ) � � �� st = g Wout ˆ t−1 x
(2.7) (2.8) (2.9) (2.10) (2.11)
where Wf ix and bf ix are now the prefixed synaptic hidden weights and bias, and they will not be considered in training. Fig-2.4(b) shows the structure of a ESN, where solid lines represent synaptic connections with constant weights whilst dashed lines represent connections to be trained. The gradient Ψ for the learning algorithm has a very simple form: Ψ=
dg ∂ah dxt = dw dah ∂w
(2.12)
The ESN approach requires a recurrent layer of large size in order to obtain a rich reservoir of dynamic states in the hidden layer. The size of the hidden layer depends
16
2. State of the Art mainly on the complexity of the learning task. Similarly, the limit value λmax has to be carefully chosen in advance to obtain better results; however, the proper choice of λmax is less critical than the one of the size of its recurrent hidden layer. It should not be too small to store enough historical information in the hidden states. A typical value for λmax is 0.8 [50]. The fact that values of input and recurrent connection weights in ESN s are constant has simplified the training procedure of the model and reduced the computational cost per iteration. However the fact that only the output connections are trainable can, on the other hand, degrade the generalization ability of the model, which will be proven in Chapter-4. In fact, as suggested by Jaeger [51], manually tuning the λmax value in each application is important for the ESN model in order to achieve the best performance. This requires a priori knowledge of the application and data, in contradiction to requirements < R1 > and < R2 > given on page-3. Output Layer
G H
Hidden Layer Input Layer
Figure 2.5: The structure of BDRNNs. Inside the hidden layer, every pair of neurons constitutes a block matrix in hidden weights and they are isolated from the other hidden neurons. Note that each sub-block has the same structure.
Block-Diagonal RNNs (BDRNN ): Sivakumar et al. [52] introduced the BDRNN model which possesses a hidden-weight matrix of block-diagonal structure. Each sub-block matrix is of size 2 × 2. Among variants of this block-diagonal structure, the scaled orthogonal version of the BDRNN is superior to the free-form version BDRNN [52, 53], where the former one consists of scaled orthogonal sub-matrices, whilst the latter one doesn’t have any constraint (i.e. entries of the matrix can theoretically have arbitrary value). In the scale orthogonal version, sub-matrix w ∈ R2×2 and its entries w = {w1,1 , w1,2 ; w2,1 , w2,2 } satisfy the following formulas: w1,1 = w2,2 ; w1,2 = −w2,1 ; 2 2 w1,1 + w1,2 ≤ 1.0 Therefore, the scaled orthogonal BDRNN model has feature similar to the ESN model, namely that the maximum absolute eigenvalue of the hidden-weight matrix
2.2 On-line Learning Algorithms
17
is limited, such that λmax ≤ 1. It is reported in [52] that the scaled orthogonal BDRNN with constrained eigenvalue spectrum has outperformed the free version (without constraint) BDRNN. The update equation of the BDRNN is similar to that of the SRN : ˆ t−1 + b2 ) st = h(Whid st−1 + Win x xt = g(Wout st + b1 ) though with a different structure of Whid , as shown in fig-2.5. Due to the paired structure, the number of hidden neurons in BDRNN s has to be even. The scaled orthogonal DBRNN model resembles ESN s in that the maximum absolute eigenvalue of Whid is limited to λmax ≤ 1.
2.2
On-line Learning Algorithms
Considering the presentation of training data, training methods for neural network models can be roughly categorized in two classes: batch training methods and on-line training methods. In batch training, the neural network model, in each iteration, is trained with a batch of data items at one time, such that the change △w of model parameter w is derived from the data set {ˆ x1 , . . . , xˆn }: wt = wt−1 + △w | {wt−1 , xˆ1 , . . . , x ˆn }
(2.13)
By contrast, on-line learning adjusts the model parameter in each iteration with the increment △w which depends on the current individual data, though in some cases also depending on the memory vector st , as in eq-(2.14). Memory vector st holds the history of input data, and can be realized as a hidden state vector in the recurrent neural network case. wt = wt−1 + △w | {wt−1 , st , xˆt }
(2.14)
Batch training methods using a finite training set in each iteration have generally demonstrated their ability to provide acceptable results. However, they requires significant computation power and massive amounts of memory, both unavailable or unaffordable in sensor network applications. On the other hand, on-line training methods have simplified the training process by taking only one data set into account in every iteration step. There is much empirical evidence that on-line learning can restore the trajectory of the batch learning model and find the minimum attractor imposed by the training data [54]. Many of the neural network learning algorithms, presented in this section, can easily be converted to its batch-mode for off-line use (some were originally introduced as batch-mode algorithms and were later modified to on-line ones). But as specified by the requirements in section-1.2.1 on page-3, only their on-line versions are addressed here.
18
2. State of the Art
In spite of the difference in learning algorithms, error functions of neural network applications will normally take the form as in eq-(2.15), where the evaluation error E measuring the Euclidean-like distance between output and target depends on parameters w, symbol yˆ stands for the corresponding target (the network output y can be expressed as a function of w such that y = f (w)), and the coefficient 12 is used for convenience of calculation. d
d
�2 �2 1 X � 1X yˆi − [f (w)]i yˆi − yi = E[w] = 2 i=1 2 i=1
(2.15)
With the definition of residual δ: δi = yˆi − yi = yˆi − [f (w)]i, ∀i,
(2.16)
the associated gradient calculation is given by eq-(2.17): d
d
X ∂yi X ∂[f (w)]i ∂E[w] = − δi =− δi ∂w ∂w ∂w i=1 i=1
2.2.1
(2.17)
Gradient Descent Learning
Being able to start from any starting point, gradient descent learning adjusts its parameters, as the name says, by following the error gradient. Given a task with an evaluation error E as defined in eq-(2.15) and also a gradient as in eq-(2.17), the parameter adjustment step is given in eq-(2.18) and the parameters are updated using eq-(2.19). d
∆wj
X ∂yi ∂E =η δi = −η ∂wj ∂wj i=1
wj = wj + ∆wj
(2.18) (2.19)
where η ∈ R+ is the predefined learning rate (usually chosen very small), j is the index, and δi is the corresponding residual for index i.
2.2.2
Back-Propagation
The back-propagation learning algorithm for multi-layer perceptron (MLP ) is a further development of gradient descent learning; it is very successful in research and application. Basically, back-propagation learning can be divided into two steps: the feed-forward step and the backward propagation step. Feed-forward of the MLP model involves conveying the information ~x from the input layer through the hidden layer (~s) to the output layer,
2.2 On-line Learning Algorithms
19
where output value ~y is supposed to coincide with target value yˆ, though in most cases they are not equal. In the backward propagation step, the residual of the network output, i.e. δ † = yˆ − ~y , (2.20) is fed backwards through the same synaptic connections, modifying the associated connection weights accordingly. These two steps are depicted in fig-2.6 where solid lines represent the feed-forward step and dashed lines represent back-propagation step. yˆ y δ
yi
† out wij
sj
δ‡ in wjk
xk
Figure 2.6: Back-propagation of MLP. The MLP model in the example has three layers, namely input, hidden and output layer. Inside these layers, they have {2,3,1} neuron nodes (black dots) respectively. Arrows show the direction of information flow: solid lines represent the feed-forward step and dashed lines represent the backward propagation step. Output and target are respectively denoted by y and yˆ, x and s represent the input and hidden state of the network, δ† is the corresponding residual for the output layer, δ‡ is the virtual residual for the hidden layer. The entries in matrices of the network out and those connections between hidden layer and output layer are given as wij in , where i, j, k are indices. between input and hidden layer are given as wjk For the sake of simplicity, it is assumed that a three-layer MLP model has linear activation functions for all neurons, and it uses the update equations in eq-(2.21) and eq-(2.22), where i, j, k are the index for output, hidden and input layer respectively. X in sj = wjk xk (2.21) k
yi =
X
wijout sj
(2.22)
j
The calculation of modification for weight wijout from hidden layer to output layer is given in below in eq-(2.23). For weight wjk from input layer to hidden layer the calculation can be expressed in a similar way as in eq-(2.24). Generally, the back-propagation algorithm first guesses the direct-output residual of weights belonging to one particular layer and then adjusts the respective parameters in the same layer accordingly.
20
2. State of the Art
∆wijout in ∆wjk
∂Ei out = ηδi† sj = −η ∂wij d X ∂E ∂Ei ∂sj = −η in = −η in ∂wjk ∂sj ∂wjk i=1 = η
where
δj‡ =
d X
δi† wijout xk = ηδj‡ xk
i=1 d X
δi† wijout
(2.23)
(2.24) (2.25)
i=1
2.2.3
Kalman Filters
A Kalman filter [55, 56, 57] is an optimal estimator, which estimates the value of state xt of a discrete linear system in eq-(2.26) and eq-(2.27), developing dynamically over time, where xt , the state of dynamics, is emulated in eq-(2.26) and zt , the observation of state, is given by eq-(2.27). A, B, H are constant matrices referring to the static parameters of the system. Symbols µt and νt represent the processing noise and measurement noise which respectively satisfy the zero-mean normal distributions: µt ∼ N (0, Qt ) and νt ∼ N (0, Rt ). xt = Axt−1 + But + µt zt = Hxt + νt
(2.26) (2.27)
Solving the mentioned dynamics system with a Kalman filter requires two steps, namely the time update updating the state according to the given model, and the measurement update, correcting the model obtained from the observation. In the time update step, state value xt and its covariance matrix Pt get updated according to the stochastic system in eq-(2.26): Pt† = APt−1 AT + Qt x− = Axt−1 + But t
(2.28) (2.29)
† where x− t and Pt are respectively the temporal values for the estimated state and its covariance, Qt is the covariance matrix of noise µt . When the observation zt+1 is available, its state value and covariance will be corrected according to: �−1 �� � −1 † T −1 + H Rt H Pt = Pt (2.30) � T −1 xt = x− zt − Hx− (2.31) t + Pt H Rt t
2.2 On-line Learning Algorithms
21
Extensions of this method have been successfully applied to non-linear system and on-line learning [58, 59, 60, 61, 62, 63, 64, 65]. Employing the extended Kalman filter (EKF) in training of recurrent neural networks, xt refers to the network parameters which are to be optimized, H refers to the gradient of observation (i.e. the target data corresponding to the network output) w.r.t. parameters. Looking for a stable model in the context of this thesis, parameters of a well trained network should stay close to the target parameter-set. Therefore, matrix A in eq-(2.26) is the identity matrix and the value of ut is set to ut = 0 representing the autonomy of dynamics without outer control force.
2.2.4
Learning Paradigms
Real-time recurrent learning Real-time recurrent learning (RTRL), introduced by Williams and Zipser [66], has been applied in many projects concerned with recurrent neural nets[67, 68, 69] where an on-line version is available without requirement on large amount of memory. The RTRL method is specific for recurrent neural networks where recurrent coupling exists in the hidden layer. In RTRL it is assumed that the values of the hiddenstate vector depend also on the weights, and should also contribute to the gradient calculation. Therefore, unlike back-propagation learning where gradient w.r.t. the weights is inversely propagated from output layer to input layer, RTRL requires the hidden-state gradient w.r.t. network parameters. Recalling the general evolving equation of hidden-state in recurrent neural networks: st = H (Wt , st−1 , xt−1 )
(2.32)
the calculation obeys eq-(2.33), where U = {Wt , xt } denotes the other variables besides the hidden-state vector s. ∂st ∂H ∂st−1 ∂H ∂U = + ∂W ∂st−1 ∂W ∂U ∂W
(2.33)
With the initial condition: ∂s0 =0 ∂W
(2.34)
reflecting that the initial value of hidden-state vector is independent from the network weight, the RTRL method manages the retention of gradient information over a time period of either fixed or indefinite length by iterating the gradient calculation in eq(2.33) at each time step. A sketch of RTRL paradigm is given in fig-2.7(a), where the dash line represents the feedback from the context unit. Teacher Forcing Teacher Forcing [71, 72, 70] refers to the learning paradigm where learning is driven
22
2. State of the Art trajectory of the model’s dynamics
Ut DATA
∂H ∂Ut
∂Ut ∂w
H ∂st−1 ∂w
∂H ∂st−1
st−1
st
x ˆt−1
teacher force
Z−1 x ˆt
Learning Model δ
(a) RTRL
(b) Teacher Forcing
target dynamics (c) Force of Dynamics
Figure 2.7:
(a) Real time recurrent learning paradigm, where the hiddenstate gradient w.r.t. weights at the previous time step will contribute to the calculation at the current time step; (b) Teacher forcing leaning paradigm (adapted from [70]) (c) Pursuit of dynamics by teacher forcing, with a solid red line indicating the target dynamics and a dashed line indicating the actual dynamics of the model which is always moving towards the target by means of the push from the data (short solid arrow line).
by data input from outside, such that the input value is more informative in terms of environmental dynamics. This has been shown to be an effective technique for a training algorithm. A schematic sketch of teacher forcing is shown in fig-2.7(b). The dashed curve represents the trajectory of dynamics of the learning model, gradually being adjusted by the teacher force and approaching the target dynamics imposed by the data.
2.3
Backgrounds on Sensor Network Application
Smart sensor nodes (with “intelligence”) contain not only the measurement unit but also a micro-controller unit (MCU) 2 for data processing, a memory unit for data storage and a radio unit for communication. Operations as well as activations of these units will take a certain amount of time and energy, which has to be considered when designing the sensor network. For example, the TelosB[73] is an ultra-economical wireless sensor module launched in 2004 by the University of California at Berkeley. TelosB sensor node is capable of transmitting data at up to 250 kbps and of handling sophisticated dataprocessing applications. Table-2.3 gives some specifics on the TelosB’s energy handling. Note that radio communication draws far more current than the other operations. 2
A micro-controller (MCU) in a sensor node resembles the CPU in a personal computer, but it is highly optimized regarding overall operating cost. Its design aims to keep the number of external components and connections low, which is why it has substantial on-chip ROM and RAM.
2.4 Evolution
23 Operation Draw Device Standby 5.1 µA MCU Idle 54.5 µA MCU Active 1.8 mA MCU + Radio RX 21.8 mA MCU + Radio TX 19.5 mA MCU Wakeup time 6 µs Radio Wakeup time 580 µs
Table 2.1:
Description Sleeping After wakeup but idle Data processing o Communication o Wakeup
Specifications of TelosB sensor. “Radio RX” refers to receive data, “Radio TX” refers to data transmission. Symbol “m” means 10−3 and “µ” means 10−6 . “A” (Amperes) is the unit for current and “s” (seconds) is the unit for time.
As sensor nodes in distributed sensor networks are usually supported by un-replaceable batteries, sensor nodes will usually be turned into sleep mode, in order to preserve energy, after their current work has been finished and will be re-activated when a wake-up event happens. In sensor network applications, the full cycle from activation to sleep and to re-activation is called a working cycle. Details of the working cycle depend on the device’s hardware and the requirements of the application. Fig-2.8 depicts a typical working cycle of a TelosB sensor node. At the beginning of the working cycle, the sensor is woken up as scheduled or triggered by a wake-up event. The time for wake-up of the MCU in TelosB is about 6µs, and wake-up of radio in TelosB takes 580µs. Having the sampled data, data transmission is carried out next, where the transmission serves data analysis purposes . After collecting all required data from neighbors, the smart sensor will trigger the learning process and improve the embedded model slightly. This can conclude the active time of the sensor node. In some cases, the sensor node may be asked to perform a prediction on its measurements where the prediction serves for further diagonal purpose. After this, the sensor node will go into sleep model till a wake-up condition is satisfied again. As energy management is important in sensor networks, one of the energy consumption criteria is the so-called “duty cycle”, i.e. the fraction of time during which the sensor is active and working, defined as Tτ (refer to fig-2.8).
2.4
Evolution
Computer algorithms derived from evolution theory have been caught much attention, particular from the computer games industry. The evolutionary algorithm (EA) is a generic
24
2. State of the Art measuring learning wakeup communication testing (optional)
sleeping
working time τ working cycle T
Figure 2.8: Typical working cycle of a sensor, consisting of “wake-up”, “sampling”, “evolution & transmit”, “learning”, “testing” and “sleeping”. Note that “testing” is only for evaluation purposes. Symbol τ represents the total time in each cycle where the device is activated, T represents the entire working cycle time. In general, the duty cycle is calculated as the ratio of τ divided by T .
population-based heuristic optimization algorithm. Inspired by Darwin’s biological evolution theory, the EA method involves similar operations, such as reproduction, mutation, crossover and selection. The state-of-the-art methods of EA, including those presented further below, are normally based on a large population of samples, which is hard to mirror in a sensor network application because of the limitations in memory and processing capacity. However, evolution concepts, e.g. selection and crossover, behind these EA methods have inspired the development of the evolution framework presented in chapter-5.
2.4.1
Genetic Algorithm
The genetic algorithm (GA) is a search algorithm aiming to find the global optimum parameter set. In GA, parameters of the function to be optimized are encoded in a genotype vector and the evaluation of parameters is based on the fitness value of a particular set of parameters. Optimization means in this case: finding the representation of the genotype vector providing the best fitness value. Inspired by evolutionary biology, the genetic algorithm also contains elementary operations of related concepts, including: inheritance, mutation, selection and crossover. In each generation, a population of sample individuals (i.e. candidate set of parameters) is given, and the fitness value of each individual in the population will be calculated. The selection procedure consists in choosing, based on the fitness value, the best or a group of the best individuals. They are the competition winners, and survive while all the other individuals are discarded. A new population, the next generation, can be formed by implementing mutation or crossover over the winners. The new generation will take part in the selection procedure of the next GA iteration.
2.4 Evolution
2.4.2
25
Evolution Strategies
Evolution Strategies (ESs) [74, 75] are a family of search methods that based on the population of candidate solutions. Its evolutionary operations are similar to the genetic algorithm and include selection, crossover and mutation. Each individual (parents included) in the population has a tuple of properties: {y, s, F (y)}, where vector y is an object parameter (i.e. a parameter which has to be optimized), s is a set of strategy parameters, F (y) is the fitness value of parameter set y. In each generation, a group of parents of size µ is initialized or inherits from the previous generation: P = p1 , p2 , . . . , pµ . From the entire parent population, ρ parents pi ∈ P, i = [1, . . . , ρ] are chosen to produce each offspring. Production of offspring should begin with the mutation of strategy setting s and then parameter-set y is formed based on the strategy setting s. Once the offspring generation is complete, its fitness value is evaluated, based on which the parents of next generation are selected. Based on the number of parents, individuals in each population, ESs is usually expressed in a general form: (µ + λ) − ES or (µ, λ) − ES. The difference between these two forms lies in the members of the population from which the parents of the new generation are chosen: in the (µ + λ) − ES scheme, new parents are selected from the offspring and old parents; in the (µ, λ) − ES scheme, old parents are not considered.
2.4.3
Evolution with Neural Networks
Evolutionary algorithms, e.g. GA and ES, are suitable for global searching and are easy to implement, and have therefore been combined with other learning methods, including neural network learning. Such hybrid algorithms use a neural network model in applications with e.g. prediction, classification and regression, while simultaneously searching, with the evolution algorithm, for a better neural network model (in terms of parameters or topology). with parameters: Belew et al. [76] encouraged in 1990 the combination of genetic algorithms with connectionist learning in neural networks, because “the use of GA provides much greater confidence in the face of the stochastic variation” and also because GA “can allow training times to be reduced by as much as two orders of magnitude”. One of the difficulties of this combination lies in the encoding of the connection weights into the discrete and binary genome string. In their paper, realvalued connection weights are assumed to be bounded within a region which will be divided into 2B intervals where B is application-defined and refers to the length of a substring for each connection weight in the genome string. The real-value of the connection weight can then be transformed to the binary space.
26
2. State of the Art A similar example can be found in [77] where the so-called CMA-ES, an evolution strategy (ES) which adapts the covariance matrix of the mutation distribution, has been applied to the optimization of the weights of neural networks for solving reinforcement learning problems.
with topology: Stanley [78, 79] introduced the “Neuro-Evolution of Augmenting Topologies (NEAT)” method which is able to change the topology of a neural network as well as the connection weights, such that this method can search for a solution in the neural network structure space as well as in the parameter space. NEAT uses a dynamically expandable representation of structure for encoding, so that it can record not only the structure itself but also changes in the structure. By virtue of this representation, NEAT permits the implementation of mutation and crossover evolutionary operations on the structure of the neural network. Another important concept of NEAT is the innovation protection. Rather than pushing newly born structures into the arena for competition, NEAT only allows local competition of newly born individuals with individuals of similar structure. This way, novel structures are protected and have time to optimize their structure before being confronted with strong species.
Chapter 3 Spiral Recurrent Neural Networks Similar to conventional recurrent neural networks, the novel architecture Spiral Recurrent Neural Networks (SpiralRNN ) [80] has a layered structure with a standard input layer receiving environment data, a hidden layer with self-coupling connections providing temporal memory, and an output layer projecting this temporal information into the target space. This procedure is expressed by the following equations: input → hidden : s† = Win xt−1 + b1 hidden → hidden : st = H (Whid st−1 + s† ) hidden → output : xt = G (Wout st + b2 )
(3.1) (3.2) (3.3)
where H and G are activation functions of hidden neurons and output neurons respectively, b1 and b2 are respectively the bias of hidden neurons and output neurons, xt−1 and xt are respectively the network input and output, st and st−1 are the hidden-state vector at time t and t − 1 respectively, s† is the temporal variable representing the hidden-state vector before self-feedback, Win , Whid and Wout refer to the corresponding connection-weight matrices from input to hidden layer, within the hidden layer, and from hidden to output layer. The spiral recurrent neural network (SpiralRNN ) uses a hidden layer of special structure, such that it can efficiently control the eigenvalue spectrum of the hidden-weight matrix Whid . In the following, the structure of a SpiralRNN will be introduced and followed by implementation of SpiralRNN s.
3.1
Structure and Eigenvalues
The structure of a SpiralRNN is based on “spiral units”, which also contribute to the evolutionary operation described in chapter-5. Therefore the structure of “spiral units”
28
3. Spiral Recurrent Neural Networks
will be introduced first, followed by the structure of a SpiralRNN as an entire architecture and then theoretical explanation on the relationship between the eigenvalue spectrum and network parameter is made. Formulas in the coming text will use the notations listed in table-3.1. Symbol d nwei nunits Nhn nhnu {nhnu }k st (k) st
Descriptions the dimension of data the total number of parameters (connection weights) in network the total number of hidden units the total number of hidden neurons in network the number of hidden neurons in (the current) hidden unit the number of hidden neurons in the k th hidden unit the hidden-state vector at time t the hidden-state vector of the k-th hidden unit at time t Table 3.1: Terminology of symbols
3.1.1
Hidden Units
The SpiralRNN structure can be broken down into smaller units, namely “hidden units” or “spiral units”. Each hidden unit possesses a group of hidden nodes and synaptic connections between them, as well as connections between the input/output nodes and the enclosed hidden nodes. Fig-3.1(a) illustrates a typical hidden unit with three input nodes and three output nodes, where the hidden layer structure is only shown symbolically. Note that hidden nodes are fully connected to all input nodes and all output nodes. More details of the connections inside the hidden layer are shown in fig-3.1(b), where the connections from only one particular neuron to all other neurons in the hidden unit are displayed. With all neurons in the hidden unit aligned clockwise on a circle, values of connection weights are defined such that the connection from one node to its first clockwise neighbor has value β1 , the connection to its second clockwise neighbor has value β2 and so on. The definition of connection values is applied to all the neurons, so that all connections from neurons to their respective first clockwise neighbors have an identical weight β1 , and all the connections from neurons to their second clockwise neighbors have value β2 , and so on. More detail is provided in fig-3.1(c), which depicts recurrent connections from two hidden neurons. Different combinations of arrow shapes and line styles in fig-3.1(c) represent different associated values of connection weights.
3.1 Structure and Eigenvalues
29
Output Layer β7 β6
β1
β5
β2
Hidden Layer β4
β3
Input Layer
(b)
(a)
(c)
Figure 3.1:
(a) The structure of a hidden unit with 3 input nodes and 3 output nodes; (b) Partial structure of a hidden unit, where only the outgoing connections from one neuron are shown; connections from other neurons will have the same structure of connections and weights. (c) Partial structure of a hidden layer which shows the outgoing connections of two hidden neurons; connections associated with identical values are denoted by the same combination of arrow shape and line style.
βnhnu −1 .. 0 β1 . . . . βnhnu −1 . . . . M = . β β 0 . nhnu −2 nhnu −1 .. .. .. .. . . . β1 . β1 . . . . . . βnhnu −1 0 n 0
β1
β2
...
×nhnu hnu
0 1 0 .. . . . . . . . P = .. 0 . 1 1 0 ... 0
nhnu ×nhnu
(3.4)
This configuration of connection weights results in a hidden-weight matrix - matrix M on the left-hand-side of relation (3.4). The value of matrix M is determined by a vector β~ ∈ R(nhnu −1)×1 where nhnu refers to the number of hidden neurons in the hidden unit. Furthermore, matrix M can be decomposed into entries of β~ and the permutation matrix P: n −1 M = β1 P + β2 P 2 + . . . + βnhnu −1 P hnu (3.5) where matrix P ∈ Rnhnu ×nhnu shown on the right hand side of relation (3.4) is the permutation matrix which up-shifts 3 by one position of entries in a multiplier vector. It is obvious that P’s variant P 2 is also a permutation matrix up-shifting a multiplier vector by two positions. Similarly, P nhnu up-shifts the multiplier vector by nhnu positions, and 3
The “up-shift” operation shifts vector entries from the bottom up to the top; For those entries originally at the top, they will be shifted to the bottom circle-wise.
30
3. Spiral Recurrent Neural Networks
therefore:
n
P = P hnu ˆ k [81] of any permutation matrix P i (i ∈ N+ ) This also implies that the eigenvalue λ satisfies: ˆ k | = 1, k = 1, . . . , n |λ hnu Therefore, the maximum absolute eigenvalue of matrix M is bounded, such that the relation in (3.6) holds. The proof of the relation in (3.6) will be given in appendix-A.2. nhnu −1
X
|λnhnu | ≤
i=1
|βi|
(3.6)
When the vector β~ is defined as the product between a predefined value γ ∈ R+ (Discussion ~ i.e.: of γ value will be given in section-4.6.2.) and a variable vector ξ, � � β~ = γ tanh ξ~ , (3.7) matrix M can be rewritten as in the following equation: nhnu −1
M=
X
γ tanh(ξi )P i ,
i=1
and the relation (3.6) can be further developed into relation (3.8). nhnu −1
|λnhnu | ≤ γ
X i=1
|tanh(ξi )|
≤ γ(nhnu − 1)
3.1.2
(3.8)
SpiralRNN s
The construction of SpiralRNN s is generally based on spiral hidden units. It simply concatenates several hidden units together, and fully connects all hidden neurons to all input and output neurons. Note that hidden units are separated from each other, i.e. there is no interconnections between any hidden neuron from one hidden unit and any hidden neuron of another hidden unit (see fig-3.2(a)). Assuming the number of hidden units of the entire network is nunits , the hidden-weight matrix Whid of the entire network has the form shown in fig-3.2(b). The matrix Whid is a block-diagonal matrix with nunits number of blocks, each of which is a square matrix and corresponds to the hidden-weight matrix of one of the hidden units. Note that the sizes of different sub-blocks Mi can differ, one cause for the implementation of the evolution framework as presented in section-5.2.
3.1 Structure and Eigenvalues
31
Output Layer
Whid =
M2
... Mnunits
Hidden Layer Input Layer
(a)
M1
(b)
Figure 3.2: (a) The typical structure of SpiralRNNs. Note that all hidden units have the same type of topology (however the number of hidden nodes in the hidden units can be different), as shown in fig-3.1, and are separated from each other whereas the input and output connections are fully connected to the hidden nodes. (b) The corresponding hidden-weight matrix Whid , which is a block-diagonal matrix.
Setting up such a block-diagonal structure helps to establish a constraint upon the eigenvalue spectrum of the hidden-weight matrix Whid as shown in eq-(3.9). The proof will be given in appendix-A.3. n o (3.9) |λ| ≤ max ||β~ (k) ||taxi , k ∈ [1, · · · , nunits ] k
3.1.3
Eigenvalues in SpiralRNN s
Besides the boundary condition, parameter vector β~ of the synaptic connection inside the hidden-layer is in fact directly connected to the eigenvalues of hidden-weight matrix. According to [82, 83], each sub-block of hidden-weight matrix (ref. fig-3.2(b)) is a circulant matrix. Eigenvalue λm of circulant matrices is related to entries of the first column β~ of matrix, as in eq-(3.10). λm =
n X
βk e−2πm(k−1)i/n
m = 1...n
(3.10)
k=1
Here, i is the imaginary unit indicating the complex value and n indicates the matrix size. ~ whose It is obvious that, λm is the discrete Fourier transform (DFT) of the sequence β, values are subjected to be learnt during the training of neural network. Therefore, eq-(3.10) can be re-written into a linear transformation between eigenvalues ~λ and the connection ~ weights β: √ ~λ = nMDF T β~ (3.11)
32
3. Spiral Recurrent Neural Networks
In eq-(3.11), matrix MDF T is the DFT matrix with the form:
MDF T
1 =√ n
1 1 1 .. .
1 w w2 .. .
1 w2 w4 .. .
··· ··· ···
1 w n−1 w 2(n−1) .. .
1 w n−1 w 2(n−1) · · · w (n−1)(n−1)
(3.12)
n×n
where w = e−2πi/n is a primitive n-th root of unity. Note that the DFT matrix MDF T is a constant matrix when value of n is fixed. Therefore, during the training of SpiralRNN model where value of β~ is modified, the eigenvalues ~λ of the hidden-weight matrix is adapted according to the linear mapping in eq-(3.11). As such linear mapping is relatively simpler and easier to learn, the training of SpiralRNN s can control the eigenvalue-spectrum of hidden-weight matrix in a much more straightforward and efficient manner.
3.2
Implementation of SpiralRNN s
Being trained on-line as required by requirement < R1 > on page-3, the SpiralRNN model can be implemented in three modes within one time step (the time interval between the availability of two successive data). They include: the forward phase, the training phase and the autonomous test phase. An implementation in pseudo code is given in table-3.2. The forward phase involves propagation of information from the input layer through the hidden layer to the output layer; The historical information stored in the hidden state melds together with the current environment information, and produces the new hidden-state information, which is further rendered into the network output. The training phase involves training of network parameters according to the error function; gradient-based methods are fitting by on-line learning without the requirement of large memory; after the adjustment in each time step, the system will continue the forward phase as soon as the input and target data for the next time step are available; The autonomous test phase of a neural network model is the procedure where the model continuously evolves by following the forward phase, where the network input of the current time step is the output of the previous time step. Note that, throughout this procedure, the model does not interface with data from outside except for the initial input value.
3.2 Implementation of SpiralRNN s
33
for each time step t obtain the latest data xˆt ; set the previous data xˆt−1 as input of network; iterate the network and generate output xt ;
�
Forward phase
calculate error: δt = xˆt − xt ; update the connection weights according to the error
�
Training phase
�
Testing phase
if is required set data xˆt as input continuously iterate the network end end
Table 3.2: Pseudo code: implementation of SpiralRNNs
3.2.1
The Forward Phase
For convenience, rewrite the forward equations of SpiralRNN s in eq-(3.1) to eq-(3.3): input → hidden : s† = Win xt−1 + b1 hidden → hidden : st = H (Whid st−1 + s† ) hidden → output : xt = G (Wout st + b2 )
(3.13) (3.14) (3.15)
Given the special structure of the hidden-weight matrix Whid in a SpiralRNN model described in section-3.1, Whid can be converted into a block-diagonal matrix where each block has the form {nhnu }k −1 X (k) i Mk = βi P(k) , (3.16) i=1
where {nhnu }k represents the number of hidden nodes in the k th hidden unit, index k ∈ [1, · · · , nunits ], index i ∈ [1, · · · , {nhnu }k − 1], vector β~ (k) and matrix P(k) are respectively the associated vector and the (1-position) permutation matrix of sub-block matrix Mk in Whid . According to the size of sub-block in Whid , vector st can be divided into vectors of (k) (k) smaller size st ∈ R{nhnu }k ×1 , each st is to the hidden-state vector of the corresponding hidden unit, i.e.: .. . . . . (k) P {n } −1 (k) i hnu k , k ∈ [1, · · · , nunits ], Whid = , st = βi P(k) i=1 st . .. .. . Nhn ×Nhn
Nhn ×1
34
3. Spiral Recurrent Neural Networks
where Nhn is the total number of hidden nodes. Then, eq-(3.14) can be re-written as: .. . P{n } −1 (k) (k) i hnu k st = H i=1 + s† βi P(k) st−1 , k ∈ [1, · · · , nunits ] .. . Nhn ×1
where the definition of s† can be found in eq-(3.18). Furthermore, given the definition β~ (k) = γ tanh(ξ~(k) ), the equation above will be re-written as: .. .� � P {nhnu }k −1 (k) (k) † i st = H γ i=1 tanh ξi P(k) st−1 + s , .. . N ×1 hn
k ∈ [1, · · · , nunits ]
(3.17)
Therefore eq-(3.13) to eq-(3.15) can be written element-wised, as in eq-(3.18) to eq-(3.20). Note that eq-(3.19) calculates the hidden-state vector of each hidden unit where vector s†(k) stands for the corresponding sub-vector of s† . †
s (i) =
d X
Win (i, j)xt−1 (j) + b1 (i),
j=1
{nhnu }k −1
(k) st (i) = H γ
X
i ∈ [1, · · · , Nhn ]
{nhnu }k
� X (k)
tanh ξq
q=1
m=1
(k)
(3.18)
q P(k) (i, m)st−1 (m) + s†(k) (i) ,
with k ∈ [1, · · · , nunits ] , i ∈ [1, · · · , {nhnu }k ] ! Nhn X xt (i) = G Wout (i, j)st (j) + b2 (i) , i ∈ [1, · · · , d]
(3.19) (3.20)
j=1
3.2.2
The Training Phase
With the network output readily generated in the forward phase, the training of a SpiralRNN model starts by comparing the output with the target value, i.e. determining the error. The error (residual) is put into relation to the change in the network parameters, similar to the gradient-based learning methods. The training follows the extended Kalman filter (EKF) with the gradient calculation based on real time recurrent learning (RTRL). The following will explain the calculation of network output gradient w.r.t. all network parameters, then the EKF based algorithm is addressed. A sketch of the training phase is given in fig-3.3.
3.2 Implementation of SpiralRNN s
35 Output xt
Data
Target x ˆt Output Layer
Z−1
Gradient Calculation Hidden Layer
EKF
Input Layer
Input x ˆt−1
Figure 3.3: Training of a SpiralRNN, with the dashed line representing the learning of network parameters.
1. Gradient In order to implement the real time recurrent learning (RTRL) method (refer to section-2.2.4), both the output gradient w.r.t. parameters ∂x/∂w and the hiddenstate gradient w.r.t. parameters ∂s/∂w are calculated. The ∂s/∂w will also be saved and recalled in each training step because of the self-coupling in the hidden layer. As the teacher forcing technique (refer to section-2.2.4) is used, the gradient calculation is truncated in the sense that the output gradient of the previous time step is not saved. Therefore, at time step t, ∂xt−1 /∂w = 0, where xt−1 is the input in eq-(3.13). In the following, the calculations of ∂x/∂w and ∂s/∂w are given in the order of the neural network structure, namely the output layer, the hidden layer and the input layer. Afterward, gradient values ∂x/∂w and ∂s/∂w are separately concatenated, and will be further used in the parameter-training algorithm. Output layer: Eq-(3.20) yields the network output gradient w.r.t. the connection weights from the hidden layer to output layer as well as the bias of output nodes. The relevant equations are eq-(3.21) and eq-(3.22), with i, k ∈ [1, · · · , d] where d is the dimension of the data, j ∈ [1, · · · , Nhn ] where Nhn is the total number of hidden neurons, Gk′ is the derivative of the k−th activation output w.r.t. its corresponding “netin”4 , δ is the Kronecker’s delta function. The respective gradient matrix ∂s/∂w is zero since the hidden-state vector is independent from the weights in the output layer.
4
The value of “netin” is the neuron value before the activation function is performed, as described in section-2.1
36
3. Spiral Recurrent Neural Networks
∂xt (k) = Gk′ st(j) δi,k ∂Wout (i, j) ∂xt (k) = Gk′ δi,k ∂b2 (i)
(3.21) (3.22)
Hidden layer: The recurrent connection weights between any two hidden neurons constitute the variables in the hidden layer5 . These recurrent connections are determined by the associated vectors β~ (k) , k ∈ [1, · · · , Nhn ], where the value of β~ (k) is determined by the vector variable ξ~(k) and the predefined γ ∈ R+ . In the following, the network output gradient w.r.t. vector ξ~ will be given. Given the forward equation in eq-(3.17), the derivative of the ith component of (k) vector st in the k-th hidden unit w.r.t. the j th component of corresponding vector ξ~(k) is calculated in eq-(3.23), using not only the direct derivative of vector ξ~(k) , but also the corresponding partial derivative from the hidden state vector at the previous time step. {nhnu }k (k) X ∂β (k) (j) ∂st (i) (k) j (k)′ = H (i) + P (i, m)s (m) t−1 (k) (k) (j) ∂ξ (k) (j) ∂ξ m=1 {nhnu }k −1 {nhnu }k (k) X X � ∂s (m) j (3.23) γ tanh ξq(k) P(k) (i, m) t−1 ∂ξ (k) (j) q=1 m=1 with
�� ∂β (k) (j) = γ 1 − tanh2 ξ (k) (j) (k) ∂ξ (j)
(3.24)
(k)
j where H (k) (i) is the gradient of st (i) w.r.t. its corresponding “netin”, P(k) (i, m) j is the respective element of the permutation matrix P(k) corresponding to the k -th hidden unit, j is the exponential operator, i and m are the indices in the (k) (k) matrix, and ∂st−1 (i)/∂ξ (k) (j) is the corresponding hidden-state gradient of st−1 w.r.t. the j-th entry of vector ξ~(k) . ′
Note that the hidden-state gradient from one hidden unit w.r.t. the ξ value of another hidden unit is always zeros, because hidden units are isolated from each other, i.e.: (k1)
∂st (i) = 0, ∂ξ (k2) (j) 5
k1 6= k2,
∀i, j.
The bias of the hidden neurons are like connection weights for an additional constant input in the input layer.
3.2 Implementation of SpiralRNN s
37
Using the hidden-state gradient, the network output gradient w.r.t. corresponding parameters can be computed as followed: {nhnu }k (k) X ∂st (m) ∂xt (i) (k) ′ = G (i) , Wout (i, m) (k) ∂ξ (k) (j) ∂ξ (j) m=1
i ∈ [1, · · · , d] k ∈ [1, · · · , nunits ] j ∈ [1, · · · , {nhnu }k ]
Input layer: Variables in the input layer are the connection weights from the input to hidden layer, and the bias of hidden neurons. Similar to eq-(3.23), the derivative of the hidden-neuron activation values w.r.t. parameters consists of the direct gradient and the partial derivative: (k)
∂st (i)
′
(k) ∂Win (m, n)
= H (k) (i) xt−1 (n)δi,n + {nhnu }k −1
X
γ
{nhnu }k � X (k)
tanh ξq
q=1
(k)
∂st (i) (k) ∂b1 (j)
l=1
(k)
q P(k) (i, l)
∂st−1 (l) (k)
∂Win (m, n)
!
(3.25)
′
= H (k) (i) 1 + {nhnu }k −1
γ
X
{nhnu }k � X (k)
tanh ξq
q=1
l=1
(k)
q P(k) (i, l)
∂st−1 (l) (k)
∂b1 (j)
!
(3.26)
Furthermore, the derivative of the network output w.r.t. respective variables is computed as following: ∂xt (i) (k)
∂Win (m, n) ∂xt (i) (k)
∂b1 (j)
{nhnu }k ′
= G (i)
X
(k)
(k) Wout (i, l)
l=1
{nhnu }k ′
= G (i)
X
∂st (l) (k)
∂Win (m, n) (k)
(k)
Wout (i, l)
l=1
∂st (l) (k)
∂b1 (j)
2. Training method - extended Kalman filter (EKF ) The training method will be addressed in the following text. First there will be a review of the general scenario of sensor prediction and a definition of the probability distribution function over the variables in the system. The solution for parameter estimation of the learning model is derived based on the probability distribution ˆ t , i.e. fwt |Xˆ t , which is the extended functions of parameters w given the training data x Kalman filters (EKF ) given certain approximations and specifications. In order to predict data, each sensor node has to maintain and update a model of the environment allowing the model to predict future observations. A typical starting
38
3. Spiral Recurrent Neural Networks point for a model of a generic dynamic system is: ˆ t−1 ) st = H (st−1 , wt , x ˆ t = G (st , wt , x ˆ t−1 ) + νt x wt = wt−1 + µt
(3.27) (3.28) (3.29)
Eq-(3.27) describes the dynamic evolution of the environment hidden-state vector, i.e. the new hidden state vector st at time t. The value of st depends in some, usually nonlinear, way on the previous hidden state vector st−1 and the previous observation ˆ t−1 and the model parameters wt . Eq-(3.28) describes the measurement vector x ˆ t is the vector of observations (sensor data) at time t, G (. . . ) is process of sensor: x ˆ t−1 . The variable νt is the model estimation of these observations based on st , wt and x the measurement noise vector, assumed to be normally distributed with a probability distribution function (p.d.f.) fνt = N (νt |0, Rt ). Finally, eq-(3.29) describes the evolution of the model parameters: that the dynamics of the environment within a reasonable time window are assumed to be stationary, i.e. the model parameters are static, up to additive random fluctuations µt ; these are assumed to be normally distributed with zero mean, covariance matrix Qt and thus with a corresponding p.d.f. fµt = N (µt |0, Qt ).
Using the Bayes rule, the chain rule and the Chapman-Kolmogorov equation [56], the conditional p.d.f. fwt |Xˆ t for the model parameters at time t given the current ˆ t = {ˆ ˆ t−1 , ..., x ˆ 0 } is given by following equations: and all previous observations X xt , x fwt |Xˆ t fxˆ t |wt ,Xˆ t−1 fwt |Xˆ t−1
fxˆ t |wt ,Xˆ t−1 fwt |Xˆ t−1 = fwt |xˆ t ,Xˆ t−1 = fxˆ t |Xˆ t−1 Z = fxˆ t |st wt ,Xˆ t−1 fst |wt ,Xˆ t−1 dst Z = fwt |wt−1 ,Xˆ t−1 fwt−1 |Xˆ t−1 dwt−1
(3.30) (3.31) (3.32)
Eq-(3.30) is the famous Bayes rule, eq-(3.31) introduces the hidden-state vector st into the “evidence” p.d.f. and eq-(3.32) is the “prior” p.d.f. for the model parameters wt . The last equation introduces the conditional p.d.f. fwt−1 |Xˆ t−1 which allows to interpret eq-(3.30) to eq-(3.32) as iterative update equations for fwt |Xˆ t .
Before the on-line training rules from these update equations are derived, one has to introduce some assumptions and approximations, and they present in the specification of each p.d.f.:
¯ t−1 , Pt−1 ) is assumed to be normally distributed with (Sa ) fwt−1 |Xˆ t−1 ≈ N (wt−1 |w ¯ t−1 and covariance matrix Pt−1 . In general this p.d.f. will be multimean w modal; however, if the environment doesn’t change its dynamics too fast and if the model is powerful enough, then the model parameters should become static and this assumption is justified.
3.2 Implementation of SpiralRNN s
39
(Sb ) fwt |wt−1 ,Xˆ t−1 = N (wt |wt−1 , Qt ) according to the assumption made in eq-(3.29).
ˆ t−2 ), wt , x ˆ t−1 )) with the dots indicating an (Sc ) fst |wt ,Xˆ t−1 = δ(st − H (H (. . . , wt , x iteration of the function H ( ) which further represents the previous hidden states st−τ (τ = 1, 2, . . . ) according to eq-(3.27). The Dirac delta-function δ( ) corresponds to a normal distribution with infinitesimally small covariance matrix and reflects the assumption that any uncertainty comes from the measurements and from (random) changes of model parameters.
ˆ t−1 ) (Sd ) fxˆ t |st wt ,Xˆ t−1 in eq-(3.31) is normal distributed with mean value G (st , wt , x and covariance matrix Rt according to eq-(3.28), i.e. ˆ t−1 ), Rt ). fxˆ t |st wt ,Xˆ t−1 = N (ˆ xt |G (st , wt , x
With the specifications (Sa ) and (Sb ), eq-(3.32) is a convolution of normal distributions and thus fwt |Xˆ t−1 can be easily calculated: fwt |Xˆ t−1
� � † ¯ t−1 , Pt = N wt w
with Pt† = Pt−1 + Qt
(3.33)
Given the δ-function like p.d.f. fst |wt ,Xˆ t−1 in specification (Sc ) and the p.d.f. of fxˆ t |st wt ,Xˆ t−1 in specification (Sd ), one finds: ˆ t−1 ) , Rt ) = N (ˆ xt |G (st , wt , x
(3.34)
ˆ t−2 ) , wt , x ˆ t−1 ) st = H (H (..., wt , x
(3.35)
fxˆ t |wt ,Xˆ t−1
The same assumption as made in specification (Sa ) for fwt−1 |Xˆ t−1 - namely the slow change of the model parameters wt when the model has been well trained - justifies another approximation: the function G (...) can be linearized with respect to their dependence on the model parameters wt . In particular, ˆ t−1 ) ≈ xt + Ψ(wt − w ¯ t−1 ), G (st , wt , x
(3.36)
where the output vector xt and the gradient matrix Ψ are respectively defined as: � � dxt † ¯ t−1 , x ˆ t−1 (3.37) xt = G st , w and Ψ = ¯ t−1 dw Finally, the definition of s†t is given here. According to eq-(3.35) and eq-(3.36), s†t should be the hidden state vector calculated with the previous model parameters ¯ t−1 . However, this requires a recalculation of the whole history whenever the model w parameters change and therefore is not a viable solution for on-line learning in distributive sensor application. Instead, the approximation in eq-(3.38) is applied, which implies that the model takes s†t as the flawless hidden value. ¯ t−2 , x ˆ t−2 ) , w ¯ t−1 , x ˆ t−1 ) s†t ≈ H (H (..., w
(3.38)
40
3. Spiral Recurrent Neural Networks With the approximations in eq-(3.36), eq-(3.37) and eq-(3.38), the calculation of fxˆ t |wt ,Xˆ t−1 in eq-(3.34) is rewritten as: fxˆ t |wt ,Xˆ t−1 = N
�
� � � † ¯ t−1 , x ˆ t−1 + Ψ(wt − w ¯ t−1 ), Rt . ˆ t G st , w x
(3.39)
Combining eq-(3.33) and eq-(3.39), the p.d.f. fwt |Xˆ t in eq-(3.30) ends up with a normal distribution in eq-(3.40). Note that Pt† is computed in eq-(3.33) and Ψ is the gradient described on page-35. fwt |Xˆ t
¯ t , Pt ) = N (wt |w
¯t = w ¯ t−1 + Pt ΨT Rt−1 (ˆ with w xt − xt ) � �−1 Pt = Pt† − Pt† ΨT ΨPt† ΨT + Rt ΨPt†
(3.40) (3.41) (3.42)
Eq-(3.40) is consistent with specification (Sa ) whilst eq-(3.41) and eq-(3.42) constitute the extended Kalman filter (EKF) (for more details see [55, 56, 57]). The derivation of the on-line learning rule using a Bayesian approach implies that this rule is optimal, provided that the above specifications and approximations are justified optimal in the sense that the learning rule yields the most likely model parameters at time t given a history of observations made so far. The choice and update of the parameter matrices Qt and Rt , which are respectively the covariance matrices of noise nut and mut , will be described in simulation setting in section4.1.3. Calculation of gradient Ψ in eq-(3.37) can be generally expressed in eq-(3.43) (for more details on gradient calculation, please refer to previous text on page-35). Note that eq-(3.43) is calculated in an iterative manner with the approximation in eq-(3.38). dxt ∂xt ds†t ∂xt = † + ¯ t−1 ¯ t−1 ∂ w ¯ t−1 dw ∂¯st dw � � � � ¯ t−1 , x ˆ t−1 ¯ t−1 , x ˆ t−1 ds† ∂G s†t , w ∂G s†t , w t + = † ¯ ¯ t−1 d w ∂w ∂st t−1
Ψ =
with
† † ds†t ∂s†t ∂s† dst−1 ∂s†t ∂s† dst−1 = + †t ≃ + †t ¯ t−1 ¯ t−1 ∂st−1 dw ¯ t−1 ¯ t−1 ∂st−1 dw ¯ t−2 dw ∂w ∂w
(3.43) (3.44)
The latter expression in eq-(3.44) is the gradient calculated in real time recurrent learning (RTRL) [66] with teacher forcing. Potential problems may occur, if some eigenvalues of the Jacobian matrix
∂s†t ∂s†t−1
are too large; this may lead to an unlimited amplification of
gradient components. From above, an RTRL-gradient based EKF learning rule has been derived, based on a Bayesian approach and with reasonable approximations. The resulting maximum likelihood
3.2 Implementation of SpiralRNN s
41
estimation of the model parameters guarantees the convergence of the learning process at least for an environment whose dynamics do not change. Different from the adaptive learning rule in [84], also aiming at a fix-point dynamics for the model parameters, this learning rule is derived from a probabilistic approach. In the next chapter, this learning rule together with gradient calculated by teacher forcing based RTRL is taken as the generic on-line learning rule for all neural network models.
3.2.3
The Autonomous Test Phase
The autonomous test refers to the test procedure, where the system operates monologically and generates the autonomous output. Autonomous output refers to a network output sequence generated within one autonomous test. Assuming that a model f has been trained on-line with the training data {ˆ x1 , . . . , xˆt }, the autonomous test of length τ is initialized by giving xˆt as the model input and iterates the trained model τ times, where in each time step the network input takes the output value at previous step time, as shown in eq-(3.45). The output xt+k is the k-step ahead prediction output based on initial value xˆt . The autonomous output is then constructed by concatenating all prediction outputs of the autonomous test: {xt+1 , . . . , xt+τ }, where its corresponding target is ˆ{xt+1 , . . . , x ˆt+τ }.
xt+k+1 = f (xt+k ), with xt = xˆt
k = 0, . . . , τ − 1
Output xt+k
Output Layer Z−1
Hidden Layer Input Layer
Input xt+k−1 initial input xt = x ˆt
Figure 3.4: Autonomous test of SpiralRNNs, with the dashed line at the initial input indicating that no further data will serve as input data.
(3.45) (3.46)
42
3. Spiral Recurrent Neural Networks
In simulations, autonomous tests will be conducted at assigned time steps, namely test points (ref. section-4.1.4), after a training phase. Before starting the autonomous test, environment data will be supplied as feed-in values for the input layer of the SpiralRNN model. After that, the structure and connection weights will be held unchanged, meanwhile the model iterates autonomously (as described in section-3.2.1) and generates the autonomous output. The iteration of the model will be terminated when the autonomous output vector has reached to a predefined length. Fig-3.4 illustrates the autonomous test procedure of the SpiralRNN.
Chapter 4 Applications with SpiralRNN s In this chapter, the spiral recurrent neural network (SpiralRNN ) structure will be compared with state-of-art recurrent neural network (RNN) models in various simulations. These simulations include the prediction on benchmark time series, experiments with real-world data and conditional prediction simulations, as well as the experience in a data prediction competition. Before explaining the detail of each comparison, the experimental setup will be described, as all experiments share a largely common network settings. Due to scarce energy and memory of sensor nodes, training of neural networks is performed in an on-line manner, where in each time step the network parameters (i.e. connection weights) are updated after comparing the network output to the target data value, as this is required in sensor network applications where no large memory is available. Since energy consumption is a major concern in sensor network applications, the experiments are compared under the condition that the processing effort for training of other networks is roughly on the same level. For statistics reasons, each task task is performed 30 times in order to achieve accuracy and confidence on the result. R environment. The MatLab scripts impleSimulations are carried out in the MatLab menting SpiralRNN are given in appendix-B.
4.1 4.1.1
Experimental Settings Tasks
In prediction comparisons, several data sets are used, including the Lorenz time series data set, the spike time series data set and the Mackey-Glass data set. Chaotic time series are
44
4. Applications with SpiralRNN s
used here because they never return to a previous data value and thus probe the models’ ability of generalization. Spike time series contain long sequences of null-activity which requires a certain memory horizon in order to predict the spikes. All of these time series are disturbed by additive noise of normal distribution6 , i.e.: ηt ∼ N (0, 0.012). Fig-4.1 depicts some examples of these time series. 1.4
1.5
1
1.2
1
1 0.8
0.5
0 200
300
400
(a) Spike21
500
0.6
200
300
400
500
(b) Mackey-Glass
0.4 0.4
0.6
0.8
1
1.2
1.4
(c) Mackey-Glass Orbit
Figure 4.1: Examples of time series, where the X-axis is time and the Y-axis is data. (a) Example of Spike21; (b) example of Mackey-Glass; (c) example of Mackey-Glass periodical orbit, xt versus xt−τ with τ = 17.
1. One-dimensional spike time series are used for testing stability and memory horizon. In the simulations, the spike time series has the period 21, i.e. in each period one single entry has value 1 whilst all other 20 entries zero. This task and the data set is named Spike21, because of its period length. The variance of Spike21 is manually set to 1, i.e. σ 2 = 1, where the value of variance will be required for the performance evaluation. An example of the data can be seen in fig-4.1(a) 2. The Mackey-Glass chaotic time series, proposed in [85] as a model for the production of white blood cells, satisfies the differential equation in eq-(4.1) x˙ (t) =
axt−τ − bxt , 1 + xct−τ
t ≥ 30
(4.1)
where parameters take on the settings: a = 0.2, b = 0.1, c = 10, τ = 17. Data xt at the beginning will be initialized with the value of 0.5, whilst from t ≥ 30 the data value is obtained by applying eq-(4.1) with step size h = 1. Only data with t ≥ 50 are used for training and evaluation. in order to avoid the initial part. An example of one-dimensional Mackey-Glass data is given in fig-4.1(b); fig-4.1(c) demonstrates the periodical aspect of the chaotic data set. The variance of Mackey-Glass data reads: σ 2 = 0.0518. 3. As a benchmark chaotic time series, the Lorenz time series has been frequently employed for stability tests because of its sensitivity to the initial conditions. Learning 6
The normal distribution of a variable v is denoted by N (¯ v , σ 2 ), with v¯ being the mean of variable 2 and σ being the variance. The same denotation will be used in the following text.
4.1 Experimental Settings
45
the dynamics driven by the Lorenz data set can be a challenge for neural network models due to the complexity of dynamics involved, which can be described by a three-dimensional chaotic system: x˙ = 16(y − x) y˙ = (40 − z)x − y z˙ = xy − 6z
(4.2)
Euler’s method is used for the integration of the time series with step size ∆h = 0.01 and the initialization x0 = 0.1; y0 = 0.1; z0 = −0.1. The time series are scaled down by a factor of 20 such that its value is bounded within a reasonable range. An example of Lorenz data can be found in fig-4.2. The variance of the 3-dimension Lorenz time series reads: [0.5473,0.7298,0.5251].
3
1 1
2
0
0
200
1
−1
−1 300
400
(a) 1st
500
200
300
400
500
(b) 2nd
200
300
400
500
(c) 3rd
Figure 4.2:
Examples of the Lorenz chaotic time series, where the X-axis is time and the Y-axis is data of the respective dimension. (a) 1st dimension; (b) 2nd dimension; (c) 3rd dimension;
4.1.2
Networks
The computational complexity in the extended Kalman filter (EKF) depends on the number of model parameters (synaptic weights and biases) to be optimized. Since the effort spent on EKF computation dominates the computational cost of on-line training, for fairness reasons, comparisons are implemented under the condition that all network models have a similar number of parameters to be optimized. In the following, this number of parameters is called the complexity of the system, or simply complexity, and is denoted by Cs . Given the value of Cs and the dimensionality d of the time series, one can determine the size and topology of the different networks. Including bias on hidden and output neurons7 , the 7
The bias is not included in the echo state networks (ESN ), see [51]
46
4. Applications with SpiralRNN s
total number of trainable parameters in the SpiralRNN model, for example, is calculated as Cs = 2Nhn (d + 1) + d, with Nhn referring to the amount of hidden nodes and d referring to the data dimension, as indicated in table-4.1.2. Italic values in table-4.1.2 indicate the total number of trainable connection weights, and the number of hidden neurons in each network when Cs is roughly8 equal to expected values of 50, 100 and 200 respectively. d (exp.) Cs dim. of exp. complexity data of system Cs 50 1 100 100 2 200 100 3 200
actual Cs / (number of hidden nodes) Nhn SpiralRNN ESN BDRNN SRN 2Nhn (d + 1) + d
(Nhn + d)d
2Nhn (1 + d) + d
Nhn 2 + 2dNhn + Nhn + d
60/15 100/25 120/20 192/32 96/12 192/24
61/60 111/110 124/60 204/100 129/40 219/70
57/14 105/26 122/20 206/34 115/14 211/26
55/6 109/9 128/9 206/12 101/7 201/11
Table 4.1: The actual network size and number of hidden nodes for each RNN structure in different scenarios (dimension of data, network complexity). The first column states the dimensionality (from 1 to 3) of each tasks. The second column is the expected network size, ranging from 50 to 200. The rest of the columns itemizes the actual network size and the number of hidden nodes, separating by “/”. The formulas below the model names indicate how to calculate the actual total number of parameters given the values of d and Nhn .
Without explicit notification, the hyperbolic tangent “tanh” serves as the hidden activation function of each network model, and the output activation function is the identity function. By default, values of all the connection weights are initialized such that they satisfy the normal distribution N (0, 0.012). Construction of the SpiralRNN model follows the description in chapter-3, with γ = 1 for all simulations and experiments. For the ESN model, according to [50], the hidden weight matrix Whid is uniformly randomly initialized over the range [−1, 1] with 95% sparsity, and then the matrix is rescaled such that the maximum eigenvalue λmax is equal to 0.80 in order to set the spectral radius. All the other connection weights in the ESN model have uniform random initial values which vary over the range [−0.1, 0.1]; the connections include those from input to hidden layer, those from input and hidden layer to output layer, and those from output layer to hidden layer9 . Values of all connection weights are fixed, except for the connections from input 8
It is not always possible to construct a neural network whose complexity Cs exactly equals an arbitrary value. 9 Even though connections from output to hidden layer are optional and are not included in [50], here they are nevertheless included in the ESN model in order to have better performance.
4.1 Experimental Settings
47
and hidden layer to output layer. To construct the scaled orthogonal version of the� BDRNN model (for details please refer � w1 w2 , a parameter-pair {w1 , w2 } to chapter-2 on page-16), for each block matrix −w2 w1 is defined as: w1 = Υsin(Θ), w2 = Υcos(Θ) where Υ = tanh(Φ) ∈ (−1, 1) and Φ ∈ R. With such parametrization, it is satisfied that: w12 + w22 = (Υsin(Θ))2 + (Υcos(Θ))2 = Υ2 = (tanh(Φ))2 ≤ 1 Therefore, training of w1 , w2 has become the problem of training Φ, Θ. The gradient calculation has to be adjusted accordingly.
4.1.3
Training
All neural network models are trained in an on-line manner (refer to section-2.2), which means that the training and the update of network parameters occur at each time step when a new target value is given. During on-line training, for example at time step t, input10 xˆt−1 is fed into the input layer of the neural network, the network iterates thereafter with updating the hidden state and generates the output xt+1 , which is then compared to the target data xˆt . Model parameters (weights) will be modified according to the error and the training algorithm. This concludes the on-line training at time step t. The on-line training keeps running in each time step, including the time steps with autonomous tests. For more information about autonomous testing and test points, please refer to the next section on section-4.1.4. Training will stop if the absolute value of the gradient has been accumulated so high such that MatLab complains and returns warning messages. However, this has only been observed in simulations with the SRN model. Training of networks has been implemented with teacher forcing RTRL-based EKF model, except for ESN models where the recurrent weights are not trained, thus no RTRL algorithm is implemented. About the parametrization of EKF method, the covariance matrix Pt is initialized as the identity matrix Id of a size dependent on the model complexity Cs . The identity matrix implies that at the beginning there is large uncertainty in the model parameters but no a 10
Due to teacher forcing, data x ˆt−1 is used rather than the previous output xt−1 .
48
4. Applications with SpiralRNN s
priori correlation between them. The model noise covariance matrix Qt is constant and is set to a diagonal matrix whose diagonal entries are all equal to 10−8 , i.e. Qt = 10−8Id , thus allowing a small fluctuation of the model parameters in order to adapt to the switching of data dynamics. The measurement covariance matrix Rt is initialized as 10−2Id , but its ˆ t . This is done using value can be on-line adjusted according to the output error e = xt − x the moving-average technique with a coefficient α = 0.01 in eq-(4.3). The employment of fluctuation variable η is for the sake of preventing the singularity of matrix Rt . Practically, the addition of ηId is not necessary because of the variousness of e value. The value of η is set to η = 0 in the simulations. Rt = (1 − α)Rt−1 + α e · eT + ηId
4.1.4
�
(4.3)
Testing and Measurement
Autonomous testing starts when the accumulated time step t coincides with any of the predefined test points. Different comparison tasks are scheduled for different test points. For example, in the task of Spike21, test points 11 are set for the time step t = {10[3:0.5:5] }. An autonomous test takes the initial network input and applies the update equations without any other data, where at each time step the network input value takes on the value of the network output from the previous time step (refer to section-3.2.3). The number of autonomous iterations depends on the particular task, varying from 200 to 2000 time steps. During the whole autonomous test, the values of the network connections are held constant. At the end of the autonomous test, the autonomous output is the concatenation of the network outputs of all autonomous time steps. After the autonomous test, the hidden-state vector will be restored to the original value right before the beginning of the autonomous test. The measurement of prediction performance is based on the logarithmic normalized mean square error (logNMSE ). The value of logNMSE is based on the comparison between the successive autonomous output vector ~x and the respective target vector ~xˆ. Assuming the length of autonomous output is ˜ι, the data variance is given as σ 2 , it follows that: ˜ ι � � 1X 2 2 ε˜ = (4.4) log10 (xt − xˆt ) /σ ˜ι t=1 d
11
1X ε˜ ε = d
Expression [3 : 0.5 : 5] uses the MatLab colon operator “:” and it results in a vector with the first and last entries equal to 3 and 5 respectively, the difference between any two successive entries being 0.5. The list of test points in this case is [1000, 3162, 10000, 31623, 100000].
4.2 Simulations with Time Series Prediction
49
where the values of variance σ 2 of each data set can be found in section-4.1.1. In the case of multi-dimensional data, the value of ε will be the mean over the dimensions, as shown in above equation. The final result will be the mean value over the 30 runs of simulations for all tasks. The standard deviation of the logNMSE will be provided to investigate the stability of the result. In the calculation of logNMSE in eq-(4.4), the logarithm is applied before the arithmetic mean, thus yielding a result which is closer to the geometric mean value of the normalized error. By doing this, logNMSE has weighted the error in favour of short-term prediction rather than long-term prediction. This corresponds to the fact that, in general, an error in a short-term prediction is exponentially propagated to the long-term prediction, thus making the prediction worthless. Therefore it makes sense to concentrate on the short-term prediction when a general criterion for error assessment is required.
4.2
Simulations with Time Series Prediction
As mentioned in the previous section, simulations of each scenario are performed 30 times where autonomous outputs are generated at each assigned test point in each simulation. Assessment is based on the logNMSE values of these autonomous outputs. Result tables in this section are organized as follows: the first column shows a running number of the test points assigned to the task, simulation results are reported in the remaining columns, grouped in pairs for each RNN model. Inside each pair of columns, the left column lists the average of logNMSE over 30 runs and the right column lists the associated standard deviation value. In some experiments with the SRN model, simulations stopped half-way due to instability. In such cases, the resulting mean value of logNMSE will be quoted in parentheses, and they are calculated without taking those canceled simulation runs into account. The corresponding value in the “std.” column states the number of invalid runs in parentheses. In diagrams showing logNMSE results, the X-axis indicates test points and the Y-axis stands for the logNMSE evaluation value. Note that the logNMSE value itself is on a logarithmic scale. In some tasks, some RNN models have performed badly such that their mean logNMSE values differed much from the others; these values are therefore omitted for the clarity of the diagram. Vertical bars at the resulting data points in logNMSE diagrams represent standard deviations of the corresponding RNN model. For clarity’s sake, only the standard deviation of the SpiralRNN model is shown in such diagrams. The standard deviation values of the other RNN models can be found in respective tables.
50
4.2.1
4. Applications with SpiralRNN s
Spike21 Dataset
Simulations with the Spike21 data have been conducted twice, where the network complexity Cs was set to 50 in the first test and to 100 in the second. In both cases, five test points for autonomous test were placed at time steps t = {10[3:0.5:5] } and each autonomous test lasted for ˜ι = 2000 time steps, i.e. models were forced to iterate for 2000 steps without any interference from outside! A specialty of the Spike21 data set lies in its values being constant (constant “0” in this case) for most of the time, which means that the data presented to the input layer are identical at most of the time. Therefore, a standard TDNN model, with limited knowledge about the problem, could have a smaller number of history data patterns in the input layer than the period length of the time series in the equation, and thus would fails to predict the arrival of spikes because it would lack information about their period. In such a case, TDNN will try to minimize the output error by searching the cluster center of all the 1 data, which equals to 21 ≃ 0.05 in the Spike21 case. Such a situation can also occur in conventional recurrent neural networks, particularly at the beginning when they are not yet well trained. However, even in such a case with bad performance, conventional RNN models can still yield promising logNMSE evaluation results because of the closeness 1 between value “ 21 ” and “0”, and consequently get a misleading favourable assessment. In order to avoid such misleading evaluation, it is advisable to measure the error only at time steps where the corresponding targets are spikes. Assuming a set Λ includes all the time steps t where the data xˆt are spikes, such that Λ = {t|ˆ xt ≃ 1, t ∈ [1, ˜ι]} where ˜ι is the length of the autonomous test, evaluation in eq-(4.4) is modified for the Spike21 task, such that: � � 1 X 2 2 ε= (4.5) log10 (xt − xˆt ) /σ nΛ t∈Λ where nΛ is the number of entries in the set Λ.
The comparison of performance according to the modified logNMSE in eq-(4.5) is shown in fig-4.3(b) and their value as well as standard deviation are listed in table-4.2. It is shown in these plots and tables, that the ESN has failed to provide an acceptable result in terms of modified logNMSE because it can only provide a constant result rather than a spike sequence. Without consideration of those failed simulations, SRN has outperformed the other models. As this instability problem of SRN has emerged with progressing training step, one can observe in table-4.2 that the number of failing simulations increases from one test point to the next. The SpiralRNN model, on the other hand, has demonstrated its stability in performance and learning speed. Results comparing these RNN models with complexity Cs ≃ 100 can be found in fig-4.4 and in table-4.3. The SpiralRNN model has again manifested its efficiency and stability in terms of the modified logNMSE.
4.2 Simulations with Time Series Prediction
0 mod. logNMSE
norm. logNMSE
−2
51
−4
−2
−4
1
2 3 4 NO. of Test Points
5
(a) standard logNMSE
spiralRNN ESN BDRNN SRN 1
2 3 4 NO. of Test Points
5
(b) modified logNMSE
Figure 4.3:
Comparisons in terms of logNMSE with Spike21 data, where the model complexity is set to Cs ≃ 50. In both diagrams, the X-axis stands for the five test-points, and the Y-axis refers to the logNMSE values. Note that neither diagram reveals the unsuccessful simulations of the SRN model; both diagrams share the same legend. (a) Comparison in terms of standard logNMSE; (b) comparison in terms of modified logNMSE.
Test Point 1 2 3 4 5
SpiralRNN mean std. -0.067 0.073 -0.337 0.733 -1.516 1.872 -2.196 2.088 -2.821 2.142
ESN mean std. -0.011 0.062 -0.080 0.324 -0.017 0.055 -0.013 0.071 -0.024 0.049
BDRNN SRN mean std. mean std. -0.047 0.009 -0.041 0.012 -0.046 0.009 -0.050 0.022 -0.042 0.009 -1.780 2.015 -0.045 0.017 (-3.219) (1) -0.047 0.009 (-4.518) (8)
Table 4.2: Comparison in terms of the modified logNMSE and the standard deviation with the Spike21 date set, where the model complexity is Cs ≃ 50. Note that, in the experiment with the SRN model, an instability is caused by test point No. 4; the value in parentheses in column “std.” is the count of invalid simulations.
4.2.2
Mackey-Glass Dataset
The Mackey-Glass data set, generated according to eq-(4.1), is a one-dimensional chaotic time series. Parameter τ controls the time delay in the model, which makes the time series combine periodical and chaotic features. See fig-4.1(c). Test points in experiments with Mackey-Glass data are placed at time steps t = {10[4:0.25:5] }. The length of autonomous tests was set to ˜ι = 200 because the characteristics of chaotic data make the long-term prediction deviate far away from the trajectory, thus removing all meaning from any prediction with 2000 steps.
52
4. Applications with SpiralRNN s −2
mod. logNMSE
norm. logNMSE
0
−4
−2
−4
1
2 3 4 NO. of Test Points
5
(a) standard logNMSE
spiralRNN ESN BDRNN SRN 1
2 3 4 NO. of Test Points
5
(b) modified logNMSE
Figure 4.4: Comparisons in terms of logNMSE with Spike21 data, where the model complexity is set to Cs ≃ 100. The X-axis stands for the five test points, and the Y-axis refers to the logNMSE values. Note that both diagrams have ignored the unsuccessful simulations of the SRN model. (a) Comparison in terms of standard logNMSE; (b) comparison in terms of modified logNMSE.
Test Point 1 2 3 4 5
SpiralRNN mean std. -0.271 0.635 -1.023 1.639 -1.575 1.920 -2.560 2.167 -2.765 2.091
ESN mean std. -0.032 0.165 -0.056 0.172 -0.088 0.341 -0.045 0.094 -0.033 0.399
BDRNN SRN mean std. mean std. -0.044 0.015 -0.039 0.009 -0.044 0.013 -0.057 0.043 -0.050 0.031 (-3.345) (1) -0.039 0.013 (-4.010) (2) -0.060 0.060 (-4.269) (4)
Table 4.3: The comparison in terms of the modified logNMSE and standard deviation with the Spike21 date set, where all RNN models have the same model complexity value Cs ≃ 100. Note that, in the experiment with the SRN model, an instability is caused by test point No. 3; the value in parentheses in column “std.” is the count of invalid simulations.
Results of RNN models predicting Mackey-Glass are given in fig-4.5. It is shown in fig-4.5 and table-4.4 that the ESN model can only be comparable at the early stages, whereas it fails in long-term prediction because of the fixed structure of the hidden layer. An increase in complexity will help to improve the performance of a ESN in general, but it has no improving effect in long-term prediction. The SRN model is superior in this task, particularly when the network complexity Cs ≃ 50 in fig-4.5(a); however, when the complexity Cs increases to 100, it not only loses this advantage over the SpiralRNN but also produces worse result than itself at previous time steps, as shown in fig-4.5(b). This reveals in a way the instability of the SRN model itself. SpiralRNN has outperformed the other RNN models in most cases, and this advantage has
4.2 Simulations with Time Series Prediction Test Point 1 2 3 4 5
SpiralRNN mean std. -0.554 0.305 -0.799 0.439 -1.096 0.532 -1.191 0.537 -1.681 0.670
ESN mean std. -0.667 0.268 -0.666 0.351 -0.622 0.277 -0.838 0.459 -0.752 0.286
53
BDRNN mean std. -0.413 0.082 -0.429 0.116 -0.526 0.110 -0.428 0.100 -0.606 0.315
SRN mean std. -0.964 0.391 -0.941 0.415 -1.225 0.513 -1.394 0.445 -2.123 0.512
Table 4.4:
Comparison in terms of logNMSE and standard deviation on data set Mackey-Glass. All models have the model complexity value Cs ≃ 50;
0
0
−1
−1
−2
logNMSE
logNMSE
shown to increase with longer training. ESN can produce comparable autonomous output in the short term, i.e. with small ˜ι value, but it fails to catch up with the dynamics in the longer term, as it is shown in fig-4.5(b). On the other hand, SpiralRNN has retained its advantage over the ESN and other models by enlarging the network size (refer to table-4.5).
spiralRNN ESN BDRNN SRN 1
2 3 4 NO. of Test Points
5
(a) Cs ≃ 50
−2
spiralRNN ESN BDRNN SRN 1
2 3 4 NO. of Test Points
5
(b) Cs ≃ 100
Figure 4.5: Comparison of RNN models in terms of logNMSE with different complexity on Mackey-Glass data set. (a) Model complexity Cs ≃ 50; (b) model complexity Cs ≃ 100.
Test Point 1 2 3 4 5
SpiralRNN mean std. -1.062 0.651 -1.013 0.500 -1.510 0.428 -1.564 0.532 -2.016 0.579
Table 4.5:
ESN mean std. -1.076 0.433 -1.175 0.417 -0.547 0.233 -1.146 0.433 -0.908 0.343
BDRNN mean std. -0.449 0.092 -0.492 0.172 -0.578 0.167 -0.546 0.188 -0.801 0.391
SRN mean std. -0.688 0.3580 -0.805 0.3520 -0.675 0.3150 -1.005 0.6480 -1.198 0.6380
Comparison in terms of logNMSE and standard deviation on Mackey-Glass data set. All models have the model complexity value Cs ≃ 100;
54
4. Applications with SpiralRNN s
4.2.3
Lorenz Dataset
Test points in the Lorenz data set are time steps t = {10[3:0.25:5] }, where each autonomous test runs 200 time steps. Comparison results of RNN models with complexity Cs ≃ 100 are illustrated in fig-4.6 and table-4.6. Fig-4.6 contains three diagrams, each of which represents comparisons with different values of ˜ι in eq-(4.4).12 Whilst table-4.6 has only shown the result when ˜ι = 200, table-4.7 and fig-4.7 report the results of comparing RNN models with complexity Cs ≃ 200. 0
spiralRNN ESN BDRNN SRN
0 logNMSE
logNMSE
spiralRNN ESN BDRNN SRN
logNMSE
−2
−2
−4
spiralRNN ESN BDRNN SRN
−2 1
2
3 4 5 6 7 NO. of Test Points
8
9
(a) ˜ι = 5
−4
1
2
3 4 5 6 7 NO. of Test Points
8
9
(b) ˜ι = 50
1
2
3 4 5 6 7 NO. of Test Points
8
9
(c) ˜ι = 200
Figure 4.6:
Comparison in terms of logNMSE on Lorenz data set with various autonomous output lengths ˜ι. All models have the model complexity value Cs ≃ 100.
Test Point 1 2 3 4 5 6 7 8 9
SpiralRNN mean std. -0.353 0.417 -0.287 0.337 -1.202 0.458 -0.734 0.359 -0.941 0.262 -1.294 0.411 -1.822 0.518 -1.577 0.380 -1.452 0.543
ESN mean std. -0.799 0.301 -0.713 0.248 -1.009 0.376 -0.930 0.424 -0.594 0.419 -0.906 0.470 -1.063 0.448 -0.700 0.448 -0.517 0.344
BDRNN mean std. -0.373 0.388 -0.365 0.243 -1.028 0.398 -0.792 0.377 -0.790 0.344 -1.150 0.370 -1.919 0.505 -1.370 0.326 -1.518 0.615
SRN mean std. -0.199 0.467 -0.243 0.291 -0.470 0.441 -0.546 0.346 -0.388 0.528 -0.699 0.468 -1.239 0.644 -1.256 0.474 -1.287 0.568
Table 4.6:
Comparison in terms of logNMSE and standard deviation on Lorenz data set. The model complexity is Cs ≃ 100, and the autonomous test length is ˜ι = 200. 12
Changing the evaluation variable ˜ι doesn’t affect the simulation result itself. Since autonomous tests in Lorenz simulation last 200 time steps, the evaluation with ˜ι only considers the first ˜ι items of output data out of the whole autonomous output.
4.2 Simulations with Time Series Prediction
55
As shown in fig-4.6(a), all RNN models are similarly successful in short-term 5-step prediction. In particular the ESN model has already underlined its ability at test point No.1 even though the other RNN models have caught up with the ESN at test point No.3. As the value of ˜ι increases, i.e. when longer-term prediction is taken into consideration, the ESN cannot maintain the advantage it had in short-term prediction, as shown in fig-4.6(b) and fig-4.6(c). The other RNN models with trainable hidden layers have been proven to be superior, especially the SRN model and the SpiralRNN model.
logNMSE
logNMSE
−3
spiralRNN ESN BDRNN SRN
−1
−2
−3
−4
1
2
3 4 5 6 7 NO. of Test Points
8
9
(a) ˜ι = 5
−4
1
2
3 4 5 6 7 NO. of Test Points
8
logNMSE
0 spiralRNN ESN BDRNN SRN
−2
9
(b) ˜ι = 50
spiralRNN ESN BDRNN SRN 1
2
3 4 5 6 7 NO. of Test Points
8
9
(c) ˜ι = 200
Figure 4.7: Comparison in terms of logNMSE on Lorenz data set with various autonomous output lengths ˜ι. All networks have the model complexity Cs ≃ 200. Test Point 1 2 3 4 5 6 7 8 9
SpiralRNN mean std. -0.869 0.302 -0.478 0.227 -1.912 0.434 -1.653 0.520 -1.594 0.248 -1.689 0.537 -2.211 0.645 -2.306 0.376 -2.196 0.508
ESN mean std. -0.968 0.382 -0.895 0.480 -1.076 0.992 -1.079 0.572 -0.607 0.475 -1.169 0.569 -1.577 0.527 -0.890 0.413 -0.941 0.341
BDRNN mean std. -0.673 0.311 -0.426 0.235 -1.495 0.407 -0.957 0.350 -1.240 0.270 -1.603 0.455 -2.263 0.594 -1.882 0.385 -1.857 0.510
SRN mean std. -0.6310 0.329 -0.6950 0.306 -1.3050 0.337 -1.5340 0.609 -1.2950 0.277 -1.4170 0.506 -1.9520 0.635 -2.4750 0.578 -2.2650 0.455
Table 4.7:
Comparison in terms of logNMSE and standard deviation on Lorenz data set. All models have the model complexity Cs ≃ 200, and the autonomous test length reads ˜ι = 200.
4.2.4
Discussion
The novel recurrent neural network model SpiralRNN has shown its efficiency and stability in the above simulations. In most cases, it provides the best performance among the
56
4. Applications with SpiralRNN s
state-of-art architectures. An example of autonomous output of the SpiralRNN model on the chaotic MackeyGlass time series is shown in fig-4.8 where the difference between autonomous output and target data can hardly be identified till around time step 400. 1.4 1.2 1 0.8 0.6 0.4 0
200
400
600
800
1000
Figure 4.8:
The autonomous output of a trained SpiralRNN model vs. corresponding target data. The solid line is autonomous output, and the dashed line is target data.
In simulations, shortcomings of other conventional RNN models have revealed. The ESN model is simple to implement, and in much literature it has been proven to be powerful in off-line learning in many literatures. However, it doesn’t provide good results in on-line training, an important requirement in distributed sensor network applications. Furthermore, as indicated by Jaeger, the ESN model requires further parameter tunning to control the maximum absolute eigenvalue of the hidden-weight matrix, which is contrary to the requirement < R1 > for easy deployment of sensors, mentioned on page-3. The SRN model has general recurrent layer structure and theoretically the most suitable structure for dynamics modeling, but it suffers from instability as shown in the simulations with Spike21 data. The BDRNN has only shown comparable performance in some simulations with the Lorenz data set.
4.3
MouseTracking with SpiralRNN s
This section present a piece of software which applies the SpiralRNN model to a real-world prediction application. The software is called “MouseTracking” as it tries to trace the movements of a computer mouse controlled by a human user. This toy software has been coded and implemented in the MatLab environment, and its MatLab scripts can be found in appendix-C. Fig-4.9 shows the MouseTracking interface, with the upper subplot depicting the growing trajectory (in blue) as well as the autonomous prediction (in red) and the
4.3 MouseTracking with SpiralRNN s
57
lower subplot showing the whole history up to now on a logarithmic scale. MouseTracking accepts keyboard commands as listed in appendix-C. Trajectory 0 −0.2 −0.4 −0.6 −0.8 −0.8
−0.6
−0.4
−0.2
0
0.2
0.4
0.6
Logorithmic NMSE 20
10
0
−10
0
500
1000
1500
2000
2500
Figure 4.9: MouseTracking’s graphical interface.
4.3.1
The MouseTracking
When the software is running, the human user continuously move the computer mouse such that cursor on the computer monitor runs along a given closed trajectory. The movement is noisy and subject to leaps due to the sensitivity of the optical mouse to the underlying surface. The computer, acting as a sensor, traces and samples the mouse movements on the computer screen at a fixed rate. After some pre-processing, the position data are sent to the recurrent neural network (RNN) model in the computer so that the RNN model can train the network parameters and build an approximated model. Training takes place online, i.e. the parameters are adjusted as soon as new measurement data for each time step are available. Test points for this MouseTracking software are {[1 : 1 : 5] ∗ 103 }.13 When time step t coincides with a test point, meaning also that the RNN model has now been trained with t data items altogether, the autonomous test will start and generate an output sequence of coordinates. The autonomous test will generate 1000 steps, and its output is expected to coincide with the user’s trajectory. The pseudo-code for MouseTracking is given in table-4.8.
4.3.2
Training Data
As mentioned, the optical mouse is controlled by a human user so that the cursor traverses along the figure-of-8 trajectory shown in fig-4.10(a). Every 1/100 second14 , the position of 13
These test points are {1e3, 2e3, 3e3, 4e3, 5e3}. As it will be mentioned in the later text, period of trajectory employed in the simulation is roughly around 130, therefore, at test-point t = 1e3, the whole trajectory has presented only 8 times in the training data. 14 This value is manually set and is empirical.
58
4. Applications with SpiralRNN s initialize the neural network model and other configuration; set the vector of test points; for each time step t measure the coordinates of the position of the mouse; implement the training of network parameters based on the observation data if t = one of test points set the latest observed data as input of network; implement autonomous prediction and generate the autonomous output; (autonomous output is stored for evaluation purpose) end end Table 4.8: The pseudo code for the MouseTracking.
the mouse cursor is measured by the computer. Such a measurement will not be used directly as the input for the learning model. Instead, some pre-processing of data is required, because the user’s varying hand speed makes the raw measurement data less predictable. In pre-processing, the path of the computer mouse is divided into segments of identical length. The boundary points that split the mouse path into segments of identical length15 are concatenated together after their coordinates have been normalized. The boundary points subdividing the mouse path into identical stretches are taken as time-step points, as if the computer mouse were moving at a constant speed. This is shown in fig-4.11, where the hollowed arrow indicates the movement direction, the dashed line is the movement path of cursor, circles represent the data measured by computer every 1/100 second, and black dots refer to boundary points that segment the movement path of cursor. Note that the distance between circles is various, due to the human-controlled moving of mouse, and once the movement path is known the positions of measured point is dispensable. The normalization of boundary points’ coordinates is implemented such that coordinates on the computer monitor screen cover the range [−1, 1] on both axes and the center of the screen lies at the origin. The identical length mentioned above is set to “0.02” after normalization. Example values of two coordinates of the trajectory are given in fig-4.10(b), where the trajectory period can be observed, being roughly equal to 130 time steps. Dots in the figures represent some of the boundary points16 , and dashed curves illustrate the trajectories. Fig-4.10(a) exhibits a couple of leaps in the trajectory due to a malfunction of the optical mouse. 15
The path length between two boundary points is equal to the predefined identical length, even if the distance between boundary points occasionally differs from the length due to the curvature and noisiness of the trajectory. 16 For clarity’s sake, only every fifth points is shown in the diagram.
4.3 MouseTracking with SpiralRNN s
0.6 0.5 0.4 0.3 0.2
d−1 d−2
0.5
0.7 0.6 Y−coordinate
Coordinate value
Y−coordinate
0.7
59
0
−0.5
0.5 0.4 0.3 0.2
0.1
0.1 −0.6
−0.4 −0.2 X−coordinate
0
0.2
(a) “8” shape trajectory
400
600 Time step
−0.6
800
(b) coordinates of trajectory
−0.4
−0.2 X−coordinate
0
0.2
(c) prototype trajectory
Figure 4.10: Example of a trajectory and its coordinate values and prototype pattern: (a) Trajectory of “8” shape; (b) coordinate values of trajectory;. (c) prototype trajectory (It is useful in evaluation).
0.02 0.02 0.02
0.02
Boundary point
0.02
Measurement data
Figure 4.11: Segmentation by boundary points in MouseTracking. The hollowed arrow indicates the movement direction, the dashed line is the movement path of the cursor, circles represent the position measured by computer in every 1/100 second, and black dots refer to boundary points that segment the movement path of cursor. The identical length between boundary points is “0.02”. The positions of these boundary points are taken as the training data at each “time” step.
4.3.3
Competing Models
In this simulation, SpiralRNN is compared to ESN and BDRNN (SRN model is omitted because of the instability). Configuration and initial parameter setting follow the description in section-4.1. Note that the number of input or output neurons in the network equals the dimension of the data (2 in this case).
60
4.3.4
4. Applications with SpiralRNN s
Evaluation Methods
The MouseTracking performance evaluation differs from other tests. Recall that the mouse trajectory, as controlled by a human user, contains leaps as shown in fig-4.10(a). The target for comparison is a prototype trajectory extracted from the original data. The prototype trajectory is depicted in fig-4.10(c) with length of 47 and denoted as P = {p1 , p2 , . . . }, where only every third point is shown for clarity’s sake. For each prediction point x, the prediction error is defined as the square of the shortest distance from the prediction point to the prototype trajectory, as shown in eq-(4.6). The evaluation error ε for the autonomous output (of length 1000) at a particular test point is given by eq-(4.7) which takes the mean value over the prediction length. For statistics reasons, the final evaluation error will be the mean over 30 simulations. ) ( X (xi (d) − pk (d))2 (4.6) ǫi = min k
ε = ǫi ,
d
i = 1, . . . , 103
(4.7)
Note that the above evaluation method is invalidated if the predicted trajectory stays in the neighborhood of fixed points close to the prototype trajectory. In order to evaluate the result in another light, the frequency analysis results based on Fourier transformation are also given. Given the autonomous output trajectory at each test point, one can use the discrete Fourier transform (DFT) for estimating the frequency of the output time series; MatLab provides the discrete Fourier transformation through the fft command. As the length of the autonomous trajectory is 1000, the 1024-point DFT is calculated as in eq-(4.8): 1 Y = fft(X, 1024) (4.8) 1000 where X is the time series in question and Y is the output vector of the discrete Fourier transform of length 1024. For clarity’s reason, only the frequency spectrum range from 0 to 0.03 is shown below since the dominating frequencies of the original trajectory are located in this range; for example the dominant frequency of the trajectory is f ∗ ≃ 1/130 ≃ 0.0077. The final result of the frequency analysis will again be averaged over 30 simulations. To properly show the frequency analysis result in figure, the MatLab code17 is given in table4.9. For the sake of clearness, only the frequency spectrum within the range [0, 0.03] is displayed.
4.3.5
Results & Discussion
Table-4.10 reports the evaluation error of neural network models at all test points, where the model complexity of neural network is set to Cs ≃ 100. The corresponding comparison 17
The MatLab code derives from the sample code given in the function reference of command fft under MatLab environment.
4.3 MouseTracking with SpiralRNN s
61
Fs = 1; % (sample frequency) nn = 1024; fr = Fs/2*linspace(0, 1, nn/2); % (frequency axis ticks) plot(fr, 2*abs(Y(1:n/2))); Table 4.9: The MatLab code for plotting the frequency figure.
with network complexity Cs ≃ 200 is given in table-4.11. Both tables report similar results, namely that SpiralRNN has an advantage over ESN and BDRNN, in particular after longterm training of the model. XXX XX Test Point XXX XX Model XX
SpiralRNN ESN BDRNN
No.1
No.2
No.3
No.4
No.5
-1.49 -1.99 -2.42 -2.44 -2.51 0.15 -1.07 -1.84 -1.86 -1.75 -1.69 -2.01 -1.99 -2.09 -2.20
Table 4.10: Comparison of evaluation error ε at each test point. The neural network models have complexity Cs ≃ 100. (The smaller the error value is, the better the prediction result is.)
XX XXX Test Point XXX XX Model XX
SpiralRNN ESN BDRNN
No.1
No.2
No.3
No.4
No.5
-1.19 -2.01 -2.51 -2.46 -2.78 -1.88 -1.28 -1.67 -2.05 -1.89 -1.49 -2.07 -2.12 -2.15 -2.20
Table 4.11: Comparison of evaluation error ε at each test point. The neural network models have complexity Cs ≃ 200. (The smaller the error value is, the better the prediction result is.)
The frequency analysis of a simulation with model complexity Cs ≃ 100 is provided in fig4.12, where the frequency analyses of X-coordinate time series are depicted as blue dash curves and the ones for Y-coordinates value are given as green solid curves. SpiralRNN produces (ref. fig-4.12(b)) autonomous output trajectories with the frequency spectrum similar to the frequency spectrum of the target data (ref. fig-4.12(a)), while the other models cannot. The frequency analysis for models with larger network size Cs ≃ 200 has confirmed the superior of the SpiralRNN model, which is given in fig-4.13. Fig-4.14 respectively depicts examples of autonomous output trajectories at test points No.3, 4, 5 using the SpiralRNN model with complexity Cs ≃ 100. These output examples were extracted from the same simulation. Note that, in fig-4.14(b) of the No.4 autonomous
62
4. Applications with SpiralRNN s frequency analysis of original trajectory 0.4
X−coordinate Y−coordinate
0.3
frequency analysis of spiralRNN
frequency analysis of ESN
frequency analysis of BDRNN
0.1
0.06
0.03
0.08
0.05
0.025
0.04
0.02
0.03
0.015
0.06
0.2 0.04
0.1
0 0
0.02
0.01
0.02
0.03
0.04
0 0
(a) Target
0.01
0.02
0.03
0.04
0.02
0.01
0.01
0.005
0 0
(b) SpiralRNN
0.01
0.02
0.03
0.04
0 0
(c) ESN
0.01
0.02
0.03
0.04
(d) BDRNN
Figure 4.12: Frequency analysis of the output trajectory at test point No.5 of competing neural network models with complexity Cs ≃ 100. Note that the vector value at frequency “zero” is trivial and is therefore omitted in diagrams, and that the period length of data is 130 therefore the dominant frequency is 1 130 ≃ 0.008. frequency analysis of original trajectory 0.4
frequency analysis of spiralRNN
frequency analysis of ESN
frequency analysis of BDRNN
0.2
0.08
0.04
0.3
0.15
0.06
0.03
0.2
0.1
0.04
0.02
0.1
0.05
0.02
0.01
0 0
X−coordinate Y−coordinate
0.01
0.02
0.03
(a) Target
0.04
0 0
0.01
0.02
0.03
(b) SpiralRNN
0.04
0 0
0.01
0.02
(c) ESN
0.03
0.04
0 0
0.01
0.02
0.03
0.04
(d) BDRNN
Figure 4.13: Frequency analysis of the output trajectory at test point No.5 of competing neural network models with complexity Cs ≃ 200. Note that the vector value at frequency “zero” is trivial and is therefore omitted in diagrams, and that the period length of data is 130 therefore the dominant frequency is 1 130 ≃ 0.008.
test, the first loop of the autonomous output coincides with that of the target, even though it deviates later to a slightly deformed limit-cycle. Fig-4.14(c) of the No.5 autonomous test depicts a rather close prediction of the trajectory. Similar performance and result have been observed for the MouseTracking software with other shapes of trajectory, e.g. triangle and square. SpiralRNN has demonstrated to be efficient and stable in learning data from the physical world.
4.4 Conditional Prediction with SpiralRNN s 0.8
Target auto. output
Target auto. output
0.7
0.2
0.6 Y−coordinate
Y−coordinate
0.4
0.5 0.4 0.3 0.2
−0.6
−0.4 −0.2 X−coordinate
(a) No.3
0
0.2
0.5 0.4 0.3 0.2
0.1 0
Target auto. output
0.7
0.6
0.6 Y−coordinate
63
0.1 −0.6
−0.4 −0.2 X−coordinate
0
(b) No.4
−0.6
−0.4 −0.2 X−coordinate
0
(c) No.5
Figure 4.14:
Typical examples of autonomous output trajectories produced by the SpiralRNN model with complexity Cs ≃ 100. The red solid curves are the autonomous trajectories predicted by the SpiralRNN and the blue dashed curves refer to the original trajectories during the previous 1000 time steps before the respective test point. (a) Autonomous output at the No.3 test point; (b) autonomous output at the No.4 test point; (c) autonomous output at the No.5 test point.
4.4
Conditional Prediction with SpiralRNN s
There are many applications where a system evolves differently depending on one or more external triggering “context” signals. A typical example in discrete manufacturing is a robot manipulating bottles transported by automated guided vehicles (AGV). Depending on sensor signals indicating (i) the presence of a bottle, (ii) whether the bottle is already filled or empty and (iii) which liquid to fill in, the robot starts different sequences of actions like filling liquid from different sources or ignoring already filled bottles. Installation and reconfiguration of automation system will be greatly simplified by those controllers which can be easily trained to perform these sequences of actions depending on sensor information. In the context of this section, the term “conditional prediction” refers to those applications where the learning model is trying to approximate the dynamics model with the assistance of an external triggering signal. The information provided by such additional signals can improve the efficiency and accuracy of the control, which is useful in at least three categories: 1. Comparison of a predicted trajectory with an actual trajectory for diagnostic purposes; 2. On-line training of a specific sequence of actions for control purposes; 3. Substitution of missing trajectory data by predicted ones. SpiralRNN contributes to conditional prediction problem by providing an efficient and stable learning model. A warehouse application scenario will be outlined below and the
64
4. Applications with SpiralRNN s
implementation of the SpiralRNN model in conditional prediction [86] will be described. Simulation and result as well as analysis are given afterwards.
4.4.1
Scenario
Consider an AGV system in a warehouse on 11 × 11 grid with various commodities in it, as shown in fig-4.15. Inside, each type of commodity has its own unique cabin, associating a unique path18 which connects the entrance to this particular cabin. A trailer or trolley runs through the grid, and ships a product to its assigned cabin whenever the product arrives at the entrance. Differences between products can be digitalized as each production type is associated with a unique value, and this additional information is available as soon as the product shows up at the entrance. 10 9
y(×0.1)
Postern
8 7
A
6 5 4 3 2 1
F
0
1
0000000 1111111 0000000 D1111111 E 0000000 1111111 0000000 1111111 0000000 1111111 C 0000000 1111111 0000000 1111111 00000000 11111111 00000000 11111111 0000000000 1111111111 B 00000000 11111111 0000000000 1111111111 00000000 11111111 0000000000 1111111111 00000000 11111111 0000000000 1111111111 00000000 11111111 0000000000 00000000 1111111111 11111111 0000000000 1111111111 0000000000 1111111111 0000000000 1111111111 0000000000 1111111111
Entrance 2 3 4 5 6 7 8 9 Schematic Diagram of warehause
x(×0.1) 10
Figure 4.15: The schematic diagram of a warehouse in 11 × 11 grid. Product
cabins are denoted by capital letters with circle, obstacles are shaded areas. For example, the cabin for product A is located at (0.1, 0.7), product B at (0.9, 0.5), product E at (0.8, 0.8). Products can enter the warehouse via the entrance (0.4, 0) or the postern (0, 0.8). Trajectories of products coming into the warehouse via the entrance are shown in solid lines, and trajectories via postern are shown in dashed lines.
Imagine each trolley has an “intelligent sensor” attached. When the trolley is assigned a job to convey product A to its respective cabin, the sensor is given the associated corresponding additional information. This additional information identifies the production type, and can be digitalized as φA . During transport, the sensor measures the correspondn o (A) (A) (A) ing trajectory ~p = p1 , . . . , pn of product A. The trajectory data will be used to (A)
(A)
train the embedded model of the sensor node, such that it satisfies pt+1 = f ∗ (pt , φA ), (A) with f ∗ symbolizing the model to be trained and pt referring to the corresponding entry 18
As shown in fig-4.15, these are bifurcations in these unique paths.
4.4 Conditional Prediction with SpiralRNN s
65
of trajectory p~(A) at time step t. Training stops when the product has been transported to the assigned cabin, which is indicated by sending a terminating signal to the sensor. Assigned a new job (for example, to convey a product D to its cabin), n the trolley ois given a (D) (D) new trigger value φD , and has to go through another path ~p(D) = p1 , . . . , pn . In this case, the embedded model has to be switched to another attractor such that it satisfies (D) (D) pt+1 = f ∗ (pt , φD ). Therefore, during the transport of different products, the embedded model of the sensor is trained to modulate different attractors of different trajectories, as shown in eq-(4.9). After a certain time of learning, the embedded model is supposed to be able to tell the trolley the proposed entire trajectory for a particular product, as soon as the φ value is known. � � (i) (i) ∗ (4.9) pt+1 = f pt , φi , i = A, B, · · ·
4.4.2
Conditional Prediction with RNNs
Recalling the general model of a recurrent neural network, as shown in eq-(4.10) and eq-(4.11), st = H (Wt , st−1 , xt−1 ) xt = G (Wt , st )
(4.10) (4.11)
one can further simplify them by omitting the intermediate hidden-state vector st , as shown in eq-(4.12). xt = f (xt−1 ) (4.12) In order to apply recurrent neural network models in conditional prediction, the following adjustments are required: • As eq-(4.9) is not analogous to the general model of RNN in eq-(4.12), a rearrangement is required to shape the eq-(4.9) into eq-(4.13) for reasons of modeling. Now, a RNN model can be applied to the conditional prediction by taking xt as the tuple combining the trajectory data pt and the corresponding φ value, i.e. xt = [pt , φ]. � � h i (i) (i) (4.13) pt+1 , φi = f ∗ pt , φi , i = A, B, · · · • The initialization condition of a trajectory consists in the value setting of starting point p0 and the trigger signal φ. While the φ value is directly determined by the product type, the starting point value p0 can be manipulated. This starting point is virtual and doesn’t exist in the actual trajectory. To achieve stable reproductions of the associated trajectory patterns, this virtual starting point p0 for the particular trajectory pattern should remain unchanged. There are two options for the initialization of p0 , where in both cases the p0 value of particular trajectory pattern has to
66
4. Applications with SpiralRNN s remain unchanged after initialization, as if it was an actual part of the corresponding trajectory pattern. They are: Scheme-1 The p0 value is set to zero for all trajectories without exception. Scheme-2 The p0 value is randomly initialized when the particular product occurs for the first time. Note that the introduction of the virtual staring point p0 magnifies the impact of the initial tuple x0 on the learning. Similar effect can be achieved by setting the hiddenstate vector s with a particular randomly-predefined value whenever model starts the training of a particular trajectory pattern. In this thesis, the former solution (with the introduction of p0 ) is taken.
With the new model in eq-(4.13) and the completion of training data (by inserting the virtual starting point), recurrent neural network (RNN) models can be applied in conditional prediction problems. The implementation comprises the initialization step, the training step and the testing step. Initialization: Whenever a product appears at the entrance (or the postern), no matter whether it is for training or testing, the sensor triggers the signal φ according to product type and starts the initialization. In the initialization, the hidden-state vector of the neural network will be reset to zero in order to avoid any influence from the past. The tuple x0 = [p0 , φ] is only initialized when the product type is presented at the first time. In this way, the initial tuple x0 is unique and constant for the corresponding trajectory. The pseudo-code for the initialization is given in table-4.12. Training: At time step t + 1, for instance, the target tuple is constructed with the latest data: xˆt+1 = [pt+1 , φ]. The neural network iterates itself according to eq-(4.10) and eq-(4.11) with the previous tuple xˆt as input. Note that, by teacher forcing, xt−1 (network output) is replaced by xˆt−1 (data) in eq-(4.10). As in an on-line learning mode, network parameters are updated at each time step, and the output xt+1 is compared to the new-constructed target tuple xˆt+1 . The on-line training is again based on an extended Kalman filter (EKF) combined with the real-time recurrent learning (RTRL). When the trolley arrives the target cabin, the attached sensor triggers a termination signal, and stops the training process. The pseudo-code for training with any trajectory pattern is given in table-4.13. Testing: In testing, the product type is known, as is the φ value. The task is to reproduce the corresponding trajectory of a particular product for monitoring purposes when the corresponding φ value is given. Again, the initialization is carried out before everything else, setting up the initial tuple x0 and eliminating from the hidden state any remaining information.
4.4 Conditional Prediction with SpiralRNN s
67
obtain the corresponding φ value of a trajectory pattern; reset the value of hidden-state vector s to zero; switch initialization scheme of p0 case 1: (scheme-1) set value of p0 to zero case 2: (scheme-2) if the trajectory pattern occurs for the first time then randomly initialize the p0 value over the range of (-1,1); save this initial value for this pattern; else restore the p0 value from the corresponding saved value; end end construct the initial tuple x0 = [p0 , φ] Table 4.12: The pseudo code for the initialization in conditional prediction
implement the initialization step and obtain the initial tuple x0 for each data pt+1 in the trajectory pattern ~p construct a new tuple xˆt+1 = [pt+1 , φ] set the previous tuple xˆt as the network input; iterate the neural network according to eq-(4.10) and eq-(4.11); calculate the residual δ = xˆt+1 − xt+1 ; adjust parameters according to the δ value based on the EKF; end Table 4.13: The pseudo code for training in conditional prediction.
With the initial tuple x0 from the initialization step, the neural network iterates according to eq-(4.10) and eq-(4.11) as it does in training step. Instead of comparing with the target, as it did in training, the network output in testing phase will be used as network input in the next iteration of this autonomous test. Such autonomous iterations continue until the stopping criterion is satisfied, usually by the length of the autonomous test reaching the predefined value lp . The pseudo-code for testing of one trajectory pattern is given in table-4.14.
68
4. Applications with SpiralRNN s
implement initialization step and obtain the initial tuple x0 while the iteration step it doesn’t exceed value of lp set the tuple xt as the network input; iterate the neural network according to eq-(4.10) and eq-(4.11) and generate the network output xt+1 ; increase the it value by one; end concatenate all autonomous outputs to form the predicted trajectory ~x = {x1 , . . . , xn }; Table 4.14: The pseudo code for testing in conditional prediction
4.4.3
Experimental Settings
Data The trajectory data set is directly extracted from the trajectory coordinates of different products in the warehouse scenario shown in fig-4.15. It is assumed that the trolley, so as to convey products, moves at a constant speed19 and that, within a sampling-time interval of the sensor, the trolley moves from one grid point to one of four neighboring grid points, as long as they are not blocked by obstacles. The φ values for trajectory patterns A to F are respectively set to {1, −1, 0.5, −0.5, 2, −2}. The value of p0 can be set according to either of two initialization schemes, to show the effects of different initializations on performance. The length of each trajectory (excluding the virtual starting point) is set to lp = 11 but may also have different values for different trajectories. The number of trajectory patterns np in each simulation varies, ranging from 2 to 6. Choice of trajectory patterns will usually start with product A, e.g. trajectories of products A, B and C will be chosen when np = 3. Data are corrupted by normally distributed noise satisfying N (0, 10−2). Comparison models The performance of SpiralRNN models will be compared to that of conventional neural network models, such as echo state networks (ESN ), block diagonal recurrent nets (BDRNN ) and the classical multi-layer perceptrons (MLP ) with three layers. Recall that the EKF algorithm dominates the training effort and that the complexity of the EKF algorithm is determined by the number of parameters in the model. Neural network models will be compared to each other under the condition that all models have similar network sizes. As the number of input/output neurons of models is dependent on the dimension of data and is therefore fixed (in this case, input entries include two for the trajectory coordinates and one for the φ value), one can change the number of hidden nodes in order to change the model complexity Cs . Table-4.15 lists the number of hidden neurons in the competing models with different network 19
When the trolley is not operated at constant speed, dividing the trajectories into segments of identical length can fake constant speed, as is done with the MouseTracking data in section-4.3.2.
4.4 Conditional Prediction with SpiralRNN s
69
sizes, and the listed settings will be used in simulations. PP PP model PP PP Cs P
SpiralRNN
ESN
BDRNN
MLP
100 weights 200 weights 300 weights
12 24 36
30 63 96
12 24 38
14 28 42
Table 4.15: Numbers of hidden neurons in neural network models with various network complexities (different Cs values). Note that the values in the first column refer roughly to the number of trainable weights of the networks.
Without explicit notification, parameters in all models will be initialized according to the normal distribution N (0, 10−2). For reasons of easy deployment, the construction of the SpiralRNN model follows chapter-3. The number of hidden units will be the same as the number of input nodes, where all hidden units have an identical number of hidden nodes. The configuration of the ESN model follows [50]. Its hidden weight matrix Whid is initialized randomly over range [−1, 1] with the sparsity value 95%; afterwards the matrix is rescaled such that the maximum eigenvalue of Whid is equal to 0.8. The BDRNN model will take the scaled orthogonal version (refer to [53]), where entries of each of the 2 × 2 sub-block matrices are determined by two variables w1 and w2 satisfying w12 + w22 ≤ 1. Similar to the other models, the three-layer MLP model has 3 input and output nodes, whereas the number of hidden nodes is adjusted according the network complexity. Training and testing Training will be carried out in rounds, and it is called “training round”. In each training-round, the model is trained with all trajectory patterns, one by one in random order. After nt rounds of training, a test round begins. In a test round, the trained model tries to reproduce the seen trajectory patterns, given the corresponding φ values and their respective virtual starting points, Training and testing follow the respective description in section-4.4.2. Evaluation Even though the data set is 3-dimensional, the evaluation focuses only on the trajectory entry set, named Γ, rather than the entry for φ. The evaluation error ε at each test round is calculated according to eq-(4.14) and eq-(4.15). Note that ǫi,t,k refers to the error of lp -step-ahead prediction when t = lp , and that ǫi,t,k in eq-(4.15) refers to taking the mean value of ǫ over all indices i, t and k. For statistics reasons, the final result takes the average value as well as the standard deviation value over 30 simulations. ǫi,t,k = (ˆ xi,t,k − xi,t,k )2 , ε = ǫi,t,k
i ∈ Γ, t ∈ [1, lp ], k ∈ [1, np ]
(4.14) (4.15)
70
4. Applications with SpiralRNN s Because of the regular grid where the interval between grid lines equals 0.1 (refer to fig-4.15), a prediction is considered to be matched if the absolute prediction error |ˆ x − x| is smaller than 0.05. Therefore, the threshold value θ for evaluation is set to logarithmic value of 0.05, as in eq-(4.16). This threshold value will be used as an indication of fulfillment of performance in the following discussion. θ = log(0.052 ) ≃ −2.6
4.4.4
(4.16)
Results
Simulations have been implemented with two initialization schemes for p0 , as described on page-66. In all tasks, simulations are repeated 30 times for statistics reasons. Evaluation is done by considering the mean value and standard deviation value of results over 30 simulations. All numbers in tables are base-10 logarithm values of the respective ε. In the histograms, the X-axis represents the ε value in 10−3 units, and the Y-axis shows the occurrence frequency of the respective ε value. Results with p0 initialization scheme-1 With scheme-1, p0 is set to all zeros without exception. Results in table-4.16 report the performance of mentioned neural network models in different tasks where the number of network parameters varies from 100 to 300 and the np value is set respectively from 3 to 5. Example histograms of ε values are given in fig-4.16 (Note the different scales of the X-axis and the Y-axis in different sub-figures). Each subfigure in fig-4.16 depicts the histogram of the particular neural network model (with settings Cs = 200, nt = 30 and np = 4). The SpiralRNN model outperforms the others in these tests even though the MLP model has given relatively comparable and stable (ref. fig-4.16(c)) performance, whilst the BDRNN suffers from the outlier in the result (refer to fig-4.16(d)) and the ESN model hasn’t be able to deliver a good result. Table-4.17 depicts the results of the SpiralRNN model in different tasks (w.r.t. network size and np value) after nt training rounds. Each column in the table represents one task with a particular network size and a particular np value. A simulation result is not available for all nt values, and symbol “-” means no simulation was performed. Bold font marks the first result in each column better than threshold value θ (if there is). The performance of SpiralRNN improves if it sees more data, as the value of nt increases. But for complicated tasks (with a bigger value of np ), the model cannot deliver satisfying results even after nt = 110 training rounds. Results with p0 initialization scheme-2 Table-4.18 presents the performance results from competing models which have been trained nt = 20 rounds, where neural network models are set to different network sizes from 100 to 300 and are supposed to reproduce different numbers of trajectory
4.4 Conditional Prediction with SpiralRNN s task
71
100 weights, np = 3
200 weights, np = 4
300 weights, np = 5
HH HH nt model HH
10
30
50
70
10
30
50
70
10
30
50
70
SpiralRNN ESN BDRNN MLP
-2.31 -0.71 -2.02 -2.24
-2.75 -0.71 -2.23 -2.42
-2.93 -0.72 -2.29 -2.56
-2.99 -0.72 -2.38 -2.56
-2.15 -0.70 -1.90 -2.07
-2.74 -0.70 -1.71 -2.63
-3.19 -0.71 -2.37 -2.69
-3.31 -0.71 -2.49 -2.70
-2.02 -0.69 -1.82 -1.67
-2.50 -0.73 -2.25 -2.12
-2.63 -0.73 -2.36 -2.39
-2.87 -0.73 -2.24 -2.55
Table 4.16: Comparisons of evaluation error ε defined in eq-(4.15) of different models in different tasks (w.r.t. network sizes and number of trajectory patterns np ). Note that all values are on a logarithmic scale and initialization scheme-1 is used.
20
6
10
30
5
25
8
15
4
20
6
10 4
5
0 0
2
5
10
(a) SpiralRNN
15
0 185
3
15
2
10
1 190
195
200
(b) ESN
205
210
0 1
5
2
3
(c) MLP
4
5
0 0
100
200
300
400
(d) BDRNN
Figure 4.16: Histograms of evaluation error ε (over 30 simulations) of neural network models with 200 network parameters with np = 4 trajectory patterns and nt = 30 training rounds. The X-axis refers to the value of evaluation error in unit of 10−3 , and the Y-axis shows the occurrence frequency of respective ε value. Note the different scales of the X-axis and Y-axis in different subfigures.
patterns. A comparison of histograms of these models (with settings Cs = 200, nt = 20 and np = 4) is shown in fig-4.17. The SpiralRNN model has surpassed all the other mentioned models in terms of accuracy (refer to table-4.18) and stability (refer to fig-4.17). The ESN model has failed in most of the cases, and the BDRNN has again seen outliers in simulations. The MLP has shown slow convergence, and performance degrades fast when value of np increases. Table-4.19 reports the performance improvement of SpiralRNN with more training data, as the value of nt increasing from 10 to 40. Fig-4.18 shows the histograms of ε values of SpiralRNN in different nt training rounds, where the model has the network size of 300 weights and the task is to reproduce np = 5 trajectory patterns. The initialization scheme-2 for the p0 value has proven efficient, since results of all tasks at nt = 20 training rounds have shown lower evaluation error than the threshold value (refer to table-4.19). An example of such an improvement can be found in histograms in fig-4.18, where the improvement from nt = 10 (sub-figure 4.18(a)) to
72
4. Applications with SpiralRNN s network size HH HHnp nt HH 10 30 50 70 90 110
100 weights
200 weights
2
3
4
5
-2.70 -3.28 -3.69 -3.64 -
-2.31 -2.75 -2.93 -2.99 -
-2.22 -2.35 -2.44 -2.49 -
4
5
-2.15 -1.97 -2.74 -2.14 -3.19 -2.21 -3.31 -2.23 -
-2.28 -2.29 -2.41 -2.66 -
300 weights 6
5
6
-2.02 -2.50 -1.65 -2.63 -1.75 -2.87 -1.88 -1.93 -
-2.09 -2.21 -2.29 -2.36
Table 4.17:
Performance improvement of SpiralRNN in successive training rounds with different tasks (w.r.t. network size and number of trajectory patterns np ). Symbol “-” means that no simulation was performed for that scenario. Note that initialization scheme-1 is used and iall values are on a logarithmic scale.
Model SpiralRNN ESN BDRNN MLP
100 weights np =2 np =3 np =4 -3.23 -2.84 -2.44 -1.15 -0.82 -0.66 -1.52 -2.17 -1.98 -2.11 -2.01 -1.10
200 weights np =4 np =5 np =6 -3.04 -2.76 -2.53 -0.77 -0.64 -0.50 -2.25 -2.24 -1.97 -2.27 -1.73 -1.29
300 weights np =5 np =6 -2.97 -2.73 -0.70 -0.57 -2.27 -2.23 -1.76 -1.51
Table 4.18: Comparison of evaluation error after nt = 20 training rounds between models in different network sizes and in different tasks. Note that initialization scheme-2 is used and all values are on a logarithmic scale. 10
7
10
30
8
25
6
8
5 6
4
4
3
20 6 15 4 10
2 2 0 0
2
1 1
2
(a) SpiralRNN
3
0 0
100
200
300
(b) ESN
400
500
0 0
5 5
10
(c) MLP
15
0 0
20
40
60
(d) BDRNN
Figure 4.17: Histograms of evaluation error ε (over 30 simulations) of neural network models with 200 network parameters with np = 4 trajectory patterns and nt = 20 training rounds. The X-axis is the evaluation error in 10−3 units, and the Y-axis shows the occurrence frequency of the respective ε value. Initialization scheme-2 is used. Note the different scales of the X-axis and the Y-axis in different sub-figures.
80
4.4 Conditional Prediction with SpiralRNN s
73
nt = 20 (sub-figure 4.18(b)) is significant, which also implies that the model converges after nt = 10 and before nt = 20. 100 weights np =2 np =3 np =4 -2.76 -2.46 -1.99 -3.23 -2.84 -2.44 -3.43 -3.00 -2.54 -3.63 -3.04 -2.63
training rounds nt =10 nt =20 nt =30 nt =40
200 weights np =4 np =5 np =6 -2.47 -2.23 -2.03 -3.04 -2.76 -2.53 -3.19 -2.99 -2.76 -3.34 -3.11 -2.84
300 weights np =5 np =6 -2.39 -2.02 -2.97 -2.73 -3.17 -3.04 -3.31 -3.21
Table 4.19:
Comparison of the evaluation error ε of SpiralRNN models in different network sizes in different tasks. Note that all values are on a logarithmic scale and that initialization scheme-2 has been used.
20
10 8
25
20
20
15
15
15
6
10
10 10
4
5
2 0 0
5
10
(a) nt = 10
15
0 0
5
5
2
4
(b) nt = 20
6
8
0 0
2
4
6
0 0
(c) nt = 30
1
2
3
4
(d) nt = 40
Figure 4.18: Histograms of evaluation error ε (over 30 simulations) of the SpiralRNN model with 300 network parameters with np = 5 trajectory patterns at different nt training rounds. The X-axis is the evaluation error in 10−3 unit, and the Y-axis shows the occurrence frequency of the respective ε value. Initialization scheme-2 is in use. Note the different scales of the X-axis and the Y-axis in different sub-figures.
Discussion Results shown in the above tables and figures clearly show that: (1) Different trajectories can be stored by recurrent neural networks simultaneously. A well trained model can even distinguish trajectories which are not totally different right from the beginning, e.g., the trajectories of products C and D shown in fig-4.15. Typical examples of trajectory prediction provided by a SpiralRNN model are given in fig-4.19, where the SpiralRNN model has 200 weights and reproduces all np = 4 trajectory patterns after nt = 20 training rounds. Note that in each sub-plot the output trajectory is the autonomous result of the SpiralRNN model, given initial starting value x0 but no further data input. This autonomous prediction does not necessarily match at every prediction step, but predictions of trajectories follow the trend of the respective target and are themselves distinguishable from each other (refer to fig-4.19).
74
4. Applications with SpiralRNN s 0.8
0.8
0.8
0.5 0.6
Auto. Output Target
Auto. Output Target
0.4 0.3
0.4
0.6
0.6
0.4
0.4
0.2 0.2
0.2
0.2
0.1
Auto. Output Target
0 0.1
0.2
0.3
(a) trajectory A
0.4
0.4
0.5
0.6
0.7
0.8
(b) trajectory B
0.9
0.4
0.5
0.6
(c) trajectory C
Auto. Output Target
0
0
0
0.7
0.4
0.45
0.5
(d) trajectory D
Figure 4.19: The autonomous outputs on np = 4 trajectory patterns from a SpiralRNN model with 200 weights after nt = 20 training rounds. The red dot at location (0.4, 0) marks the warehouse entrance. Note that these are the autonomous outputs when a trained SpiralRNN model is only given different respective initial starting values as initial input. Initialization scheme-2 is in use.
(2) Different neural network models have shown different convergence speeds, where the SpiralRNN model outperforms other approaches in different prediction tasks and with different network size. It is worth mentioning that the SRN model shows similar or even slightly better results than the SpiralRNN but sometimes suffers from instability such that training fails completely (refer to section-4.2.1). On the other hand, this result indicates that the constraints on the hidden layer structure of a SpiralRNN do not severely constrain the modeling power of this architecture compared to the unconstrained SRN. The fact that ESN models don’t provide acceptable performance shows that their reduced variability (only the output weights can be trained) imposes too many constraints and that the linear mapping imposed by the output weights is not sufficient for the conditional prediction described in this section. The BDRNN and MLP models have achieved better results than the ESN, but suffer from slow convergence. These results are also confirmed by the histograms in fig-4.16 and fig-4.17. (3) Simulations with initialization scheme-2, where p0 is randomly initialized but kept constant afterwards for each trajectory pattern, have shown better performance than those with scheme-1 where p0 is reset to zero without exception. It is manifested in table-4.19 that, after nt = 20 or even nt = 10 training rounds, the SpiralRNN model is able to achieve an evaluation error smaller or close to the threshold θ in all mentioned tasks. However, the results in table-4.17 with initialization scheme-1 do not reflect such efficiency. Fig-4.18, as an example, shows the fast convergence of scheme-2 as well as of the SpiralRNN model. Simulations in this section were conduced with trajectory data of dimension 2, but it can be easily extended to support the application with high dimensional data. The length of data pattern can vary, but a longer data pattern requires more training or a larger network
4.5 NN5 Competition of Data Prediction
75
for recognition and modeling of the dynamics of the whole trajectory pattern.
4.5
Using Online Learning of SpiralRNN in NN5 Data Prediction Competition
NN5 competition20 is one of the leading competitions with an emphasis on utilizing computational intelligence methods in data prediction. The data in question come from the amount of money withdrawn from ATM machines across England. These data exhibit strong periodical (e.g. weekly, seasonally and yearly) behavior (ref. fig-4.20). The associated processes have deterministic and stochastic components. In general, they will not be stationary, as for example more tourists are visiting this area or a new shopping mall has opened. There are in total 111 time series in the database, with each time series representing the withdrawal from one ATM machine and each data point in particular time series indicating the withdrawal amount of the day from the particular ATM machine. All 111 time series were recorded from the 18th March 1996 till 22nd March 1998, and therefore contain 735 data points. The task of the competition is to predict the withdrawal of each ATM machine from 23rd March 1998 to 17 May 1998, 56 data points in total. The evaluation of prediction performance is based on the so-called SMAPE error value defined in eq-(4.17), where yt∗ and Ft∗ are respectively the predicted output and data.
Esmape = 1/n
4.5.1
n X |yt∗ − Ft∗ | × 100% ∗ ∗ (y + F )/2 t t t
(4.17)
Towards NN5 Competition
Theoretically, SpiralRNN can learn the dynamic characters of given data by itself. However, additional input can help to find a more accurate solution and to speed-up convergence. For the current task these are: (1) providing periodic input mimicking calendar information; (2) using committee of experts approach on top of neural network training. 20
http://www.neural-forecasting-competition.com/
76
4. Applications with SpiralRNN s 89
68
30
100
25
80
20 60
15 40
10
20 0 0
5 200
400
600
800
0 0
200
(a) sample 1
400
600
800
600
800
(b) sample 2
110
1
60
80
50 60 40 30
40
20 20 10 0 0
200
400
(c) sample 3
600
800
0 0
200
400
(d) sample 4
Figure 4.20: Sample data from NN5 competition dataset with cross markers indicating Saturdays.
Data characteristics The time series data in the NN5 dataset exhibit at least the following features F1
Strong weekly periodic behaviour dominates the frequency spectrum, usually with higher values on Thursday and/or Friday;
F2
Important holidays such as the Christmas holidays (including the New Year holiday) and the Easter holidays have a visible impact on the data;
F3
Several of the time series such as time series No. 93 No.89 show strong seasonal behavior, i.e. a yearly period;
F4
Some of the time series (like No. 26 and No. 48) show a sudden change in their statistics, e.g. a shift in the mean value.
21
21
; :
Note that the Easter Fridays in 1996 to 1998 should have the indice “19”, “376” and “753” in the given data and the Saturdays before Christmas day of 1996 and 1997 have the indices “283” and “648”.
4.5 NN5 Competition of Data Prediction
77
Pre-processing and additional inputs The data presented to the neural network are mapped to a useful range by the logarithm function. In order to avoid singularities due to original zero values, they are replaced with small positive random values. Additional sinusoidal inputs are provided as a representation of calendar information. These additional inputs include: 1. Weekly behavior addressing feature F1 . Refer to fig-4.21(a) and note the period is equal to 7. 2. Christmas and seasonal behavior addressing feature F2 and F3 . It is often observed from the dataset that, right after the Christmas holiday, withdrawal of money is low and then increases during the year, finally reaching its summit value right before Christmas. Seasonal features do not prevail in the dataset, but they do exist in several of them, e.g. time series No. 9, No. 88. As both are regular features with a yearly period, it makes sense to provide an additional input as shown in fig-4.21(b) which has the period value 365. 3. Easter holiday bump addressing feature F2 . The Easter holidays did not have as much impact on the data dynamics as the Christmas holidays did, but it shows an effect on the usage of ATM in some areas (shown in some time series). Furthermore, as the 58-step prediction interval includes the Easter holidays of year 1998, the prediction over the holiday can be improved when the related data behavior is learnt. This additional input uses the Gaussian-distribution-shape curve to emulate the Easter holiday bump as in fig-4.21(c). Supplied with additional inputs, SpiralRNN s were trained online (see fig-4.22) such that data points were fed-in the network one-by-one and network parameters were trained between the time-step interval, as described in section-3.2.2. 1
1
0.5
0.5
0
0
1 0.8 0.6 0.4
−0.5
−0.5
0.2
−1 320
325
330
335
(a) Weekly-input
340
−1 0
200
400
600
(b) Christmas-input
800
0 0
200
400
600
(c) Easter-input
Figure 4.21: Additional inputs of neural networks. On the X-axis is the time steps, and Y-axis is the additional input value.
800
78
4. Applications with SpiralRNN s Output xt
Data
Target x ˆt Output Layer
Z−1
Gradient Calculation Hidden Layer
EKF
Input Layer
Input x ˆt−1
1 0.8
1
1
0.5
0.5
0.6
0
0
0.4
−0.5
−0.5
0.2
−1 0 0
200
400
600
800
320
325
330
335
340
−1 0
200
400
600
800
Figure 4.22: Online training of SpiralRNN in NN5 competition with additional inputs.
Committee of experts SpiralRNN is capable of learning time series prediction with fast convergence; nevertheless, the learned weights correspond to local minimima of the error landscape as mentioned in [87]. As computational complexity is not an issue for this competition, a committee of experts ansatz is applied. The committee of experts consists of several SpiralRNN models with identical structure but different initialization of parameter values. Each SpiralRNN model operates in parallel without any interference to the others. Online training will be done through the time series, step by step. The importance of experts’ output in the committee, i.e. the weights of the experts’ output, is determined by the average SMAPE value over the last 56 steps. Therefore, at time step t = 735 − 56 = 679, each model produces a prediction for the next 56 steps using its output as the input for next time step. After that, online learning continues until the end. For the predicted 56 values, the SMAPE error values compared to their respective data are determined and averaged over these values. Note that, during the autonomous prediction, current output of network will be fed back as input for next time step, therefor there is no intervention from outside of neural network. This autonomous ~ t , will be stored and SMAPE error value will be calculated by comparing output, namely U ~ Ut with the future available data values in the time series. Each SpiralRNN model k measures the average SMAPE value εk according to eq-4.18, where Es refers to the SMAPE error calculation. 56
εk =
1 X ~ t , Uˆt ) Es (U 56 t=1
(4.18)
4.5 NN5 Competition of Data Prediction
79
Similarly, autonomous predictoin will also be produced at the last time step t = 735 where data yˆt |t = 735 is provided to the network model k and generates the 56-step autonomous output Pk . With the SMAPE error measurement εk and the 56-step autonomous prediction Pk , one can produce the final prediction using the voting weights of each expert k, such that: φ =
n X
1/ε2k
(4.19)
k
Pt
n
1X Pt,k /ε2k = φ k=1
(4.20)
The whole procedure is listed in table-4.20, and a schematic diagram fig-4.23 depicts the organization of the committee. 0. Initialize the n experts; 1. For a SpiralRNN model k, implement on-line training with the data and make a 56-step prediction Uk at time step t = 679. The prediction value Uk will be compared to the data in order to obtain the average SMAPE error value according to eq-4.18. 2. After the prediction at time step t = 679, continue the online training till the end, and produce another 56-step autonomous prediction Pk . 3. Based on their εk values, combine the prediction Pk according to eq-4.20. Table 4.20: Committee of experts.
final output
w1 ∼ 1/ε21
expert 1
w2 ∼ 1/ε22
expert 2
wn ∼ 1/ε2n
expert n
Figure 4.23: Committee of SpiralRNN experts where their weights in committee are determined by their SMAPE values on testing dataset.
80
4. Applications with SpiralRNN s
Adapted EKF on-line training of SpiralRNN The SpiralRNN model used for the competition is constructed according to the description in chapter-3 and in section-4.1. Modifications locate in (1) the number of output is fixed to one so that there is no need to predict the additional inputs whose values are known beforehand and are easy to obtain, and (2) the adapted calculation of gradient matrix Ψ in eq-3.43. Recall that logarithm operator is used in order to map the data into a reasonable range before they are fed into the neural network, and that SMAPE error evaluation is used as in eq-(4.17). Therefore, the calculation of gradient Ψ is adapted as in eq-4.23 with yt = ln(yt∗ ) being the output in transformed scale and Ft = ln(Ft∗ ) the data in transformed scale: s = exp(yt ) + exp(Ft ) d = exp(yt ) − exp(Ft ) � � exp(yt ) |d| ∂yt Ψt = − sign(d) + s s ∂wt
(4.21) (4.22) (4.23)
As there exist data with missing values, the parameter-update is skipped when missing data are involved in the training, but meanwhile still accumulate the gradient of output w.r.t. parameters, until data values are available again.
4.5.2
Results
Here, some results of the prediction task are shown. In order to provide evaluation results, the last 56 data of each time series were treated as test data while the remaining data were used for online-training. In fig-4.24, prediction and data are compared for time series 35 which has a pronounced weekly periodicity. Obviously, this periodicity can be reproduced very well, even details like the small bump. Seasonal behavior of data can also be learned as shown in fig-4.25. The curves in both sub-plots begin with the values in Christmas holidays (with time indices around 280 and 650). The rise and fall of the data during the first about 100 days and a subsequent rise in fig-4.25(a) can also be seen one year later in Fig-4.25(b). Obviously, the model is able to capture this behaviour pretty well. Easter holidays can also be recognized by the trained model as shown in fig-4.26 for time series No. 110. Since the expert-weight in the committee is determined by the average SMAPE value as in eq-4.20 which doesn’t focus on the error during Easter holiday period, the ability to predict the accurate values for the easter holidays has been diluted. But as shown in fig-4.26, the jumping feature in data for Easter holiday has been recognized by the on-line training. The Easter holidays in 1996 to 1998 are indexed at times around
4.5 NN5 Competition of Data Prediction
81
35 35 30 25 20 15 10 5 700
710
720
Figure 4.24: Comparison between result and data showing weekly behavior for time series 35. Dashed line with circles is the data and solid line with squares is the prediction. Time is on the X-axis.
9
9
15
15
10
10
5
5
300
350
(a) seasonal-data
400
650
700
750
800
(b) seasonal-result
Figure 4.25: Comparison between result and data for time series 9 showing seasonal behavior. Dashed curve is the data and solid curve is the prediction. X-axis is time.
20, 375 and 755. In fig-4.26, the prediction for the Easter holidays 1998 shows a similar behaviour as the Easter holidays in 1996 and 1997 with a pronounced peak. Table-4.21 shows the SMAPE errors on the test set (i.e. the data from the last 56 time steps) with a varying number of experts. Obviously, the number of experts does not alter the average result, which allows to save computational effort. Fig-4.27 shows the histogram of committee-averaged SMAPE values over 111 time series in the dataset. The majority of the results have a SMAPE value around 20. It is shown that, using the committee of experts approach where the weight of each expert’s vote is determined by the error of
82
4. Applications with SpiralRNN s
autonomous output, one can avoid the degradation from the over-fitting of some experts. 97 50 40 30 20 10 0 0
200
400
600
800
Figure 4.26: Prediction result (solid curve) and data (dashed curve) for time series 110 showing a peak around Easter. X-axis is time.
# experts SMAPE
3 5 10 15 20 30 21.44 20.92 21.41 22.26 22.18 21.6
Table 4.21: Statistic results. The committee-averaged SMAPE error value of the expert committee on all 111 time series with different number of experts.
12
Occurrence
10 8 6 4 2 0 0
10
20 30 40 SMAPE error value
50
Figure 4.27: Histogram (over 111 time series) of committee-average SMAPE error from experts .
4.6
Analysis on SpiralRNN s
This section makes a general analysis of SpiralRNN models, using some of the results and methods from previous sections. Topics include the attractors learnt by the Spiral-
4.6 Analysis on SpiralRNN s
83
RNN model, the short-term memory capacity and the associative memory capacity of a SpiralRNN model.
4.6.1
Stability of Attractors
Stability of a trained SpiralRNN model has been demonstrated by autonomous tests with deviated initial input values. Note that, in autonomous tests, the model uses the previous output value as the current input value. The only exception is the initial input value which is supplied from outside. Fig-4.28 shows the autonomous outputs generated by a trained SpiralRNN model from the simulation with data set Spike21. Each sub-figure in fig-4.28 shows the result from simulation with different initial input values {±0.1, ±1, ±10, ±100} respectively. The first part of the autonomous output corresponds to the transition phase from the initial state to the attractor regime. Without exception, the models with different initial input have shown periodical behaviour in the attractor regime, where the autonomous outputs have the period equal to 21. 1.5
1.5
1.5
1.5
1
1
1
1
0.5
0.5
0.5
0.5
0
0
0
0
−0.5
50
100
150
200
−0.5
50
(a) -0.1
100
150
200
−0.5
50
(b) -1
100
150
200
−0.5
(c) -10
1.5
1.5
1.5
1
1
1
1
0.5
0.5
0.5
0.5
0
0
0
0
50
100
(e) 0.1
150
200
−0.5
50
100
(f) 1
150
200
−0.5
50
100
(g) 10
100
150
200
150
200
(d) -100
1.5
−0.5
50
150
200
−0.5
50
100
(h) 100
Figure 4.28: Stability test of a trained SpiralRNN model from the simulation with the Spike21 data set. The sub-figures show the results for different initial input values {−0.1, −1, −10, −100, +0.1, +1, +10, +100} respectively. The Xaxis is the time in the autonomous tests, and the Y-axis is the output.
As another example, fig-4.29 depicts the trajectories of two hidden-neuron activations during the autonomous test with a trained SpiralRNN model from a simulation with the Lorenz data set. In the autonomous test, the SpiralRNN model, with a different initial input value, iterates itself for 1000 time steps. Meanwhile, the hidden-state vector is
84
4. Applications with SpiralRNN s
recorded for each time step. Sub-figures in fig-4.29 show the trajectories of the first and second entries of the hidden-state vector. Positions of two entries in the first five time steps of the autonomous test are denoted by black square markers. Depending on the initial position, the trajectories follows different zigzag paths but are always attracted by the limit cycle driven by the Lorenz data. Note the different scales of the sub-figures, and that the position of the limit-cycle is in the range [−0.2, 0.6] for the X-axis and [−0.2, 0.6] for the Y-axis in all sub-figures22 . 0.8
0.5
0.6
0.8
0.4
0.4
0.6
0.6
0.3 0.2
0.4
0.2
0
0.1
−0.2
0
0.4
0.2
0.2
0
0
−0.2
−0.2
−0.1
−0.4 −0.5
0
0.5
−0.2 −0.2
1
(a) {−4, −4, −4}
0
0.2
0.4
0.6
(b) {−4, −4, +4}
0.6 0.2 0
0
0.2
−0.4
−0.4
−0.6
0
0.5
(e) {+4, −4, −4}
1
1
(d) {−4, +4, +4}
0.2
0
0
−0.2 −0.4
−0.8 −0.5
0.5
0.4
−0.6
−0.8
0
0.6 0.4
−0.2
1
(c) {−4, +4, −4}
0.2
−0.2
0.5
0.6
0.4
0.4
−1
0
−1
−0.5
0
−0.2
0.5
(f) {+4, −4, +4}
0
0.5
(g) {+4, +4, −4}
1
−0.5
0
0.5
(h) {+4, +4, +4}
Figure 4.29: Stability test of a trained SpiralRNN model from simulations with the Lorenz data set. Each sub-figure shows the trajectory of two hidden neurons during autonomous tests with different initial inputs. The starting point coordinates are given beneath each sub-figure. The X-axis and the Yaxis respectively refer to activation values of these two hidden neurons. The first five positions of the trajectory are denoted by black square marks.
4.6.2
Short-Term Memory Capacity
The short-term memory Mst of a SpiralRNN model has been evaluated with the Spike time series. Spike time series are those periodical time series, where most of the entries have a constant value and periodical sparse entries having an other constant value (refer to section-4.1). The distance between two spikes is called the period Pt of the time series. The autonomous test with Spike time series requires a model being able to retain the spike information from the input and able to produce repetitions of spikes in output in an autonomous manner. Note that, during the autonomous test, there are no further data affects the procedure except for the initial input. Therefore, if a network is able to produce 22
Trajectories of different-hidden neurons can have different shapes of limit cycle and position.
4.6 Analysis on SpiralRNN s
85
an autonomous output of spikes, one can claim that the trained network has a short-term memory capacity Mst of not less than the period of the time series. In each simulation, following the network setting (with γ = 1) as described in section4.1.2, a SpiralRNN model with Nh hidden nodes is trained with the Spike data set with the period value Pt . After every 2000 training steps, model generates an autonomous output Yˆ of length23 200. If the autonomous output Y~ and the respective target Yˆ satisfy eq-(4.24), it is claimed that this network has the short-term memory Mst ≥ Pt , then the current simulation is terminated and a new simulation will be implemented with same network structure but the training data is replaced with the Spike time series of longer period (i.e. larger Pt value). Otherwise, the training is continued, until the model has been trained for 1e5 steps. Such 1e5-step simulation will be implemented at most 30 runs. If the model has not satisfied eq-(4.24) in any of the 30 simulations, the network is claimed to have the shor-term memory Mst < Pt , and a new simulation is implemented with same training data but larger network (i.e. larger Nh value). Note that both values of Pt and Nh start from 2, and increase with the step pace 2.
log10 (Yˆi − Yi)2 < −2,
for all i ∈ [1, 200]
(4.24)
The assessment result of short-term memory capacity of SpiralRNN models is shown in fig-4.30. The short-term memory capacity of SpiralRNN models increases as the network become larger, whilst the increment is getting smaller. The relationship is approximated24 by eq-(4.25), where the margin errors are calculated with the confidence level 95%. The term “−2 + |b|” in eq-(4.25) is used in order to avoid the complex value when c < 1. Mst = a(Nh − 2 + |b|)c , Nh ≥ 2 with a = 16.8 ± 0.88, b = 0 ± 0.66, c = 0.42 ± 0.10
(4.25)
Recall that the ESN model and the BDRNN model manually set the maximum absolute eigenvalue of hidden-weight matrix Whid to a particular value λmax < 1, in order to enable the “echo effect” (i.e. the amplitude of the hidden-state vector is shrinking when model iterates). In SpiralRNN, the parameter γ (ref. eq-(3.7) and eq-(3.8)) has a similar functionality. However, the γ value doesn’t establish a rigid limit on the eigenvalue spectrum of matrix Whid , but reflects the difficulty of model to achieve a wider eigenvalue spectrum. � Taking the γ value from the set25 1, 21 , 41 , 81 respectively, SpiralRNN s have produced different performance in terms of short-term memory capacity. Fig-4.31 depicts the result, where each curve denoted by the same type of markers represents the Mst values of model 23
The length of autonomous output has to be greater than the period of the training data, such that at least one spike is supposed to show up in the autonomous test. 24 The regression value of variable b in eq-(4.25) is not exactly equal to 0, but 0.0061. 25 Simulations with γ value bigger than 1, such as 2 and 4, have been considered, but they all reported instability problems since system becomes instable with too large eigenvalue of matrix Whid .
86
4. Applications with SpiralRNN s 100 M 80
st
60 40 20 0 0
20 40 # of hidden nodes
60
Figure 4.30: The short-term Memory capacity Mst v.s. the amount of hidden neurons Nh of SpiralRNN model. Circles are from assessment, and the dashed curve is the regression curve drawn by eq-(4.25).
with particular γ value. The dashed curves are drawn from the regression results based on the assessment values denoted by markers, where the blue curve is the regression result for the γ = 1 case and the red curve for γ = 1/2 (The parameter values when γ = 1/2 are a = 7.9, b = 0.03 and c = 0.44.). It can be observed from the figure, that: (1) With a bigger γ value, SpiralRNN s having the same Nh hidden nodes will possess larger short-term memory capacity. (2) For larger γ values, e.g. γ = 1 or γ = 1/2, the short-term memory of SpiralRNN s satisfies the power law Mst = α(Nh − n0 )c0 , where the n0 ≃ 2 and c0 ≃ 21 , and the α value is proportioned to the predefined value of γ. (3) The Mst curves for small γ values, e.g. γ = 1/4 and γ = 1/8, have shown threshold behavior. After the threshold phase at the beginning, the latter part of both curves seem to start satisfying a power law. The values of both curves are also roughly proportioned to their respective γ values. Therefore, increasing the γ value can extend the short-term memory capacity of SpiralRNN s. However, as mentioned, the model will become instable when the eigenvalue spectrum of matrix Whid is recklessly enlarged, choosing a moderate γ value is therefore a tricky job. Practically, a typical setting is γ = 1. Note that, even though a large γ value tends to widen the eigenvalue spectrum of hidden ~ matrix, the actual eigenvalue spectrum is depending on both values of γ and tanh(ξ) (ref. eq-(3.7)) where the squashed function “tanh” helps the train of ξ value and obtains an appropriate eigenvalue spectrum.
4.6 Analysis on SpiralRNN s
87
short−term memory capacity
100 80
1 1/2 0.42 → 1/4 17(x−2) 1/8
60 0.44
40
8(x−2)
→
20 0 0
20 40 number of hidden nodes
60
Figure 4.31: Comparison of the impact of γ value on short-term memory of SpiralRNNs. The assessment data are obtained by repeating the � simulation as described above, but setting the γ values to one of 1, , 21 , 41 , 18 and changing the Nh increasing step-pace from 2 to 4. The regression equations are shown aside the regression curves, but the approximated coefficients are used for the sake of clarity.
4.6.3
Associative Memory Capacity
Generally, the associative memory of a neural network model illustrates the neural network’s ability of memorizing data patterns, where “data pattern” means one single data vector. The neural network is in such a case a static model, mapping different inputs to different instances in a finite set of target pattern. However, the associative memory of the network model in terms of temporal time series, instead of tracking down to attractors presented by training data, requires the network model to be able to store the dynamics of various trajectory patterns, burdening more difficulties on the learning model. Conditional prediction applications in section-4.4 has indicated that SpiralRNN has certain associative memory and is able to reproduce different trajectory patterns, given the initial starting vector. To evaluate the associative memory, SpiralRNN s configured with different numbers of hidden nodes Nh are trained and tested, where the simulation data consists of varying number np of trajectory patterns. Giving particular values of Nh and np , conditional prediction simulation will be carried out in a similar way as in section-4.4: (1) The experiment starts with a smaller networks (The value of Nh starts from 6, such that the network comprises 3 hidden units and each hidden unit has 2 hidden nodes);
88
4. Applications with SpiralRNN s Training data is the combination of np = 2 trajectory patterns.
(2) With each pair of {Nh , np }, at most 30 simulations are performed, each of which contains 50 training rounds. In each training round, the learning model is trained on-line with the presentation of these np trajectory patterns, in a shuffled sequence but each pattern only once. The hidden-state vector of network is reset before the training with any trajectory pattern starts (refer to section-4.4). After every 10 training rounds, a testing round starts, trying to reproduce all np trajectories in an autonomous manner separately. (3) The autonomous output results are evaluated. Let lp be the length of trajectory patterns (the lp value is identical to all pattern), xi,k be the ith -step ahead prediction over the k th pattern, and xˆi,k be the respective target, the evaluation error ε is calculated as: lp np 1 1 XX ε= (ˆ xi,k − xi,k )2 np lp i=1 k=1
(4.26)
(4) If it satisfies ε ≤ 0.052 , this particular SpiralRNN network with Nh hidden nodes is claimed to be capable of reproducing np number of trajectory patterns of length lp , and thus the associative memory satisfies Ma ≥ np . The model (with the same structure but re-initialized values) will then be assessed with a training data with more patterns, i.e. higher np value. If ε ≤ 0.052 is not satisfied at least once within 30 simulations, it is claimed that SpiralRNN with Nh hidden nodes is not able to reproduce np number of trajectory patterns with length lp . New experiment will start with same value in np but a larger SpiralRNN model by increasing the Nh value 26 by 3. Note that the threshold value is set to 0.05, half the grid distance 0.1, so that the prediction can be rounded to the nearest grid point if the error is less than 0.05. (5) The experiment keeps continuous until simulations with Nh = 60 are finished. The training data, i.e. combination of trajectory patterns, are generated in a fashion different from section-4.4. Each trajectory starts from the origin rather than (0.4, 0), pace of trajectory is again 0.1 which means, at one step, one of the coordinates of trajectory is kept unchanged while the other one changes by 0.1. In each trajectory pattern, one coordinate of trajectory coordinates is monotonically increasing or decreasing. The initial starting point (including the additional information φ) of the data is uniformly randomized in the range [−5, 5] for each pattern. A total of 60 random patterns is generated, where sample patterns in each simulation are randomly selected, rather than selecting them in sequence as in section-4.4. Fig-4.32 depict the assessments on the associative memory of dynamics. Each figure 26
i.e. each hidden unit has one more hidden node
4.6 Analysis on SpiralRNN s
89
demonstrates the result with different value on lp , the length27 of trajectory pattern, where lp = 11 in fig-4.32(a) and lp = 5 in fig-4.32(b). 40 number of trajectory patterns
number of trajectory patterns
20
15
10
5
0 0
20 40 number of hidden nodes
60
(a) for longer pattern
30
20
10
0 0
20 40 number of hidden nodes
60
(b) for shorter pattern
Figure 4.32: The associative memory of a SpiralRNN shows the ability to store several dynamics of trajectory patterns. The X-axis is the network size of model indicated by the total number of hidden nodes, and the Y-axis is the maximum number of patterns which the model can learn. Red dashed lines are regression lines showing the linearity between Ma and Nh . (a) Trajectory patterns of length lp = 11; (b) trajectory patterns of length lp = 5. It is easy to observe that the associative memory capacity Ma of SpiralRNN s is roughly linear with the amount of hidden nodes Nh . The dashed red lines in both figures suggest this linearity. In particular, in fig-4.32(a) the associative memory satisfies eq-(4.27), and in the case of short trajectories in fig-4.32(b) it satisfies eq-(4.28). The reasons why the associative memory capacity with trajectory pattern of lp = 11 is worse than that the one with lp = 5 are: • A longer trajectory pattern requires a longer training time to train the model so that it can adapt to the dynamics imposed by the data; • The evaluation is based on the autonomous output where an error at one time step degenerates future results exponentially, therefore the evaluation error for longer trajectory pattern tends to be larger than that for shorter ones. Ma ≃ (0.31 ± 0.02)Nh Ma ≃ (0.64 ± 0.04)Nh
(for longer patterns) (for shorter patterns)
(4.27) (4.28)
The linearity between the network’s associative memory capacity and the network’s Nh value can also be found in Hopfield networks. According to [88], the associative memory 27
The length of trajectory is counted here without taking the initial starting point into account.
90
4. Applications with SpiralRNN s
capacity28 Mhf of Hopfield network satisfies Mhf = 1/(2 log ǫ−1 )Nh for small error ǫ, where ǫ is the threshold value of acceptable evaluation error. Even though it is unfair for SpiralRNN s to compare the recognition of trajectory pattern with the recognition of fixed point pattern, the associative memory of Hopfield networks at ǫ = 0.05 reads: Mhf = 0.17Nh , which indicates the superiority of SpiralRNN s over Hopfield networks in associative memory capacity.
28
The associative memory capacity of Hopfield networks refers to the number of fixed points in the hidden-state space.
Chapter 5 The Duty-Cycle Reduction and Evolution Framework for Distributed Sensor Networks A distributed sensor network consists of sensor nodes. Among these nodes, there is no master sensor being in charge of data flow and central data processing, but all of these jobs have to be done locally by each sensor. This chapter addresses some issues in building such distributed sensor networks with data predicting ability, including the energy consumption, which is one of the paramount challenges for sensor network applications, and the prediction performance of distributive sensor nodes. Solutions are provided in two categories, namely intra-node viewpoint and inter-node viewpoints. Intra-node In the intra-node viewpoint, solution for energy consumption focuses on the duty cycle of sensor nodes. This can be done mainly within the sensor node and doesn’t directly involve its neighbors. The energy consumption of a sensor node can be greatly curtailed with the diminution of its duty cycle. Duty cycle of one device is defined as the proportion of time during which this device is operated. When a sensor is embedded with a well trained model which provides good prediction, it can diminish the effort to receive data from neighbor by substituting of the requesting communication with the prediction. This is also the reason why a learning model with good performance in long-term prediction is required. Fig-5.1 has illustrated this concept. Inter-node In inter-node view-point, reduction in energy consumption can be realized by changing the embedded learning model of sensor, which requires the information from its neighbors.
92
5. Solutions for Distributed Sensor Networks
1111111111 0000000000 0000000000 1111111111 0000000000 1111111111 0000000000 1111111111 0000000000 1111111111 0000000000 1111111111 0000000000 1111111111 0000000000 1111111111
learning model
B C
A
sensor node “A”
Figure 5.1: Sketch of sensor “A” emphasizing the concept of the duty-cycle reduction. Shaded box in the middle represents the embedded learning model. Symbols “B,C” refer to the data from neighbor sensors “B,C” respectively. Symbol “A” refers to the measured data by sampling. Dashed arcs, indicating the expensive wireless communication, are replaced by the cheap prediction from sensor itself.
To reduce the communication cost, one direct way is to change the interface of the embedded model. The interface of the embedded model refer to the combination of available data streams, which represent themselves as the model input (and output). By changing such interface, the embedded model has the chance to choose those “important” data streams as input and omit those “unimportant” data streams. Furthermore, changing the embedded model applies not only to the interface but also to the inner structure of model itself, where such training of embedded model can be intensive. To reduce the energy consumption in computation, the structure of embedded model is simplified by evolution or co-evolution. This requires the sensor node to request the structure information from its neighbors. Both situations mentioned above require the sensor to be “context-aware” to have have certain knowledge of the environment and its neighbor. Only based on such knowledge, it can takes the decision on choice of data streams and on structure modification. Solutions from intra-node and inter-node view-points can be implemented separately, however, they are connected closely to each other. In one way, from intra-node viewpoint it requires each sensor to train a sufficient recurrent neural network (RNN) model for prediction, whereas a good prediction is based on the assumption that enough spatial data are available (ref. chapter-1), which can be influenced by inter-node operations. In the other way around, from intra-node view-point, the modification of model structure can degenerate the prediction performance, and requires some time for the “recover” of the model. This will consequently hinder the implementation of intra-node solutions. Furthermore, both intra-node and inter-node solutions are feasible under the assumption that the embedded model is fast-converge efficient on-line learning prediction model. Only with such embedded model, can the prediction be wealthy enough to replace the measured data, and
5.1 The Duty-Cycle Reduction
93
can the model be able to recover from evolution in reasonable time. In the following sections, details of the duty-cycle reduction and evolution framework will be given.
5.1
The Duty-Cycle Reduction
The idea behind the duty-cycle reduction scheme is straightforward. Duty cycle is the one of the main criteria to evaluate the life-time of a sensor node. When the duty cycle is reduce, the amount of working time of a sensor within unit time is reduced, hence the life time of the device with given limited energy is accordingly prolonged. Recalling the typical working cycle of a TelosB sensor node in fig-2.8, communication normally occupies the main portion of the working time slots because of the administrative overhead, the waiting and listening time as well as the ever-strengthen processor29 . Moreover, in a broadcasting radio network, sensor node usually spends more time in requesting communication (listening to neighbors) than in issuing communication (sending out data). Therefore, duty cycle can be greatly reduced if the frequency of requesting communication is lowered. To achieve this, replace the transferred data by their respective prediction data is one of the most efficient ways. Even though such substitution of data streams can save energy spending, a long-standing absent of measured data from neighbors will cause the learning model diverge, and sometimes make the system unstable. The learning model need the genuine measured data, from time to time, in order to keep the model dynamics on the right attractor area. Therefore, the communication requesting for measured data need to be resumed periodically. Such period of activity pattern for requesting communication is determined by a positive integer Ap ∈ N+ and is named the “activity period” (for requesting communication) of sensor node in this context. Being related but different from the duty-cycle of a sensor, the value of Ap refers to the number of working cycles of sensor, during one of which the requesting communication is allowed. Fig-5.2 illustrates the concept of activity period. By implementing the duty-cycle reduction, sensor node can directly save the energy spent on requesting communication. As mentioned, the advance of integrated circuit has made computation much more cheaper than that of communication, and such gap becomes larger. Therefore, the duty-cycle reduction scheme will have more and more superiority in the future. The pseudo-code of the duty-cycle reduction is given in table-5.1, where the requesting communication operation is implemented only when “noReduction=1”. Note that, even 29
sive.
Faster processor (data processing capability) relatively makes the communication much more expen-
94
5. Solutions for Distributed Sensor Networks cycle 00000working 11111 1111 0000 000000 111111 cycle 1 000000 111111 000000 111111 cycle 2 000000 111111 000000 111111 cycle 3 000000 111111 000000 111111 cycle 4 000000 111111 000000 111111 cycle 5 000000 111111 cycle 6 111111 000000
00000working cycle00000 11111 11111
(a) normal
111111 000000 000000 111111 111111 000000
cycle cycle cycle cycle cycle cycle
1 2 3 4 5 6
(b) Df = 3
Figure 5.2: Explanation of activity period. Each working cycle consists of the time slot for sending (solid bar without shadow), the time slot for receiving (solid bar with shadow), and time slots for other operations or sleeping (bars with dashed line). Each sub-figure lists distribution of time slots for 6 successive working cycles. (a) the normal case; (b) the activity period value Ap = 3: in every 3 successive working cycles, sensor is allowed to receive data from outside only once.
during working cycles where requesting communication is omitted, the on-line training of the embedded model is kept continuous, because the sensor can always have access to the real data of its own measurement30 . In this case, the calculation of gradient only takes the residual value, corresponding to sensor’s own measured data, into account.
5.2
The Evolution Framework
Because of the limit on the memory capacity and the processing speed of a processor, standard evolutionary algorithm based on genotype selection from large population cannot be applied in sensor network applications. On the other hand, sensor network consists of large amount of sensor nodes, and they can exchange data via the wireless communication. In this sense, evolution can be realized, if sensors are able to deliver their component (i.e. model structure) information to their neighbors, and adopt information from neighbors. However, conventional recurrent neural networks (RNN) cannot be easily adapted to such co-evolution concept in sensor network, either because of the massive-junction of the hidden layer (e.q. ESN, SRN etc.) or the identicalness of structures between separated units (e.g. BDRNN ). The SpiralRNN model, on the contrary, can be easily split into hidden units because of its special structure. Taking hidden units as samples in the population, sensor nodes exchange structure information among each other, and try to find the better combination of hidden units to form the embedded model, as depicted in fig-5.3. Note that only one of evolutionary operations such as “discard” and “absorption” will be implemented at each time. 30
Depending on applications, energy spent in sampling is normally cheaper than in communication.
5.2 The Evolution Framework
95
for each time step if time step is multiple of Ap , noReduction=1; else, doReduction=1; end if noReduction=1 request data from neighbors; replace input by transferred data plus own measurement data; elseif doReduction=1 (duty-cycle reduction) replace input by previous output value plus own measurement data; end iterate the SpiralRNN model and generate output result; if noReduction=1 calculate the residual of output comparing with target; elseif doReduction=1 (duty-cycle reduction) calculate the residual of the output of neuron which is corresponding to its own measurement data; end implement training of parameters based on the residual value; end Table 5.1: Pseudo code for the duty-cycle reduction.
Adapt from neighbor
Discard
Evolution operations Sensor node
Sensor node
Figure 5.3: Structure modification in a sensor node. The embedded model of sensor node is changed by re-combining the hidden units from itself and from neighbors. Note that only one of evolutionary operations such as “discard” and “absorption” will be implemented at each time.
In addition to modifying the model structure itself, evolution should also be able to modify the model interface and find a better combination of input data streams. The model interface refers to the input and output of the embedded model. As the ultra goal of the model is to predict the local measured data, rather than those measured data from the neighbors. The embedded model can theoretically choose any combination of measured
96
5. Solutions for Distributed Sensor Networks
data from neighbors plus the measured data from itself, and use this combined data in the training of model parameters. Such evolution not only simplifies the model complexity but also dilute the communication pressure for requesting data. This evolutionary operation requires the model assess the importance of particular neighbor data to the prediction of its own data. In this section, a evolutionary operation scheme called the evolution framework is introduced. It carries out evolutionary operations (some were mentioned above) to modify the embedded structure of a sensor node, with the aim to adapt to the environment and meanwhile reduce energy consumption. The evolution framework is guided by the vector P, the so-called evolution-operation-selector, which is a probability vector for all possible operations (ref. section-5.2.1). The evolution framework starts from adjusting the value of P based on the fitness value of structure as well as constraints imposed by the applications, and decides which operation will be operated based on the value of P. A sketch of such evolution framework is given in fig-5.4. In the following, details of the evolution framework will be discussed, with the order starting from P as shown in fig-5.4. adjust Constraint
Pω
11111111111 00000000000 00000000000 11111111111
Select ω
ω 6= 1
Evolution Operation
ω=1 Fitness Model Training
adjust
Figure 5.4: Sketch of the evolution framework
5.2.1
Evolution-Operation-Selector
Whether or not to conduct evolutionary operation and which evolutionary operation is going to be implemented are decided by vector P, the so-called evolution-operation-selector. Vector P is a probability vector with each entry of P describes the probability of one particular operation being performed and it always satisfies eq-(5.1). X Pω = 1 (5.1) ω
The first entry of P, i.e. P1 , represents the probability of “null operation”, that is, nothing concerning evolution will be done but normal on-line training of weights in neural network
5.2 The Evolution Framework
97
is performed. The value of P1 will be initialized with high value, such that no evolutionary operations will be conducted at the beginning before the neural network is considered to be mature, i.e. the model is somehow well trained in terms of the current structure. Rest of the entries in P are those probabilities of evolutionary operations (refer to section-5.2.5), with small values at the beginning. Each time step, values of probability for evolutionary operations will increase by small amount as in eq-(5.2), so that the probability of them being chosen is getting higher along time. Note that ϕ denotes a small fluctuation, and a typical setting is ϕ = 10−3 . Pω = Pω ∗ (1 + ϕ) ,
ω ∈ [2, . . . ]
(5.2)
Addition to the regular increment as in eq-(5.2), value of respective entry of particular evolutionary operation in P may also be altered based on the constraints (ref. section5.2.2) imposed by the application. Index of active operation is first randomly chosen according to the probability represented by P value. With the selected index, the respective operation will be further considered in terms of the constraints of application (ref. section-5.2.2). Once such operation is not contradictory to the constraints it will be implemented afterward and the respective value in P is cut down and have to wait for the next time when it is picked; if the operation is contradictory to the constraints it will be skipped and the “null operation” will be implemented instead.
5.2.2
Constraint Conditions
Constraint conditions are based on the consideration of energy consumption, memory capacity limits, the sensor nodes’ processing capabilities and other constraints related to the particular application. Depending on applications, one can specify other constraint. These constraint conditions set up boundaries for model properties, in such a way that a candidate operation (as mentioned in section-5.2.1) is rejected if the proceeding of such operation will lead to the breach of boundaries. In the following, those constraints considered in simulation in chapter-6 will be addressed:
(1) processing complexity (Cs ). Size of the embedded learning model (number of trainable parameters in the neural network model) determines the complexity of the learning model. The limit in processing capacity of the embedded processor of sensor node hinders the learning model from employing the model structure of large network size. (2) maximum and minimum number of input data streams (nxds and nnds ). Number of input data streams, i.e. the dimension of the input data, can affect the energy consumption because of the communication requirement. A smaller value of this number
98
5. Solutions for Distributed Sensor Networks implies that the sensor can reduce its effort of listening to neighbors for the input data. But on the other hand, rich information on the environment, which is realized by increasing number of input whose data is transferred from the neighboring sensors, helps the sensor to build up a precise prediction model and thus enhance effect of the duty-cycle reduction. Therefore, there is always the compromise between the prediction model accuracy and the energy consumption, which leads to the contradiction between values of nxds and nnds . And the conflict between them is also depended on the application details.
(3) maximum and minimum redundancy of data (nxrd and nnrd ). In order to remedy the situation that one particular sensor is temporarily inaccessible, redundancy of the respective data in the sensor network is very helpful. Such redundancy exists in the form that another sensor node is using its value for the prediction and at the same time will have a predicted value for the inaccessible sensor. When the prediction at the spot where inaccessible sensor locates is required, the redundancy of the measurement can serve as an alternative. Large value in nxrd could lead to large complexity of embedded neural network, while small amount of nnrd could make the sensor network less robust. (4) recover time (trc ). Right after the evolutionary operation, the structure of the SpiralRNN model is changed abruptly and prediction performance of the model can be unacceptable. To ensure the novelty of new SpiralRNN structure is preserved, the value of trc should be large enough such that the SpiralRNN model is prevented from evolution before the model becomes mature.
5.2.3
Model Training
The principle of training of the embedded learning model is similar to the one described in section-3.2.2. The difference lies in that, when predicted data instead of transferred data are used for training, the residual value between output and target of those respectively replaced data is set to zero, such that the adjustment of parameters in the SpiralRNN model is only subject to the residual of its own measurement data. Let m be the index of sensor’s own measurement data in the input/output vector, and T † be set of time steps when transferred data is replaced by predicted data, the residual value of ith output at time step t is calculated as followed: t ∈ T † , i 6= m 0 (5.3) δi,t = yˆi − yi t ∈ T † , i = m yˆi − yi t ∈ / T† As it will be mentioned later, the evolutionary operations alter the structure of SpiralRNN, and change the combination of connection weights. The covariance matrix P in extended Kalman filter (ref. eq-(3.33)) is modified according to the modification of the connection
5.2 The Evolution Framework
99
weights combination. In particular, when structure components are pruned, the connection weights will be removed from the training set, and matrix P is shrunken, in such a way that the corresponding rows and columns in matrix P that related to the deduced connection weights will be removed (ref. fig-5.5(a)). When a new component is added, the training set and the matrix P are extended in block-matrix manner (ref. fig-5.5(b)), where all the new entries are zeros except the new diagonal entries are set to typical values, e.g. “1”.
000 1 111 0 111 000 0 1 00000 11111 000 111 0 1 111 000 00 11 111 1 000 0 00000 11111 000 111 0 1 000 111 00 11 000 111 000 111 000 111 0 1 000 111 00 11 000 111 00 11 000 111 000 111 00000 11111 000 111 11 00 000 111 00 11 000 111 000 111 000 111 000 111 00 11 000 111 00000(a) 11111 00 000 11 111 (b) Figure 5.5: Modification of matrix P in extended Kalman filter when structure of SpiralRNN is changed. (a) Matrix P is shrunk by removing the corresponding rows and columns; (b) Matrix P is enlarged by extending the diagonal and filling with values equal “1”, where the new diagonal entries are represented by dots and the empty areas are entries equal “0”.
5.2.4
Fitness Values
Three types of fitness values are required in this context, including the fitness value for the learning model as a whole, the fitness value for each hidden units in the SpiralRNN model and the fitness value for each data stream of the sensor node in question. All of these fitness values indicate how much does the respective structure fit the current situation, where the larger the value is the better the respective structure fits. These fitness values are introduced in following: 1. Fitness value for sensor node as a whole indicates how well the learning model in the sensor fits with the circumstance. This fitness value is useful to find out the best neighbor adapting to the circumstance. Based on fitness values from one sensor’s neighbors, the sensor can be aware of the strength of its neighbors which help to make further decision. Calculation of this fitness value is based on the current fitness f˜c at each time step in eq-(5.4), then a Kalman filter is applied to calculate its mean value. Eq-(5.4) takes into account both the performance of sensor node together and the model complexity. As these two factors can not be compared directly, a multiplication operation between them is superior to a weighted summation operation as usual, but
100
5. Solutions for Distributed Sensor Networks the coefficient α should be carefully selected based on the requirement of application. � n �α wei ˜ E∗ (5.4) fc = − �N � ft = Kf f˜c (5.5) where Ei∗ =
|ǫi | σi
i ∈ [1, . . . , d]
where f˜c is the current estimation, function Kf stands for the Kalman filter which estimates the mean value, ǫi = yˆi −yi is the direct output error of the SpiralRNN model, nwei and N are respectively the actual number of weights in the SpiralRNN model and the maximum number of weights allowed, α is the coefficient associated with the weight-ratio, σ is the standard deviation of data which is also online-estimated by a Kalman filter, i is the index in I/O list of the learning model. The calculation of the �2 standard deviation σ of variable X is based on the definition σ 2 = X − X , which can be realized by: � σ 2 = Kf (ˆ yi − Kf (ˆ yi ))2 . (5.6)
2. Fitness value for spiral unit serves for the purpose of implementing evolution based on ranks of all the spiral units inside one sensor node, where the ranking is the determined by the respective fitness value. In particular, it is prerequisite for No.(1) and No.(3) evolutionary operations in section-5.2.5. As shown in eq-(5.7), fitness value is computed as the sum of the absolute gradient value of output w.r.t. associated hidden state vector of the k -th spiral unit, which indicates the importance of corresponding hidden-state vector. X ∂yt f˜c(k) = (5.7) (k) k ∈ [1, . . . , nunits ] ∂st � � (k) (k) ˜ ft = Kf fc (5.8)
(k) In the equation shown above, variable f˜c stands for the current estimation of fitness, function Kf again refers to the Kalman filter operation, yt represents the output (k) vector of SpiralRNN model at time step t, st is the hidden state vector in k-th spiral unit in question at time t, notation k and nunits follow chapter-3 and respectively refer to the index for hidden unit and the total number of spiral units in the SpiralRNN model.
3. Data stream also has its fitness value which describes the dependence of the SpiralRNN model of one sensor node on the respective data stream. One natural way is to measure the covariance between different data streams, which indicates how relevant is the neighbor data stream related to the measured data stream from sensor itself. Covariance of two variables X and Y can be calculated according to eq-(5.9), where
5.2 The Evolution Framework
101
X refers to the mean value of variable X. COV (X, Y ) = X − X (i)
�
Y −Y
�
(5.9)
Therefore, the fitness value of data stream yˆt is equal to the mean value of (i)
(i)
(m)
(ˆ yt − y¯t )(ˆ yt
(m)
− y¯t ),
∀i ∈ [1, d] and i 6= m,
where i is the index for the i -th data stream of the sensor in question, m (1 ≤ m ≤ d) (i) is the particular index of the data stream measured by sensor itself and y¯t is the (i) mean value of data stream yˆt . Calculation starts with the temporal variable fi† for each index i, where the normalization is taken in order to avoid the misleading when value of data stream relatively remains constant and calculation of σ is according to eq-(5.6). � � (i) (i) yˆt − Kf yt † , ∀i ∈ [1, d] fi = σi As two variables are regarded as irrelevant when the absolute value of covariance (i) is small, the current estimation of fitness is given as f˜c in eq-(5.10) with absolute operation and the fitness value takes the mean estimation by Kalman filter. † † (i) ˜ i 6= m (5.10) fc = fi fm � � (i) ft = Kf f˜c(i) i 6= m (5.11) As mentioned, in the calculation of fitness values, Kalman filter (Kf ) is heavily used in estimating the corresponding mean values of different variables. Since the subject of estimation in this case is the same subject of measurement and there is no dynamics evolution for the estimated variable, the update-and-measurement steps of Kalman filter in eq-(2.26) and eq-(2.27) are simplified as: xt = xt−1 + µt zt = xt + νt
(5.12) (5.13)
Looking for a stable result of estimation, the settings Qt = 10−8 and Rt ∼ N (0, 1) are taken and are fixed after initialized, and Pt is initialized with a random value taken from the normal distribution N (0, 1). For the relationship between variables Pt , Qt and Rt , more details can be found in section-2.2.3.
5.2.5
Evolutionary Operations
Within each sensor node, evolutionary operations will take a particular hidden unit or input nodes for data streams as genes for evolutionary operations. Implementation of these
102
5. Solutions for Distributed Sensor Networks
evolution operations, satisfying those constraints mentioned in section-5.2.2, modifies the structure of SpiralRNN in sensor nodes. The first three operations are related to the spiral unit and the last two operations concern on the data stream of SpiralRNN : (1) to remove a hidden unit. The choice of the spiral unit to be removed is determined by (k) the fitness value ft in eq-(5.7) of spiral units. The spiral unit with the least value in (k) ft will be chosen and be removed from the structure. Certainly, this operation will be bypassed when the embedded SpiralRNN model contains only one spiral unit. (2) to create and insert a new hidden unit. A new hidden unit can be created and inserted under the condition that such insertion will not cause the model complexity Cs exceeding the constraint limit. The structure of the new hidden unit, following the description in section-3.1.1, is similar to that of other hidden units but with randomized amount of hidden nodes. (3) to adopt a hidden unit from neighbor sensor. The procedure contains the following sequential steps (assuming the sensor in question is named sensor “A”): ① choose the neighbor sensor which has the best fitness value ft (ref. eq-(5.4)) in the neighborhood, and name it sensor “B”; (k)
② from the sensor “B”, choose the hidden unit with the best fitness value ft (ref. eq-(5.7)) under the condition of satisfying the complexity limit of sensor node; ③ merge the selected hidden unit from sensor “B” to sensor “A”; The new hidden unit in sensor “A” remains changed values of its hidden connections and the connections from common input nodes 31 to newly added hidden nodes. The other connection values will be initialized satisfying with the distribution N (0, 0.012). (i)
(4) to remove data stream. The data stream with smallest fitness value ft (ref. eq(5.10)) will be removed from the model. This causes the connections from all hidden nodes to the corresponding input node and output node being erased. Note this only removes the corresponding data stream from the learning model, the physical communication connection can be resumed whenever it is required. (5) to re-insert a data stream. Re-insertion of a data stream will re-introduce the selected data stream to the learning model. When there exist data streams being available for re-insertion (i.e. they were previously removed from the model, and current model (i) does not depend on this data stream), the eligible data stream with the strongest ft (ref. eq-(5.10)) fitness value32 will be selected and added as one of input data streams. 31
Sensor “A” has different combination of data streams as sensor “B”, whereas the intersection of the data streams between sensor “A” and “B” is corresponding to the common input nodes between them. (i) 32 Fitness value ft of removed data streams will be kept unchanged after the being removed from input layer.
5.2 The Evolution Framework
103
Those corresponding new connections are initialized with values ∼ N (0, 0.012). Note that, in order to avoid too much change in the model structure, only one of mentioned operations will be conducted at one time. Furthermore, the recover time trc also prevents two evolutionary operations from being implemented within a short time.
5.2.6
Evolution Framework in a Nutshell
Combining the aforementioned issues, table-5.2 has shown the pseudo-code for the proceeding of the evolution framework at one time step, which is corresponding to fig-5.4. choose the operation according to the probability values in P; estimate the proposed values of respective properties when the chosen operation was performed; if the proposed values against any constraint condition reject the chosen operation; else perform the selected evolutionary operation with the aid from the fitness values; reduce the corresponding probability value in P; end perform the normal on-line training operation; update the fitness values; update the probability values in P; Table 5.2: Pseudo code for the evolution framework. Being able to modify the structure of embedded model whereas a longer time is required to recover from the structure modification, the evolution framework is useful at least in: 1. the applications where sensors measure the dynamical environment properties such that modification of the embedded model is allowed. 2. the applications with dense sensor network and many sensors measuring the same variable such that redundant data prevail and occupy the communication brandwidth. 3. the sensor network applications emphasizing the long-term performance and able to endure deficits in short-term.
104
5. Solutions for Distributed Sensor Networks
Chapter 6 Simulations in Sensor Network Applications In this chapter, the spiral recurrent neural network (SpiralRNN ) model (ref. to chapter3) together with the duty-cycle reduction and evolution framework (ref. to chapter-5) are applied in simulations, where the task for the sensor network is to predict temperature values. In the following, settings for simulations are given first, and it is followed by the simulation results. At last, the discussion, focusing on the energy consumption and the maintenance of the prediction performance, is given. For simplicity, the term “communication energy” is employed referring the energy spent in communication; similarly, the term “computation energy” refers the energy involved in data processing.
6.1
Simulation Settings
Assume there is a field with a regular grid of 11 × 11. Four heat sources and ten sensor nodes are located randomly inside the grid field, but they are not overlapped each other. Each sensor node has one temperature measurement unit, one communication module and one processing unit where the SpiralRNN model is employed as the embedded learning model. Temperature values at positions of heat sources are dependent on the strength of heat source which obeys the dynamics shown in eq-(6.1) to eq-(6.4). Because of radiation and thermal conduction, heat energy diffuses from heat sources to their surrounding, such that the temperature in the domain is varying in terms of time and location. Sensor nodes are
106
6. Simulations in Sensor Network Applications
required to train their learning models for temperature prediction, meanwhile mitigate the energy consumption. Without explicit notification, one simulation consists of a training phase, which lasts for 5e3 time steps, and a prediction test phase, which lasts for 50 time steps. For statistic and generality reasons, simulations will be implemented 30 times, where in each simulation the arrangement of the network (sensor node position, communication topology etc.) as well as that of the heat source (source position, value of temperature etc.) will be changed at random. Heat source and temperature Totally there are four heat sources in the field, where their positions are randomly chosen from the grid points. Each heat source emits certain amount of heat energy into the surrounding. The amount of emitted heat energy is variant at different time such that the strength of heat sources has similar dynamics as the Lorenz equations: h˙ 1 h˙ 2 h˙ 3 h˙ 4
= = = =
16(h2 − h1 − h4 ) + h3 (40 − h3 )h1 − 0.5h2 h4 h1 h2 − 6h3 0.1h3 (h1 − h2 ) + 0.1h3
(6.1) (6.2) (6.3) (6.4)
where h˙ refers to the time derivative of h, h˙ i refers to the ith entry of h˙ and each entry of vector ~h indicates the temperature change at particular heat source with [0.1, 0.1, −0.1, −0.1] as the initial value of ~h. Starting with value T~0 = 0, temperatures at the heat sources can be calculated from eq-(6.5), where µ is the noise satisfying N (0, 0.012). For convenient reason, values of temperature T~ are scaled down by factor of 10, such that T~ value is within a reasonable range. Fig-6.1 illustrates the scenario data, where fig-6.1(a) and fig-6.1(b) respectively present the 3-D mesh plot and the contour plot of the temperature profile in the grid field at an instance, fig6.1(c) shows the heat sources’ temperatures which vary over time, and fig-6.1(d) gives examples of temperature over time that measured by sample sensor nodes.
T~t+1 = T~t + 0.01~h + µ
(6.5)
Diffusion With heat energy diffusing through the domain, the temperature at any position in the space has variant values at different time. To calculate the temperature of these grid-points, let uti,j represents the temperature at grid point (i, j) at time t. It is known that, at one position, the difference of heat energy at different time is proportional to the difference between the amount of energy flowing in and the amount of energy flowing outwards. Assuming this is a homogeneous domain, the
6.1 Simulation Settings
107
10 3
8
2
6
1 0 10
4 8
6
4
2
2
4
6
8
10
2
(a) mesh plot
2 4 6 8 10 (b) temperature contour
8 2.5
6
2
4
1.5 1
2 0.5
0 700
750
800
850
900
(c) heat sources’ temperature
0 2800
2900
3000
3100
3200
3300
(d) measured temperature
Figure 6.1:
Data example of heat diffusion simulations. (a) A 3-D wireframe mesh plot of the temperature in the grid. Note that the temperature surface is dynamically changing, and the plot only shows the temperature at one instance; (b) The corresponding contour plot of the temperature surface; (c) Temperature values of heat sources; (d) Measured temperature values from 4 sample sensor nodes.
aforementioned relation is also applicable to the temperature. Therefore, eq-(6.6) holds. t ut+1 uti−1,j + uti+1,j + uti,j−1 + uti,j+1 − 4uti,j i,j − ui,j = kd ∆t ∆x2
(6.6)
where constant kd is the diffusion coefficient depending on the materials involved, ∆t is the difference in time, ∆x is the distance between two grid-points and is identical for any two grid-points. Solve the above equation, such that: � � � kd ∆t kd ∆t t t t t t+1 u + ui+1,j + ui,j−1 + ui,j+1 + 1 − 4 uti,j ui,j = ∆x2 i−1,j ∆x2 u0i,j = 0
108
6. Simulations in Sensor Network Applications Note that, the temperature in the grid field is initialized as zeros. For simulation purpose, the following parametrization is taken: s=
kd ∆t = 0.15. ∆x2
(6.7)
~ be a vector listing temperature values of all grid-points one column after Let U ~ ∈ R121×1 because of the grid size 11 × 11. The numerical another, therefore U ~ t=0 . solution of the heat diffusion is realized by eq-(6.8), with the initial condition U ~ t+1 = sH U ~t + ν U
(6.8)
where ν ∼ N (0, 0.012) is Gaussian white noise, matrix H is a block-tridiagonal system with sub-block matrix A in the diagonal position and sub-block matrix Id in the off-diagonal position. The matrix A is further a tridiagonal matrix with value “−4” in diagonal entries and value “1” in off-diagonal entries, as shown in eq-(6.9). Matrix Id is the identity matrix which has the same size as matrix A. A Id −4 1 .. .. .. .. . . . . I 1 H= d . A = (6.9) . . . . . . . Id .. .. 1 Id A 121×121 1 −4 11×11 ~ t in eq-(6.8) represents the temperature vector for all grid points in Note that U the domain, including those grid points for heat sources and sensor nodes. As it is mentioned, temperature values at heat sources are solely determined by heat sources but not by diffusion. Eq-(6.10) is therefore applied. ~ t+1,Λ = T~t+1 U
(6.10)
~ t for those grid points where heat sources locate. where Λ is the set of indices in U ~ t corresponding to the sensor nodes position are the measured data of Entries in U sensor nodes, and are taken as training data for the learning model. Sensor Net Ten sensor nodes are randomly spread across the grid-field, and constitute a static connected non-directed network via wireless connections. Many researches [89, 90] have proposed methods for the automatic construction of ad hoc networks. For the purpose of simulation, a simple semi-self-organized version is employed here, and it contains the following steps: ① randomly distribute ten sensor nodes in the grid field; ② gradually increase the communication range of each sensor node;
6.1 Simulation Settings
109
③ once sensor A has found sensor B within its communication range, it will take sensor B as its neighbor sensor. The directed connection “A→B” is then established. ④ each sensor continues the process No.3 until its neighbor number has reached “3” ⑤ convert all these directed connections recognized in step No.3 to un-directed mappings, such that once sensor node A recognizes node B as its neighbor, node B will also take A as neighbor. ⑥ manually check whether the network as a whole is connected. If not, repeat from the first step. With this approach, one can obtain a reasonable connected network. Fig-6.2 gives an example. Depending on the distance between the sensor node with the heat sources and also on the strength of the nearby heat source, the variation of temperature values through time is different. It is shown in fig-6.1(d), as an example, that the temperature changes frequently at some location while the temperature at other locations is basically constant.
10
9 2
10 1
5
8
3 8
6 4
4 7
2 6
2
4
6
8
10
Figure 6.2: Sample topology of sensor network. Red stars shows where the heat sources locate; blue dots represent ten sensor nodes; the number aside sensor node shows the ID of respective sensor node; lines between two sensor nodes refer to established wireless connections between them.
Prediction model Within each sensor node, a SpiralRNN model is deployed for the purpose of signal processing as SpiralRNN models are proven to be efficient and stable for on-line training. The number of input neurons of the SpiralRNN model is initialized as the number of sensor nodes in its neighborhood (including the sensor itself), such that
110
6. Simulations in Sensor Network Applications the measurement data from each sensor node within the neighborhood is presented in the input layer of the SpiralRNN model, and apparently in the output layer as well. Note that, at any time instance, the number of input nodes must be identical to the number of output nodes, but the input number or output number can vary during the simulation because of the evolution. Fig-6.3 gives an example of such a structure. Parameters of the SpiralRNN model is configured mainly under the same way as described in section-4.1. The difference lies in that the number of hidden units and number of hidden nodes in each hidden unit will be randomly initialized, subject to the condition that the model complexity Cs (number of model parameters; ref. page45) should not exceed 80% of the maximum allowed complexity value. This maximum allowed complexity value depends on the particular requirements of application, and is set to 100 or 200 in corresponding simulations. B
data
A C
error
C B D E
training
Z −1
D
output
SpiralRNN
E (a) sensor net
(b) SpiralRNN in node-C
Figure 6.3: (a) An example of sensor network with 5 sensors, where sensor node “C” is connected to sensor nodes “B” “D” “E”; (b) The SpiralRNN model inside sensor node “C”. The SpiralRNN model is trained with data from all 4 sensors inside the neighborhood of sensor “C”. In the autonomous-test phase, only the output corresponding to its own measure data is considered.
Settings for evolution Referring to section-5.2, the evolution framework is guided by the value of P. Entries of P represent the occurrence probabilities of corresponding operations. The initial value of vector P is [0.8, 0.04, 0.04, 0.04, 0.04, 0.04], with the first entry corresponding to normal on-line training and the rest five entries corresponding to evolutionary operations (refer to section-5.2.5). In each training step, entry values for evolutionary operations in P slightly increase by 10−3 : Pi = Pi (1 + 10−3 ),
∀i ∈ [2, 6],
(6.11)
in order to gradually increase the possibility of evolutionary operations. Choice of operations at each training step is based on the vector P, a random value rd
6.1 Simulation Settings
111
(ref. section-5.2.1) and application constraints (ref. section-5.2.2). Once an evolutionary operation is selected and is implemented, its respective probability decreases by 20%, in order to avoid successive repetition of respective evolutionary operation. Parameters of application constraints (ref. section-5.2.2) are defined as following: values of nxds and nxrd are set to 4 in order to reduce the effort for computation and communication; values of nnds and nnrd are set to 2 in order to keep the efficiency of the embedded model and maintain the redundancy of measurement data of each senor node; for protection of novel structure, the recover time is set to trc = 200. The maximum complexity of embedded model in sensor node is set to Cs = 100 and Cs = 200 in different simulations, as will be mentioned later. Training No matter which operation is chosen based on the P value, the on-line training of model parameters is conducted, where parameter values are updated at each time step (Details of implementation of on-line training of the SpiralRNN can be found in section-3.2.2). Keeping the on-line training at every time step, the autonomous test starts at time step t = 5001, and ends at t = 5050. In each autonomous test, prediction is conducted for up to 15 steps, i.e. the model evolves itself 15 times (Details of autonomous test can be found in section-3.2.3). Evaluation Simulation evaluation focuses on the energy consumption as well as the prediction performance. Proposed criteria include: (1) logarithmic error evaluation on prediction (2) the amount of arithmetical operations np , the amount of transfer data nm and their respective variance; (3) the amount of consumed electric charge based on the specs of TelosB sensor node. (1) Performance evaluation of one sensor node focuses only on the prediction error (τ ) of its own measurement data. For example, let xt denotes the τ -step ahead (τ ) prediction at time step t, and xˆt the corresponding target. Note that both of them are vectors. Without loss of generality, let m be the index of its measurement data in the input, then the evaluation is based on the particular residual (τ ) (τ ) of m-th entries: xˆt (m) − xt (m). Given the value of standard deviation σ of sensor’s measurement data, the τ -step ahead prediction error at time t is given (τ ) by eq-(6.12). A mean value of εt is calculated for the results of 50 successive time steps from t = 5001 to t = 5050, as shown in eq-(6.13). The final prediction error of the entire sensor network is the respective average value of all sensors.
(τ )
εt
�
= log10 (τ )
ε(τ ) = εt
,
(τ ) xt (m)
−
(τ ) xˆt (m)
σ2
�2
t ∈ [5001, . . . , 5050]
,
τ = 1, 2, · · ·
(6.12) (6.13)
112
6. Simulations in Sensor Network Applications (2) The energy consumption is split into two parts: communication energy consumption and computation energy consumption. In real-world applications, the actual amount of consumed energy is related to the way how data processing and communication are handled. For example, as a shared medium network, sensor nodes transfer data according to channel access methods such as time division multiple access (TDMA). Generally speaking, a time frame under TDMA is divided into time slots of even interval, where each time slot is occupied by one of the sensor nodes to transfer data meanwhile other neighbor sensor nodes are switched to listening mode. The energy consumption is therefore related to the length of each time slot and the amount of time slots during which the sensor radio is activated. However, for the sake of simplicity, evaluation of energy consumption in the simulation is based on the amount of arithmetic operations and the amount of communicate data, as stated in the following. Note that all these values are calculated in the training phase of one run (i.e. one simulation that takes 5000 time steps) • (nm ) The total amount of communication data of one sensor node during the training in one simulation. The value of nm considers both of the data being sent out and received, indicating the amount of energy spent in communication. • (np ) The total amount of arithmetic operations in training for one sensor node in one simulation. • (vm ) The variance of sensors’ nm values in one simulation, indicating the imbalance of communication energy consumption in the sensor network; • (vp ) The variance of sensors’ np values in one simulation, indicating the imbalance of computational energy consumption in the sensor network. The values of nm and np focus on the total energy of one sensor which have been consumed during the simulation, whilst the evaluation of vm and vp indicate the early depletion of sensor network in the case where one or couple of sensor nodes have run out of power much earlier than the others. (3) With the estimated values of nm and np , one can roughly estimate the energy which has been used in the simulations. Recalling the specification of TelosB sensor mote in chapter-2, the working current of device is 1.8mA when the 16-bit micro-controller MSP430 works on summit frequency of 8MHz. The amount of electric charge spent on np amount of arithmetic operation can be calculated as in eq-(6.14), where the unit “mAh” stands for milli-Amp hour, and 3600 reflects that one hour has 3600 seconds. np 1 × × 1.8 (mA) = 6.25 × 10⁻¹¹ np (mAh) 6 8 × 10 3600
(6.14)
With the activation of radio, working current of sensor rises to 21.8mA for receiving data and 19.5 for data transfer. For the sake of simplicity, it is assumed
6.2 Simulation Results
113
that the working current value equals 20mA in both receiving and sending operations. The radio bandwidth of TelosB is up to 250kbps. Each packet in communication between sensors should contain at least three entries - the measurement data itself, the ID of the sensor from which the data are sent and the time step when the measurement was made. Therefore, omitting overheads, communication of one piece of measurement data is actually required to transfer at least three piece of data. One can use eq-(6.15) to calculate the electric charge spent on data communication. 3 × 16 ×
nm 1 × × 20 (mA) = 1.067 × 10⁻⁶ nm (mAh) 3 250 × 10 3600
(6.15)
where value “16” is corresponding to the 16-bit operation of TelosB mote. Eq-(6.14) and eq-(6.15) will be employed in calculation of energy spending in the discussion about early depletion in section-6.3.3. Simulation in a nutshell Summarizing all the mentioned concepts, the simulation is implemented with the following steps: ① Construct a sensor network with sensor nodes and communication connections; ② Prepare the temperature profile of heat sources with aid from eq-(6.1) to eq(6.5); ③ Complete the temperature profile of the entire domain by eq-(6.8) and eq-(6.10); ~ , extract the corresponding entries as sensor nodes’ measurement data, ④ From U which will be the training data of embedded learning models; ⑤ Initialize the embedded SpiralRNN models of all sensor nodes; ⑥ Implement the on-line training of the SpiralRNN model with measurement data for 5e3 time steps; The duty-cycle reduction and evolution framework are applied; ⑦ Conduct data prediction for 50 time steps. ⑧ Assess the prediction performance and the energy consumption.
6.2
Simulation Results
Simulations are conducted under the guidance given in chapter-5 and the settings of simulation in section-6.1. In the first comparison, the effects of the evolution framework (EF) and duty-cycle reduction (DCi) are emphasized by comparing with the so-called “normal” scheme. In the second demonstration, the impact of different activity period Ap values (ref. section-5.1) is addressed.
114
6. Simulations in Sensor Network Applications
Note that the sensor network setting (including the position and topology of sensor nodes, and the temperature profile in the space) is different in each of 30 runs, and, in each run, the same setting is applied to different competing schemes. The maximum model complexity Cs determines the size of the model when it is initialized, whereas the actual value of model complexity is varying in schemes with the evolution framework.
6.2.1
Simulation 1
As the first experiment, several operation schemes are compared. They include: ① An “EF” scheme refers to the scheme using the evolution framework to modify the SpiralRNN structure; ② In a “DC2” scheme, the duty-cycle reduction is implemented with the activity period value Ap = 2; ③ An “EF+DC2” scheme combines “EF” and “DC2” schemes together; ④ In the “normal” scheme, both evolution framework and duty-cycle reduction are not applied but only the normal on-line training of model parameters is implemented. Table-6.1 has listed the prediction performance of these schemes, where the maximum complexity of the SpiralRNN is set to 100, i.e. Cs = 100. The result has indicated that the “normal” scheme does outperform the other schemes in terms of prediction performance. The advantage of the “normal” scheme has been expected, because it enjoys the stability in structure and keeps the access to the measurement data of its neighbors all the time. But such advantage is not significant, if the standard deviation values of prediction errors are taken into account. Fig-6.4 depicts the comparisons of aforementioned schemes in terms of 1st -step to 15th -step prediction. The extended bar coming from the curve of “normal” scheme refers to the standard deviation of prediction error in “normal” scheme. It has been shown that the difference between the “normal” scheme and other schemes is not significant, at least for short-term prediction. Evaluating the energy consumption, fig-6.5(a)(b) illustrate the average amount of arithmetic operation per sensor node per simulation (np ) and the average amount of communication data per sensor node per simulation (nm ); fig-6.5(c)(d) report their corresponding variance (the variance value among all sensor nodes in the network) values vp and vm . As shown in fig-6.5(a)(c), applying the evolution framework has helped the “EF” scheme and the “EF+DC2” scheme to gain the advantage in saving the computation energy, meanwhile the computation energy consumption among sensor nodes are more balanced, as with lower value in vp . On the other hand, the communication energy can be reduced and balanced by employing the duty-cycle reduction as manifested in fig-6.5(b)(d), where in the
6.2 Simulation Results
115
ε(1) ε(5) ε(10) ε(15) mean std. mean std. mean std. mean std. normal -1.80 0.32 -1.40 0.27 -1.03 0.24 -0.78 0.24 EF -1.74 0.30 -1.24 0.22 -0.84 0.19 -0.61 0.17 DC2 -1.75 0.28 -1.29 0.20 -0.90 0.19 -0.66 0.20 EF+DC2 -1.73 0.29 -1.19 0.22 -0.80 0.20 -0.58 0.20 Table 6.1: Predictive error ε(τ ) (τ ∈ [1, 5, 10, 15]) of different schemes (“normal”, “EF”, “DC2” and “EF+DC2” schemes). The maximum model complexity is set to Cs ≃ 100. All ε(τ ) values are on a logarithmic scale.
logarithmic prediction error −0.6 −0.8 −1 −1.2 −1.4 −1.6 normal EF DC2 EF+DC2
−1.8 −2 −2.2 0
5
10
15
20
Figure 6.4: Comparison in prediction error ε(τ ) (τ ∈ [1, . . . , 15]) of different schemes (“normal”, “EF”, “DC2” and “EF+DC2” schemes). The maximum model complexity is set to Cs = 100. The X-axis stands for prediction step, and the Y-axis refers to the logarithmic prediction error value. Length of the extended bar represents the value of standard deviation of prediction error of the “normal” scheme.
“DC2” scheme sensor nodes have saved 50% of energy in communication comparing with the “normal” scheme.
Increasing the maximum complexity Cs of the embedded SpiralRNN model to Cs = 200, similar results are reported in fig-6.6 and table-6.2, namely that the evolution framework and duty-cycle reduction respectively help to reduce the arithmetic operation effort and the communication effort.
116
6. Simulations in Sensor Network Applications 7
2.5
x 10
computation cost (# operations)
communication cost (# transferred data) 2500
17
3
x 10
variance of # arithmetic operations
8
8
x 10
variance of # communication cost
7 2.5
2
6
2000
1.5
2
5
1.5
4
1500
1
3
1000
1
2 0.5
0
500
normal
EF
DC2
EF+DC2
0
(a) np
0.5
normal
EF
DC2
(b) nm
EF+DC2
0
1 normal
EF
DC2
(c) vp
EF+DC2
0
normal
EF
DC2
EF+DC2
(d) vm
Figure 6.5:
Comparisons on the computation cost np (average amount of arithmetic operations per sensor node) and the communication cost nm (average amount of communication data per sensor node) of different schemes, as well as their respective variance values. The maximum model complexity is Cs ≃ 100. (a) average np value in the network; (b) average nm value in the network; (c) variance vp of np in the network; (d) variance vm of nm in the network.
ε(1) ε(5) ε(10) ε(15) mean std. mean std. mean std. mean std. normal -1.85 0.32 -1.51 0.29 -1.17 0.25 -0.94 0.25 EF -1.78 0.32 -1.31 0.26 -0.90 0.24 -0.65 0.22 DC2 -1.82 0.31 -1.44 0.25 -1.08 0.25 -0.84 0.24 EF+DC2 -1.78 0.33 -1.28 0.26 -0.88 0.25 -0.65 0.23 Table 6.2: Predictive error ε(τ ) (τ ∈ [1, 5, 10, 15]) of different schemes (“normal”, “EF”, “DC2” and “EF+DC2” schemes). The maximum model complexity is set to Cs = 200 All values of ε(τ ) are on a logarithmic scale.
6.2.2
Simulation 2
From the previous section, it is shown that the implementation of the duty-cycle reduction reduces the communication effort, and that implementation of the evolution framework scheme helps reducing the complexity of learning model. Combining both methods as “EF+DC2”, one could obtain a better solution in terms of both nm and np values. The comparison results with different sizes of the learning model are given in fig-6.5 and Table6.1 for the Cs = 100 case, in fig-6.6 and Table-6.2 for the Cs = 200 case. However, “EF+DC2” scheme didn’t provide an outstanding advantage in communication energy consumption. This is so because the evolution framework inherently requires communication effort to obtain necessary information. On the other hand, the evolution framework is beneficial to minimizing the computational effort as well as to adapting the learning model to changing environment. It is therefore necessary, particularly in complicated applications which require intensive data processing. In order to obtain the advantage both
6.3 Discussion 7
10
x 10
117 18
computation cost (# operations)
communication cost (# transferred data)
6
x 10
variance of # arithmetic operations
8
10
2500
x 10
variance of # communication cost
5 8
8
2000
4 6
6
1500
3 4
2
0
4
1000
2
500
normal
EF
DC2
EF+DC2
(a) np
0
2
1
normal
EF
DC2
(b) nm
EF+DC2
0
normal
EF
DC2
(c) vp
EF+DC2
0
normal
EF
DC2
EF+DC2
(d) vm
Figure 6.6: Comparisons on the computation cost np (amount of arithmetic operations per sensor node) and the communication cost nm (amount of communication data per sensor node) of different schemes and their respective variances. The maximum model complexity is Cs = 200. (a) average np value in the network; (b) average nm value in the network; (c) variance vp of np in the network; (d) variance vm of nm in the network.
in data processing and in communication, one straight-forward solution is to combine the duty-cycle reduction with the evolution framework, and meanwhile further increase the activity period value in duty-cycle reduction in order to achieve higher efficiency in energy spent on communication. Let “EF+DCi” indicates the scheme with i being the value of activity period Ap . For example, in “EF+DC3” scheme, sensor radio will be switched to the listening mode once in every three working cycles. Following simulations are conducted with “EF+DCi” schemes with different Ap values. The results in table-6.3 compares the average prediction performance ε(τ ) of sensors, where complexity of the embedded learning model is set to Cs = 100. It is shown that the performance difference between different schemes in “EF+DCi” series is small in short-term prediction, even though the difference slightly expands when the prediction-step increases. While the increase in Ap value deteriorates the prediction performance to some extent, it helps to reduce the energy consumption in communication. This is manifested in fig6.7(b)(d). As expected, computational effort is reduced due to the application of the evolution framework, which is proven in fig-6.7(a)(c). Simulation results corresponding to model complexity Cs = 200 are given in fig-6.8, and table-6.4. They have all reported the similar result as discussed above.
6.3
Discussion
Based on the simulation results in previous section, some important issues in distributed sensor network applications will be addressed in the coming text. The discussion focuses
118
6. Simulations in Sensor Network Applications
EF+DC2 EF+DC3 EF+DC4 EF+DC5 EF+DC6
ε(1) ε(5) ε(10) ε(15) mean std. mean std. mean std. mean std. -1.73 0.29 -1.19 0.22 -0.80 0.20 -0.58 0.20 -1.64 0.31 -1.06 0.24 -0.69 0.22 -0.48 0.22 -1.61 0.26 -1.05 0.20 -0.67 0.19 -0.45 0.19 -1.65 0.29 -1.05 0.19 -0.66 0.20 -0.45 0.21 -1.64 0.30 -1.04 0.23 -0.64 0.22 -0.42 0.24
Comparisons of predictive error ε(τ ) (τ ∈ [1, 5, 10, 15]) in “EF+DCi” series scheme. The maximum model complexity is set to Cs ≃ 100 Note that values of ε(τ ) are on a logarithmic scale.
Table 6.3:
7
2.5
x 10
computation cost (# operations)
communication cost (byte) 1400
2
17
3
1200
2.5
1000
2
x 10
16
x 10
variance of # communication cost
14 12
1.5
800
10 8
1.5
600
1
6
1 400
4
0.5
0.5
200
0
7
variance of # arithmetic operations
normal
EF+DC2 EF+DC4 EF+DC6
(a) np
0
normal
EF+DC2 EF+DC4 EF+DC6
(b) nm
0
2 normal
EF+DC2 EF+DC4 EF+DC6
(c) vp
0
normal
EF+DC2 EF+DC4 EF+DC6
(d) vm
Figure 6.7: Comparisons of np and nm between the “EF+DCi” series and the “normal” scheme and their respective variance. The maximum model complexity is set as Cs ≃ 100. (a) Mean of sensors’ np values in the network; (b) mean of sensors’ nm values in the network; (c) variance of different sensors’ np values in the network; (d) variance of different sensors’ nm values in the network.
EF+DC2 EF+DC3 EF+DC4 EF+DC5 EF+DC6
ε(1) ε(5) ε(10) ε(15) mean std. mean std. mean std. mean std. -1.78 0.33 -1.28 0.26 -0.88 0.25 -0.65 0.23 -1.73 0.30 -1.20 0.20 -0.81 0.17 -0.58 0.17 -1.63 0.29 -1.10 0.25 -0.70 0.27 -0.47 0.27 -1.66 0.28 -1.11 0.20 -0.69 0.22 -0.48 0.24 -1.65 0.31 -1.10 0.23 -0.70 0.23 -0.48 0.24
Comparisons of predictive error ε(τ ) (τ ∈ [1, 5, 10, 15]) in “EF+DCi” series scheme. The maximum model complexity is set to Cs ≃ 200. Note that values of ε(τ ) are on a logarithmic scale.
Table 6.4:
on the prediction performance of sensor model, the energy consumption in general, and the early depletion problem.
6.3 Discussion 7
10
x 10
119 18
computation cost (# operations)
communication cost (byte)
6
x 10
variance of # arithmetic operations
variance of # communication cost
2
4
1000
6
1.5
800
3
600
4
x 10
5
1200
8
8
2.5
1400
1
2 400
2
0
normal
EF+DC2 EF+DC4 EF+DC6
(a) np
0
0.5
1
200 normal
EF+DC2 EF+DC4 EF+DC6
(b) nm
0
normal
EF+DC2 EF+DC4 EF+DC6
(c) vp
0
normal
EF+DC2 EF+DC4 EF+DC6
(d) vm
Figure 6.8: Comparisons of np and nm between the “EF+DCi” series and the “normal” scheme and their respective variance. The maximum model complexity is set as Cs ≃ 200 (a) Mean of sensors’ np values in the network; (b) mean of sensors’ nm values in the network; (c) variance of different sensors’ np values in the network; (d) variance of different sensors’ nm values in the network.
6.3.1
Prediction Performance
Considering the prediction performance, the “normal” scheme without evolution framework and duty-cycle reduction has shown its strength by producing a lower prediction error ε. Depending on particular application requirement, such a difference is not significant, at least not for short-term prediction. This can be confirmed by the comparison of the normalized root mean square error (normalized RMSE) between the DC2 scheme and the “normal” scheme on different prediction steps as shown in fig-6.9. The normalized RMSE is calculated by taking the square root value of the prediction error which is calculated similar to the value of ε(τ ) in eq-(6.12) and eq-(6.13) but without the “log10 ” calculation. Positions of two curves in fig-6.9 are slight shifted for sake of clearness. Each curve shows the respective mean value of the normalized RMSE as well as the respective maximum (upper bar) and minimum (lower bar) normalized RMSE values among the 30 simulations. It is shown, that the normalized RMSE values of these two schemes are very closed all the time, but there exists outliers in both schemes whereas the outliers have imposed more damage in longer-term prediction in DC2 scheme because the lack of half of training data in the DC2 scheme.
Comparably, “DC2” scheme has shown a better result than the “EF” scheme, particularly with the increase of complexity Cs of the embedded model (refer table-6.1 and table-6.2). This is due to the fact that the “EF” scheme which will require a certain amount of time in order to recover.
120
6. Simulations in Sensor Network Applications 6
prediction error
5
normal DC2
4 3 2 1 0 0
5 10 prediction step
15
Figure 6.9: Comparison of the normalized root mean square error between DC2 and the “normal” schemes on different prediction steps. Positions of two plots are slight shifted for sake of clearness. Each plot shows the mean normalized error as well as the maximum (upper bar) and minimum (lower bar) normalized error among the 30 simulations with one of the schemes.
6.3.2
Energy Consumption
Results from the previous section have shown clearly that schemes using the evolution framework have an advantage in reducing arithmetic operations, and that schemes using duty-cycle reduction mitigate the effort for communication, though not for arithmetic operations. Duty-cycle reduction With the duty-cycle reduction, sensor nodes do not need to listen to their neighbors in every working cycle (even though they are still required to turn on the radio for sending out their own measurement data). Therefore, the number of communication time slots during when the radio is on has been reduced from k + 1 to 1, where k is number of one sensor’s neighbors. Thus, in the “DC2” scheme where sensor nodes need to listen to their neighbor once in two working cycles, the reduction rate rk of energy spent on communication for sensor node with k neighbors is calculated in eq-(6.16) [87]. � � 2+k rk = 1− × 100% (6.16) 2(1 + k) lim rk = 50% k→∞
Such calculation can be generalized for other “DCi” schemes as in eq-(6.17), with i indicating the activity period Ap value. The limit value of ri,k implies that the
6.3 Discussion
121
communication-energy consumption in “DCi” scheme reduces to 1i of the amount in the “normal” scheme. � � (i − 1) + (1 + k) × 100% ri,k = 1− i(1 + k) � �� � 1 1 = 1− 1− × 100% (6.17) i 1+k � � 1 × 100% lim ri,k = 1− k→∞ i Fig-6.10(a) illustrates the increase of the reduction rate with the rise in the neighbor number. For a sensor network with a connection degree33 of 6, the duty-cycle reduction can save the communication effort by more than 40%. It is also observed that the gap between “DC2” and “DC3” is bigger than the difference between “DC3” and “DC4”, and so on, which indicates the diminishing marginal utility of activity period Ap value. This can be explained by the variable fmu defined in eq-(6.18), which assesses the ratio of between the increment in reduction rate and the current reduction rate. The ratio fmu of increment decreases when the activity period Ap increases. Note that the fmu value is independent from the neighbor number k, and that i refers to the activity period Ap value. fmu (i) =
ri,k − ri−1,k 1 = , ri−1,k i(i − 2)
i = 3, · · ·
(6.18)
The distribution of fmu given in fig-6.10(b) shows how much proportion of communication energy has been saved by increasing the value of activity period Ap by one. The value decreases from 33% at i = 3 to 12% at i = 4, and further falls down to less than 5% from i = 6. Even though the reduction rate is growing when Ap value increases, the gain from the increase of Ap value is getting smaller. Furthermore, the increase in Ap value implies that the embedded model has been trained by less genuine data than before, which will deteriorate the prediction performance. Therefore, one needs to compromise between a higher reduction rate in energy consumption and a better prediction performance. However, this is apparently depending on the particular application. Evolution framework Compared to the “normal” scheme, the evolution framework has saved the computation effort (np value) respectively by 50% (ref. fig-6.5) and by 40% (ref. fig-6.6). On the other hand, the amounts of communication data (nm value) of the “EF” scheme indicate that the scheme is more expensive in communication. However, the disadvantage of evolution framework has been exaggerated, because: 33
The “magic number” to keep the connectivity of a radio network is six [91].
122
6. Simulations in Sensor Network Applications diminishing marginal utility
reduction rate of duty cycle
60 DC2 DC3 DC4 DC5 DC6
50 40 30 20 0
marginal utility (%)
(%)
70
reduction rate
80
5
10 15 20 # of neighbors
(a) reduction rate
25
30
30
20
10
0
3 4 5 6 7 8 9 10 11 12 13 14 15 i
(b) marginal utility of Ap (i value)
Figure 6.10:
(a) Reduction rates of “DCi” schemes versus the number of neighbors. (b) The diminishing marginal utility of activity period Ap .
① The data required by evolutionary operations can be received together with measurement value from the same neighbor sensor. ② Particular in TDMA channel access method, the number of sensor’s neighbors is the primary factor that determines the duration of time slots for receiving, which in fact affects the energy consumption. Thus, the energy consumption for communication in the “EF” scheme has been overestimated, even though the amount of transferred data in the “EF” scheme is indeed higher than that of the “normal” scheme. Furthermore, the occurrence of evolutionary operations decreases when evolution framework gradually alters the model structure. The energy consumption spent in transferring data, which is necessary for evolutionary operations, is therefore shrinking along with the occurrence frequency. Fig-6.11 shows the convergence of model structure by illustrating the probability of evolution-operations occurrence per sensor node. The X-axis refers to the training time step, and the Y-axis stands for the average (over a time window of length 200 time steps) percentage of evolution-operations occurrence per sensor node in “EF+DC6” scheme. The decrease in probability manifests the convergence of embedded model of sensors. Note that the value of recover time (ref. page-98) is set to trc = 200, thus the upper limit of the average probability, that one sensor conducts evolutionary operation at one time step, is equal to 0.5%. On the contrary, the evolution framework can be beneficial to reduction of communication by removing34 irrelevant data streams. With the evolution framework changing the dependency of model, the amount of model inputs can be altered. Fig6.12, shows the histogram (over 30 simulations) of the average amount of model inputs per sensor node after 5000 training step. The X-axis presents the average 34
The removal of irrelevant data stream is motivated by the fact that some neighbor data is not important for the prediction of its own measurement data. See to fig-6.1(d).
123
occurrence percentage (%)
6.3 Discussion
0.25 0.2 0.15 0.1 0.05 0 0
5000 10000 time step
15000
Figure 6.11:
The occurrence probability of evolution operations. The Xaxis represents the training time step; the Y-axis refers to probability that evolutionary operation is conducted in sensor at one time step. Each value is calculated as the average within a time window of length 200.
number of input neurons per sensor node, the Y-axis indicates the occurrence among 30 simulations. The higher amount of model inputs of sensor node is, the more communication effort is required to fetch measurement data. For the “normal” scheme which doesn’t have evolution operation, the average amount of model inputs is about 4.8; the counterpart value for the other schemes with evolution framework is about 2.5. The ratio of communication activities is calculated as: 2.5 − 1 × 100% = 39.47% 4.8 − 1 This ratio means that, at the end of the simulation (after 5000 training steps), each sensor with evolution framework has its communication activities reduced35 by 60%, and it implies that sensor with the evolution framework is able to mitigate the energy spent on communication in a long-run.
6.3.3
Early Depletion
Figures including fig-6.5, fig-6.6, fig-6.7 and fig-6.8 have illustrated the statistic characters of distribution of energy consumption in sensor network. The higher the values of vp and vm are, the more difference exists in the energy consumption among different sensors, and this will lead to early depletion of network since a sensor with higher energy consumption will run out of battery energy earlier and make the network disconnected. Fig-6.7(c)(d) 35
The implementation of evolution framework does require additional administrative data from neighbors. But as discussed, such additional effort has been exaggerated.
124
6. Simulations in Sensor Network Applications 12
12
12
12
10
10
10
10
8
8
8
8
6
6
6
6
4
4
4
4
2
2
2
2
0 2
0 2
0 2
3
4
5
6
(a) “normal”
3
4
5
6
(b) “EF+DC2”
3
4
5
6
0 2
(c) “EF+DC4”
3
4
5
6
(d) “EF+DC6”
Figure 6.12: Histogram (over 30 simulations) of average amount of model inputs per sensor node. The X-axis presents the average amount, and the Yaxis indicates the corresponding occurrences. Simulations last 5000 training steps, and the maximum model complexity is set to Cs = 100.
and fig-6.8(c)(d) have shown the evidence of the advantage of “EF+DCi” schemes over “normal” scheme in terms of avoiding early depletion. In another way, energy consumption during the training phase of one simulation is estimated by applying eq-(6.14) and eq-(6.15). Fig-6.13 depicts histograms (over 30 simulations) of the maximum communication-energy consumption in one sensor. Fig-6.14 shows similar histograms about the energy consumption in computation. The X-axis, in“mAh” units, refers to the maximum amount Mchar of electric charge consumed by all sensor nodes in the network; the Y-axis shows the respective occurrences. The smaller the value of Mchar is, the less energy has been spent, and the longer life-time of sensor node will be. 14
14
14
14
12
12
12
12
10
10
10
10
8
8
8
8
6
6
6
6
4
4
4
4
2
2
2
0
0.02
0.04
0.06
0.08
(a) “normal”
0.1
0
0.02
0.04
0.06
0.08
(b) “EF+DC2”
0.1
0
2 0.02
0.04
0.06
0.08
(c) “EF+DC4”
0.1
0
0.02
0.04
0.06
0.08
0.1
(d) “EF+DC6”
Figure 6.13: Histogram (over 30 simulations) of the maximum value (over all sensors in the network) of communication-energy consumption. The X-axis, in “mAh” unit, refers to the maximum amount Mchar of consumed electric charge in one simulation; the Y-axis shows the respective occurrences. It is manifested in fig-6.13 and fig-6.14 that the maximum energy consumption, in communication and computation respectively, spent in “EF+DCi” schemes is much less than the consumption in the “normal” scheme. In addition, as shown in fig-6.13, scheme “EF+DC6” delivers better and stable result in communication-energy consumption than the “EF+DC4” and “EF+DC2” schemes. This confirms the contribution of activity period Ap on communication-energy saving. In fig-6.14, since the evolution framework is the
6.3 Discussion
125
25
25
25
25
20
20
20
20
15
15
15
15
10
10
10
10
5
5
5
5
0 0
0.1
0.2
(a) “normal”
0.3
0 0
0.1
0.2
0.3
(b) “EF+DC2”
0 0
0.1
0.2
0.3
(c) “EF+DC4”
0 0
0.1
0.2
0.3
(d) “EF+DC6”
Figure 6.14: Histogram (over 30 simulations) of the maximum value (over all sensors in the network) of computation-energy consumption. The X-axis, in “mAh” unit, refers to the maximum amount Mchar of consumed electric charge in one simulation; the Y-axis shows the respective occurrences.
primary factor reducing the computation effort, “EF+DCi” schemes have shown energy saving by factor of 40% comparing with the “normal” scheme.
126
6. Simulations in Sensor Network Applications
Chapter 7 Summary and Conclusion Distributed sensor networks built from “smart sensors” help to change the way humanbeing experience the physical world. “Smart sensors” have this name because of their abilities of data processing and wireless communication, even though these abilities are small compared to the average personal computer. Here more important, often these “smart sensors” have irreplaceable batteries, due to application requirements of autonomy and autarky as well as manufacture reasons. Such “smart sensors” are often employed in diagnosis and control tasks, but in fulfilling such tasks they occasionally have to predict environment data and present the result in lieu of genuine information. Prediction is successful if the learning model, embedded in the sensor node, is stable and efficient enough to learn the dynamics on-line and from scratch, furthermore if the sensor nodes can communicate with each other, so that information required for building the learning model can be obtained also from neighbors. Realization of these assumptions is costly because (1) much computation is necessary for successfully training a learning model, and (2) frequent communication extends the sensor node’s duty cycle, thus reducing battery life. Sensor network application is therefore a compromise between prediction performance and energy consumption. Contributions Instead of improving communication protocol and network routing, the usual solution in such cases, this thesis proposes using an efficient embedded learning model and special operation schemes. These issues are addressed from two viewpoints, namely intra-node and inter-node solutions. • The intra-node viewpoint focuses on duty-cycle reduction, replacing data transfer by data prediction with the aim of reducing costly communication. The implementation of the duty-cycle reduction can save energy by more than 40% when network’s connectivity is more than 5. This duty-cycle reduction is a success if an embedded model can be found which learns efficiently and stably from
128
7. Summary and Conclusion scratch, and which implements a precise prediction of the measurement data. A novel neural network structure, the spiral recurrent neural network (SpiralRNN ), is such a model. SpiralRNN differs from conventional recurrent neural networks in the special structure of its hidden layer which possesses a trainable but structurally constrained recurrent layer, guaranteeing a bounded eigenvalue spectrum. Simulations of time series prediction have shown the efficiency and stability of the SpiralRNN model, which created the impulse for implementing the duty-cycle reduction scheme. • The inter-node viewpoint focuses on the exchange of information among sensors in the neighborhood. The search for an embedded learning model had to be conducted in a systematic way, and for this we introduced the heuristic evolution framework, which is able to exchange information and modify the structure and parameters of the SpiralRNN model under the application constraints. The evolution framework is also able to dilute the communication pressure by changing the model’s dependency on neighbor measurement, and omitting the communication effort for “unimportant” measurements. Depending on applications, this approach reduces the communication activity by 60% at long-run, and saves computation energy by more than 40%.
Achievements We have implemented the SpiralRNN model in several simulations of time series prediction problems, comparing the SpiralRNN model with conventional neural network models such as a time delayed neural network, an echo state neural network, a simple recurrent net and a block-diagonal recurrent neural network. In all of those, the SpiralRNN model has been of excellent prediction performance. Equally, its stability has been demonstrated in simulations with benchmark time series including spike time series with period 21, Mackey-Glass time series and Lorenz time series. Particularly in the experiments with spike time series, the SpiralRNN model has shown its ability to store the temporal information with dependency on time longer than the size of its hidden layer. We have assessed the relationship between the short-term memory Mst and the number of hidden nodes Nh of a SpiralRNN model, which satisfy: Mst ≃ 16.8(Nh − 2.0)0.42 . We have tested the SpiralRNN model in the physical world by implementing MouseTracking, a toy software which analyzes the movements of a “mouse” device controlled by a human user. It has been shown that the SpiralRNN model was able to reproduce a figure-of-8 trajectory, which in general requires a learning model with substantial short-term memory.
The conditional prediction ability of the SpiralRNN model has been examined in a simulation of a warehouse logistics management scenario. It has been shown that the SpiralRNN model can simultaneously retain different dynamic models within the learning model and recall them when the sensor triggers unique information for various dynamics. Based on the simulations of conditional prediction, we also
129 measured the associated memory Ma of SpiralRNN. The results have shown linearity with the number of hidden nodes Nh such that Ma ≃ 0.31Nh for longer pattern (lp = 11) and Ma ≃ 0.64Nh for shorter pattern (lp = 5), and both results are superior to that of the Hopfield network. The prediction capability and special structure of the SpiralRNN model has encouraged the implementation of duty-cycle reduction and evolution framework in sensor network applications. We have simulated a heat diffusion scenario with sensor nodes spread out in a grid for predicting the temperature. Duty-cycle reduction and the evolution framework have been employed in a simulation where their impact on energy saving and on prediction performance was investigated. It was confirmed that duty-cycle reduction reduced the communication effort by replacing transferred data by predicted data from the sensor itself, and that the evolution framework scheme simplified the structure of the learning model by evolutionary operations, and with considerable confidence removed some “unimportant” input from the model, and hence saved energy on computation as well as on communication. Conclusion The novel SpiralRNN model has shown excellent prediction performance and stability. This formed the basis for the implementation of the duty-cycle reduction which curtails the communication effort, and the evolution framework, which mainly simplifies the computation. Both approaches aim to reduce the energy consumption of a sensor network at the expense of prediction performance, where the latter proved insignificant due to the effectiveness of the SpiralRNN model. The combination of duty-cycle reduction and the evolution framework, based on the learning model SpiralRNN and balancing performance against energy consumption, is therefore of great value in applications of sensor networks.
130
7. Summary and Conclusion
Appendix A Eigenvalue Spectrum of SpiralRNN s A.1
Preliminaries
Lemma 1 Given value nhnu ∈ N+ and a nonsingular matrix A ∈ Rnhnu ×nhnu and matrix DA ∈ Rnhnu ×nhnu as its canonical form, i.e. the diagonal matrix with eigenvalues {λ1 , λ2 , · · · , λnhnu } of A on the main diagonal, also given matrix PA = [~p1 , p~2 , · · · , ~pnhnu ] ∈ Rnhnu ×nhnu where columns of PA are the unit eigenvectors of matrix A, then the eq-(A.1) holds. Matrix PA is named the modal matrix of A, and matrix DA is named the spectral matrix of A. A = PA DA PA−1
(A.1)
Lemma 2 Given matrix A, PA , DA ∈ Rnhnu ×nhnu as defined in Lemma-1, the eq-(A.4) shows: (1) the modal matrix of exponential matrix Ak is identical with the modal matrix of matrix A; (2) the spectral matrix of exponential matrix Ak can be obtained by implementing an exponential function on the spectral matrix of matrix A. Ak = PA DA PA−1 · PA DA PA−1 · PA DA PA−1 · · · PA DA PA−1 | {z }
(A.2)
k
= PA DA · DA · DA · · · DA PA−1 | {z }
(A.3)
k
=
k −1 P A DA PA
(A.4)
Lemma 3 Given β ∈ R, and matrix A ∈ Rnhnu ×nhnu with its modal matrix PA and respective spectral matrix DA , a matrix B = βA will have the modal matrix PB and the spectral matrix DB , such that: PB = PA DB = βDA
132
A. Eigenvalue Spectrum of SpiralRNN s
Proof According to Lemma-1, it holds A = PA DA PA−1 , and B = βA = βPA DA PA−1 = PA βDA PA−1 ∴ BPA = PA (βDA ) since matrix A’s modal matrix PA is an orthogonal matrix and matrix DB = βDA is a diagonal matrix like DA , therefore matrix B’s modal matrix PB = PA and B’s spectral matrix DB = βDA .
A.2
Eigenvalue Spectrum of Spiral Units
Definition For value nhnu ∈ N+ , the taxicab norm of a vector β~ ∈ Rnhnu ×1 is defined, using operator || · ||taxi , as the sum of absolute values of all entries, i.e.: nhnu
~ taxi = ||β||
X i=1
|βi | = |β1 | + |β2 | + . . . + |βnhnu |
(A.5)
Theorem - 4 Given value nhnu ∈ N+ , and a matrix M ∈ Rnhnu ×nhnu which can be decomposed as nhnu −1 X 2 nhnu −1 M = β1 P + β2 P + . . . + βnhnu −1 P = βi P i i=1
where vector β~ ∈ R(nhnu −1)×1 and matrix P ∈ Rnhnu ×nhnu is the permutation matrix in eq-(3.4) which up-shifts the entries of multiplier for one position, the maximum absolute ~ eigenvalue of matrix M is smaller than the taxicab norm of vector β: λn ≤ β~ = |β1 | + |β2 | + . . . + |βnhnu −1 | hnu taxi
Proof Let matrices PP and DP respectively denote the modal matrix and the spectral matrix of matrix P. Let matrices PP i and DP i respectively denote the modal matrix and the spectral matrix of matrix P i with i ∈ [1, nhnu −1], where matrix P i is the exponentiation of P with the exponent i. According to Lemma-1, it holds: P = (PP )(DP )(PP )−1 P i = (PP i )(DP i )(PP i )−1 ,
i ∈ [1, nhnu − 1]
According to Lemma-2, it satisfies: PP i = PP DP i = (DP )i with i ∈ [1, nhnu − 1]
A.3 Eigenvalue Spectrum of SpiralRNN s Given matrix M =
Pnhnu −1 i=1
133
βi P i , it reads:
nhnu −1
M
X
=
βi (PP i )(DP i )(PP i )−1
i=1
nhnu −1
= PP
X i=1
nhnu −1
= PP
X i=1
βi (DP i ) PP−1
�i βi DP PP−1
(A.6)
β~ ∈ Rnhnu ×1
with
n o ˆ ˆ Assuming the eigenvalues of matrix P is λ1 , · · · , λnhnu , its spectral matrix DP has n o ˆ1, · · · , λ ˆn λ in the diagonal. Therefore, with eq-(A.6), matrix M’s eigenvalue λk can hnu be calculated as followed: nhnu −1
λk =
X
ˆ k )i βi (λ
i=1
∀k ∈ [1, · · · , nhnu ]
(A.7)
As all eigenvalues of a permutation matrix lie in the unit cycle [81], it satisfies, ˆ k | = 1, |λ
∀k ∈ [1, · · · , nhnu ]
(A.8)
Thus, taking the absolute value over both side of eq-(A.7), it holds ∀k ∈ [1, · · · , nhnu ], that: nhnu nhnu −1 X−1 X i ˆ k )i ˆ |λk | = βi (λk ) ≤ βi (λ i=1 i=1 nhnu −1
≤ =
X
i=1 nhnu −1
X i=1
ˆi |βi | λ k |βi |
Therefore, the maximum absolute eigenvalue of matrix M is bounded, and is limited by ~ i.e. ||β|| ~ taxi . the taxicab norm of vector β,
A.3
Eigenvalue Spectrum of SpiralRNN s
Theorem - 5 Let Nhn ∈ N, q ∈ [1, · · · , Nhn ] , and a block-diagonal matrix W ∈ RNhn ×Nhn has nunits ∈ N numbers of sub-block matrices Mk , k ∈ [1, · · · , nunits ], each of which can be
134
A. Eigenvalue Spectrum of SpiralRNN s
decomposed as: {nhnu }k −1
Mk =
X
(k)
βi (Pk )i ,
k ∈ [1, · · · , nunits ]
i=1
(A.9) (k)
where {nhnu }k stands for the length of diagonal vector of sub-block matrix Mk , βi is the ith entry of the vector β~ (k) ∈ R({nhnu }k −1)×1 , matrix Pk ∈ R{nhnu }k ×{nhnu }k is the permutation matrix which up-shifts the entries of multiplier by one position, Pk has the same size as Mk . Note that β~ (k) as a whole is a vector, and symbol (k) indicating the association with the k-th sub-block matrix is not an exponent. Then the maximum absolute eigenvalue ||λ||∞ = max{|λq |} of matrix W is bounded by the maximum taxicab norm value in all β~ (k) vectors, i.e. n o ||λ||∞ ≤ max ||β~ (k)||taxi , k ∈ [1, · · · , nunits ] k
{nhnu }k −1
X
where ||β~ (k)||taxi =
i
(k)
|βi |
Proof According to Theorem-4, the eigenvalue of the k-th sub-block matrix Mk of W is calculated as: {nhnu }k −1 (k) |λj |
≤ ||β~ (k)||taxi =
X i=1
(k)
|βi |,
j ∈ [1, · · · , {nhnu }k ] k ∈ [1, · · · , nunits ]
(A.10)
Meanwhile, the determinant of block-diagonal matrix det(·) is equal to the product of determinants of all its sub-block matrices: det(W ) = det(M1 ) × det(M2 ) × · · · × det(Mnunits )
(A.11)
Given λ ∈ R and I an identity matrix with the same size as matrix W , the matrix (W −λI) is also a block-diagonal matrix. Let matrix Ik be an identity matrix with the same size of (k) the k-th sub-block matrix Mk and λj be the j-th eigenvalue of Mk , j ∈ [1, · · · , {nhnu }k ], then the relations hold: nunits
det(W − λI) = =
Y
k=1 nunits
det(Mk − λIk )
Y � (k) (k) (k) (λ − λ1 )(λ − λ2 ) · · · (λ − λ{n
nunits {nhnu }k
=
}
hnu k
k=1
Y
k=1
Y j=1
(k)
(λ − λj )
)
�
A.3 Eigenvalue Spectrum of SpiralRNN s
135
Hence, the eigenvalue spectrum of a block-diagonal matrix aggregates the eigenvalue spectra of its sub-block matrices. Therefore, given any eigenvalue λj of block-diagonal matrix W , there exists one of the sub-block matrices which has the same eigenvalue, i.e. ∀q ∈ [1, · · · , Nhn ], ∃k ∈ [1, · · · , nunits ] and ∃i ∈ [1, · · · , {nhnu }k ], such that: (k) |λq | = λi ≤ β~ (k)
taxi
=
{nhnu }k −1
X j=1
(k) βj
(A.12)
As a result, the eigenvalue spectrum of matrix W is limited by the maximum taxicab norm value of the associated vectors. n o n o ||λ||∞ ≤ max |λq | ≤ max ||β~ (k)||taxi , k ∈ [1, · · · , nunits ] q
k
136
A. Eigenvalue Spectrum of SpiralRNN s
Appendix B MatLab Code for SpiralRNN Models To implement SpiralRNN models in the MatLab environment, create MatLab scripts for all of the following functions and save them in a folder with the name “@spiralRNN”. • To start training a SpiralRNN model, go to the directory where folder “@spiralRNN” exists as a sub-folder. • Construct the class “spiralRNN” by calling the constructor function “spiralRNN”. net = spiralRNN(dim,nuh);
• In each time step with pair of network input and corresponding target: {dat,tar}, train the model with the command “trnng”. net = trnng(net,dat,tar); • Autonomous test can start, given the initial starting data “dat” and prediction step “fut”, at any time with command “auttt”. output = auttt(net,dat,fut); %%%%%%%%%%%%%%%%%%%%%%%%%%%%%%%%%%%%%%%% function net = spiralRNN(varargin) %%%%%%%%%%%%%%%%%%%%%%%%%%%%%%%%%%%%%%%% %SPIRALRNN - Constructor of the MatLab class ’spiralRNN’ % SPIRALRNN by itself only initializes the MatLab structure and % specifies the size of all its components and values of some % of them. % This function itself does not implement learning or testing, and such % operation will be conducted by other scripts in the same % class. %
138 % % % % % % % % % % % % % % % % % % % % % % % % % % % % % % % % % %
B. MatLab Code for SpiralRNN Models
This script supports various ways of updating, which is controlled by boolean parameters: ’trainDiff’ and ’loopBack’. By default ’trainDiff’ is set to be 1 and loopBack = 0, note that ’loopBack’ is active only when trainDiff=1 . - trainDiff=1, input of network remains unchanged whilst target of output is set to the difference of data instead of data itself, i.e. tar=x(t+1)-x(t) instead of tar=x(t+1). Parameter ’loopBack’ is active only when trainDiff=1 o loopBack=1, input will be set to as the sum of previous input and previous output, i.e. x(t+1)=x(t)+y(t); o loopBack=0, input will be set normal - trainDiff=0, tar=x(t+1) SYNTAX: net = spiralRNN(dim, nhu, tdf, lpb) constructs the structure net by specifying "dim" as the dimension of data fed into network, "nhu" as number of hidden nodes in each hidden unit (by default, number of hidden units will be equal to "dim"), Parameters "tdf" and "lpb" are optional, their values will be assigned to ’trainDiff’ and ’loopBack’ respectively, and their default values are 1 and 0. It requires input: dim - dimension of data; nhu - number of neurons in each hidden units (number of hidden units is equal to ’dim’) tdf - boolean argument, whether to train with difference of data lpd - boolean argument, whether to loop back the output as input and returns output: net - object of class, containing all the information about the neural network;
if or(nargin>4,nargin=3 % to set the training target as the difference between data or not net.trainDiff=varargin{3}; else net.trainDiff = 1; % default value --- train the original data target end if nargin>=4 net.loopBack = varargin{4};% to use the output value as in input or not else net.loopBack = 0; % default value --- train without loopBack end end net.ninr = dimension; % dimension of input net.nout = net.ninr; % dimension of output net.nhmini = nhmini; % number of neurons in each spiral unit net.nhidden = net.ninr*net.nhmini; % total number of neurons in hidden layer outfn=’linear’; hidfn=’tanh’; net.outfn = outfn; % output activation function net.hidfn = hidfn; % hidden activation function net.MaxHidPropCoef = 1; % maximum absolute value of coefficient in W_hid nl=0.01; net.w1 = net.b1 = net.w2 = net.b2 =
(2*rand(net.nhidden,net.ninr)-1)*nl; (2*rand(net.nhidden,1)-1)*nl; (2*rand(net.nout,net.nhidden)-1)*nl; (2*rand(net.nout,1)-1)*nl;
% % % %
weights bias of weights bias of
from input to hidden hidden neurons from hidden to output output neurons
% initial coef. in the hidden-weigth matrix hidCoefIndx = [2:nhmini]; net.hidPropCoef = randn(length(hidCoefIndx),net.nout); if length(hidCoefIndx)>1, deno=length(hidCoefIndx)-1; else deno=1; end net.hidPropCoef = (2*rand(length(hidCoefIndx),net.nout)-1)/deno; % construct the recurrent hidden weight matrix --% (permutation matrices in ’whidPack’ will % be used in construction of hidden matrix W_hid) Mtem=diag(ones(1,nhmini-1),1)+diag(ones(1,1),-(nhmini-1)); for j=1:size(net.hidPropCoef,2) whidB = blkdiag(zeros((j-1)*net.nhmini),Mtem,zeros((net.nout-j)*net.nhmini)); for i=1:size(net.hidPropCoef,1) packIdx=(j-1)*(nhmini-1)+i;
140
B. MatLab Code for SpiralRNN Models net.whidPack{packIdx} = whidB^(hidCoefIndx(i)-1); end
end net.input = zeros(net.ninr,1); % initial input net.output = zeros(net.nout,1); % initial output net.err = zeros(net.nout,1); % initial error net.hidState = zeros(net.nhidden,1); % initial hidden state net.preHidState = zeros(net.nhidden,1); % initial previous hidden state net.preData = zeros(net.ninr,1); % initial previous data; % construct Vweight vector which assembles all the parameters to be trained. % This vector, instead of all other weight matrices (e.g. w1, w2, b1 etc.), % will be used in EKF; while those weight matrices will be used in % feed-forward step since it is more straight-forward net.Vweight = [net.w1(:);net.b1(:);net.hidPropCoef(:);net.w2(:);net.b2(:)]; % total number of parameters/neural connection to be trained net.noswei = length(net.Vweight); % initial derivative net.g_s_w = zeros(net.nhidden,net.noswei);%deri. of hidden state w.r.t. weights net.g_o_w = zeros(net.nout,net.noswei); %deri. of network output w.r.t. weights net.kalmanP = eye(net.noswei)*1; % initial P matrix for kalman filter net.kalmanQ = eye(net.noswei)*1e-8; % initial Q matrix for kalman filter net.kalmanR = eye(net.nout)*0.01; % initial R matrix for kalman filter net.name = ’spiralRNN’; net = class(net,’spiralRNN’);
%%%%%%%%%%%%%%%%%%%%%%%%%%%%%%%%%%%%%%%% function [opt,hdv] = auttt(net,fin,nss) %%%%%%%%%%%%%%%%%%%%%%%%%%%%%%%%%%%%%%%% %AUTTT - Implementation of autonomous testing in spiralRNN model. % AUTTT implements the autonomous test (i.e. output of previous step is % fed in as input "fin" for the current step, and so on) and returns the % result stream. % % SYNTAX: % % [opt,hdv] = auttt(net,fin,nss) returns the autonomous test results % for "nss" steps when net is triggered by the feed-in of "fin". % Returned results include the output "opt", hidden states "hdv"(for debug)
141 % % % % % % % % % % % % % % %
It requires input: net - object of class, containing all the information about the neural network; fin - [dim,1] column vector which contains data to be fed in the network as input nss - total number of iterations in the autonomous prediction and returns output: opt - [dim,nss] matrix, contains sequence of output column vectors for ’nss’ steps in autonomous prediction. hdv - [nhn,nss] matrix, contains sequence of hidden-state vectors for ’nss’ steps in autonomous prediction, where ’nhn’ refers to the number of hidden nodes in network
opt=zeros(length(fin),nss); hdv=zeros(net.nhidden,nss); for i=1:nss net=frwrd(net,fin); % forward-step of network, if net.trainDiff == 1 fin=net.output + fin; else fin=net.output; end opt(:,i)=fin; % record output vectors from autonomous test hdv(:,i)=net.hidState; % record hidden state vectors from autonomous test end
%%%%%%%%%%%%%%%%%%%%%%%%%%%%%%%%%%%%%%%% function net = drvtv(net) %%%%%%%%%%%%%%%%%%%%%%%%%%%%%%%%%%%%%%%% %DRVTV - Calculation of derivative % DRVTV calculates the derivative of output w.r.t. connection % weight. Error message has been stored in the component "err". % % SYNTAX: % % net = drvtv(net), % % It requires input: % net - object of class, containing all the information about
142 % % % % % % % % % % %
B. MatLab Code for SpiralRNN Models the neural network; and returns output: net - object of class, the following components of net will be directly modified by this script: o g_s_w: [nhn,noswei] matrix refers to the derivative of hidden state w.r.t. all the weights, ’nhn’ refers to number of hidden nodes in the network, ’noswei’ is the total number of weights o g_o_w: [dim,noswei] matrix refers to the derivative of output vector w.r.t. all the weights, ’dim’ is dimension of data
% preparation of data ninr=net.ninr;nh=net.nhidden;nout=net.nout; maxCoef = net.MaxHidPropCoef; tanhCoef = tanh(net.hidPropCoef); %connection weights % WHID = zeros(nh); % hidden-weight matrix % for i=1:length(tanhCoef(:)), WHID = net.whidPack{i}*tanhCoef(i) + WHID; end WHID = fthdm(net); % derivative of hidden FUNCTION if or(strcmp(net.hidfn,’rectanh’)==1,strcmp(net.hidfn,’tanh’)==1) Vz2 = 1.0 - net.hidState.^2; elseif strcmp(net.hidfn,’linear’)==1 Vz2 = ones(size(net.hidState)); else error(’Unsupported hidden activiation function’); end diagVz2 = diag(Vz2); % GRADIENT CALCULATION p_s_i = diagVz2*net.w1; % p_s_w: der. of current state w.r.t. network input p_s_s = diagVz2*maxCoef*WHID; % der. of current state w.r.t. previous state p_o_s = net.w2; % p_o_s: der. of output w.r.t. current state % construct p_s_w: partial der. of current state w.r.t. weights p_s_w = zeros(nh,net.noswei);lastidx=0; p_s_w(:,lastidx+(1:nh*ninr)) = kron(net.input,eye(nh))’; % about net.w1 lastidx=lastidx + nh*ninr; p_s_w(:,lastidx+(1:nh)) = eye(nh); % about net.b1 lastidx=lastidx + nh; for i=1:length(tanhCoef(:)), p_s_w(:,lastidx+i)=maxCoef*(1-tanhCoef(i)^2)*net.whidPack{i}*net.preHidState; end % about net.tanhCoef lastidx=lastidx + length(tanhCoef(:));
143 p_s_w = diagVz2*p_s_w; % construct p_o_w: partial der. of output w.r.t. weights % only need to fill in those entries corresponding to the output % weight and the output bias p_o_w = zeros(nout, net.noswei); p_o_w(:,lastidx + (1:nout*nh)) = kron(net.hidState,eye(nout))’; % about net.w2 lastidx=lastidx + nout*nh; p_o_w(:,lastidx + (1:nout)) = eye(nout); % about net.b2 lastidx=lastidx + nout; % calculate gradient g_s_w: gradient of current state w.r.t. weights net.g_s_w = p_s_w + p_s_s*net.g_s_w + p_s_i*net.g_o_w; % calculate gradient g_o_w: gradient of output w.r.t. weights net.g_o_w = p_o_w + p_o_s*net.g_s_w;
%%%%%%%%%%%%%%%%%%%%%%%%%%%%%%%%%%%%%%%% function net = eKftn(net,drp) %%%%%%%%%%%%%%%%%%%%%%%%%%%%%%%%%%%%%%%% %EKFTN - Implementation extended Kalman filter training algorithm % EKFTN - Implementation extended Kalman filter algorithm % on the training of network connection weights. % % SYNTAX: % % net = eKftn(net,drp) trains the values of connection weights % in net structure according to the derivative information in ’drp’, % modification of value lies in the aggregated vector net.Vweight. % Matrix ’drp’ is of size [dim,noswei] % % It requires input: % net - object of class, containing all the information about % the neural network; % % and returns output: % net - object of class, the following components will be directly % modified by this script: % o kalmanP: P matrix in extended Kalman filter % o kalmanR: R matrix in extended Kalman filter % o Vweight: vector which assembles all of the trainable weights %
144
B. MatLab Code for SpiralRNN Models
net.kalmanP=net.kalmanP+net.kalmanQ; kal=net.kalmanP*transpose(drp)*inv((drp)*net.kalmanP*transpose(drp)+net.kalmanR); net.kalmanP=net.kalmanP-kal*drp*net.kalmanP;% posterior covariance of weigths net.Vweight=net.Vweight + kal*net.err; % update of kalman R maPeriodCoefR = 0.01; % coefficient for calculation of M.A. value of kalmanR net.kalmanR = maPeriodCoefR*net.err*transpose(net.err) ... + (1-maPeriodCoefR)*net.kalmanR; % Q is kept unchanged
%%%%%%%%%%%%%%%%%%%%%%%%%%%%%%%%%%%%%%%% function net = frwrd(net,fin) %%%%%%%%%%%%%%%%%%%%%%%%%%%%%%%%%%%%%%%% %FRWRD - Implementation of forward step of ’spiralRNN’ model. % FRWRD implements the iteration of spiralRNN model for one step % and return results. The network parameters are to be kept for % the sake of further iterations. % % SYNTAX: % % net = frwrd(net,fin), where fin is the fee-in vector, % returns the network with updated components % % It requires input: % net - object of class, containing all the information about % the neural network; % fin - data vector which feeds in the network as input % % and returns output: % net - object of class, the following components of net will be % directly modified by this script: % o input: input vector of network % o preHidState: hidden-state vector in the previous time step % o hidState: updated hidden-state vector in current time step % o output: output vector of network % o preData: given data of previous time step (only when net.loopBack=1) %
145 % preparation if net.loopBack==0, net.input = fin; elseif net.loopBack==1 net.input = net.output + net.preData; net.preData = fin; end % feed forward step [output,HidState] = spiralFoward(net); % restore data net.preHidState = net.hidState; net.hidState=HidState; net.output=output;
%%%%%%%%%%%%%%%%%%%%%%%%%%%%%%%%%%%%%%%% function [outState,hidState]=spiralFoward(net) %%%%%%%%%%%%%%%%%%%%%%%%%%%%%%%%%%%%%%%% %SPIRALFORWARD - Implementation of feed forward step of spiralRNN. % SPIRALFORWARD implements the feed forward step of spiralRNN model % and returns the output vector "VoutStates" and hidden state vector % "VhidStates". % fetch the hidden-weight matrix hdm = fthdm(net); % update the hidden state vector hidState = net.hidState; netin = net.w1*net.input + net.b1; netin = netin + hdm*hidState; switch net.hidfn case ’tanh’, hidState = tanh(netin); case ’linear’, hidState = netin; otherwise, error(’Unrecognize recfunc’); end % update of output vector netin = net.w2*hidState + net.b2; switch net.outfn case ’linear’, outState= netin; case ’tanh’, outState = tanh(netin); otherwise, error(’Unrecognize outfunc’);
146
B. MatLab Code for SpiralRNN Models
end
%%%%%%%%%%%%%%%%%%%%%%%%%%%%%%%%%%%%%%%% function hdm = fthdm(net) %%%%%%%%%%%%%%%%%%%%%%%%%%%%%%%%%%%%%%%% %FTHDM - Obtain the hidden-weight matrix of ’spiralRNN’ model % FTHDM can fetch the hidden-weight matrix of ’spiralRNN’ model % directly. Creation of this script is mainly for reason of reviewing, % but it is also called by ’spiralFoward’ which is a sub-routine % of script ’frwrd.m’. % % SYNTAX % % hdm = fthdm(net), % % It requires input: % net - object of class, containing all the information about % the neural network; % % and returns output: % hdm - hidden-weight matrix of ’spiralRNN’ % % recurrent coupling coefficients tanhCoef = tanh(net.hidPropCoef); % initialization of matrix hdm = zeros(net.nhidden); for i=1:length(tanhCoef(:)), hdm = net.MaxHidPropCoef*net.whidPack{i}*tanhCoef(i) + hdm; end
%%%%%%%%%%%%%%%%%%%%%%%%%%%%%%%%%%%%%%%% function net = trnng(varargin) %%%%%%%%%%%%%%%%%%%%%%%%%%%%%%%%%%%%%%%% %TRNNG - Implementation of training step in ’spiralRNN’ model % TRNNG calculates the derivative of output w.r.t. to all % the synaptical weights in network and adjusts the values % of weights accordingly, finally returns back the trained % structure net. %
147 % % % % % % % % % % % % % % % % % % % % % % % %
SYNTAX: net = trnng(net) trains the weights directly, assuming the forward step has been already implemented and the error message as well as hidden state vector etc are up-to-date and available. net = trnng(net,fin,tar) will conduct a forward step to generate the output and calculate the error at first and then implement the training and update of weights of network. It requires input: net - object of class, containing all the information about the neural network; fin - data vector which feeds in the network as input; tar - vector of target data; and returns output: net - object of class, the following components of net will be directly modified by this script: o err (only when number of input arguments is larger than 1) o g_o_w (will be reset to zero only when loopBack=0)
% fetch arguments net = varargin{1}; if nargin==3, fin = varargin{2}; tar = varargin{3}; doForward = 1; elseif nargin==1 else error(’Number of input arguments is incorrect.’) end % when required, implement feed-forward if and(exist(’doForward’,’var’),doForward==1), net = frwrd(net,fin); net.err = tar - net.output; if net.trainDiff == 1, net.err = net.err - fin; end end % calculate the derivative of network output w.r.t. net connection weights net = drvtv(net);
148
B. MatLab Code for SpiralRNN Models
% using KALMAN FILTER to adjust the values in ’Vweight’. % (In order to keep the interface of script ’eKftn.m’ indentical % for all the recurrent neural network model, we do NOT simplify % the interface to net=eKftn(net). Anyway, it is trival) net = eKftn(net,net.g_o_w); % update network weights, (according to values of ’Vweight’) net = wgtup(net); % reset the gradient information when necessary if net.loopBack == 0 % no gradient will be looped back when doing teacher forcing net.g_o_w = zeros(size(net.g_o_w)); end
%%%%%%%%%%%%%%%%%%%%%%%%%%%%%%%%%%%%%%%% function net = wgtup(net) %%%%%%%%%%%%%%%%%%%%%%%%%%%%%%%%%%%%%%%% %WGTUP - Update of weights in all connection matrices. % WGTUP updates the value of all connection weights, given % the update component net.Vweight. Update order should be consistent % with the combination of the derivative information as in script % "drvtv.m" % % SYNTAX: % % net = wgtup(net), % % It requires input: % net - object of class, containing all the information about % the neural network; % % and returns output: % net - object of class, the following components of net will be directly % modified by this script: % o w1: weight matrix which connects input and hidden layer % o b1: bias vector of hidden nodes % o hidPropCoef: coefficient of connection among hidden nodes % o w2: weight matrix which connects hidden and output layer % o b2: bias vector of output nodes % Vweight=net.Vweight;
149 ninr=net.ninr;nh=net.nhidden;nout=net.nout; % restore weight (input --> hidden) lastidx=0; net.w1(:) = Vweight(lastidx + (1:ninr*nh)); lastidx=lastidx + ninr*nh; % restore bias of hidden neurons net.b1(:) = Vweight(lastidx+(1:nh)); lastidx=lastidx+nh; % restore hidden coefficient net.hidPropCoef(:)=Vweight(lastidx+(1:prod(size(net.hidPropCoef)))); lastidx=lastidx+prod(size(net.hidPropCoef)); % restore weight (hidden --> output) net.w2(:) = Vweight(lastidx+(1:nh*nout)); lastidx=lastidx+nh*nout; % restore bias of output net.b2(:) = Vweight(lastidx+(1:nout)); lastidx=lastidx+nout;
%%%%%%%%%%%%%%%%%%%%%%%%%%%%%%%%%%%%%%%% function res=get(net,ppn) %%%%%%%%%%%%%%%%%%%%%%%%%%%%%%%%%%%%%%%% % % % % % %
GET - Fetch the value of component in given structuure. (for debug) GET return the value res which belongs to the component with the name ppn from structure net. res=get(net,ppn)
res=eval(strcat(’net.’,ppn));
%%%%%%%%%%%%%%%%%%%%%%%%%%%%%%%%%%%%%%%% function net=set(net,ppn,val) %%%%%%%%%%%%%%%%%%%%%%%%%%%%%%%%%%%%%%%% %SET - Change of value of component in net (for debug) % SET enables outsider to change the configuration of structure % directly. This change of value will be permenent.
150 % % % %
B. MatLab Code for SpiralRNN Models
net=set(net,ppn,val) uses data val to reset the component property, which has the name string as ppn, of structure net
eval(strcat(’net.’,ppn,’=val;’));
Appendix C MatLab Code for MouseTracking The MouseTracking is a toy software developed in the MatLab environment as the first application of the SpiralRNN model in real-world problems. The software measures the position of the mouse cursor on the computer monitor, preprocessing is applied to these raw measurement data such that those points dividing the trajectory path into even segments are treated as training data of the SpiralRNN model. These points separating stretches are called “boundary points”. Based on the training data, the SpiralRNN develops the embedded model to adapt to the dynamics of data so that it can make an autonomous prediction of the cursor trajectory, given its latest position. The software supports keyboard commands with the keys “s”, “t”, “n” and “q”. Details of the keys can be found in the function description in the following. Note that one must keep the software interface on top (being activated or high-lighted) in order to make the software respond to keys being pressed. To install, create MatLab scripts for all of the following functions and save them into the folder named “mousetracking” or other. In order to implement the SpiralRNN model, the folder “@spiralRNN” mentioned in appendix-B has to be placed as a subfolder in the aforementioned folder. To launch the software interface, go to the directory “mousetracking” in the MatLab environment and type the following command, where “nhdut” determines the size of the network model and “prdst” specifies the prediction length. net = mouseTrack(nhdut,prdst) %%%%%%%%%%%%%%%%%%%%%%%%%%%%%%%%%%%%%%%% function net = mouseTrack(nhdut,prdst) %%%%%%%%%%%%%%%%%%%%%%%%%%%%%%%%%%%%%%%% % % %
MOUSETRACK - implement MouseTracking which tracks the mouse cursor MOUSETRACK - implement the MouseTracking, which constructs a SpiralRNN model as the learning model, measures the pre-pocesses the data from
152 % % % % % % % % % % % % % % % % % % % % % % % % % %
C. MatLab Code for MouseTracking mouse position and uses these as training data. Training error is drawn in the bottom subplot of interface, and upper subplot depicts the measured position of cursor. Autonomous test prediction can be lauched by human user at any time, where a red curve will be drawn to show the prediction trajectory of mouse cursor. Keyborad command is supported, where "s" stands for starting the training meanwhile user should move the mouse on certain imagine trajectory, "t" stands for taking the autonomous test but it will not stopped until the prediction steps has been reached, "n" stands for start a new training and reinitial all the parameters, "q" stands for quiting the software. Software will stay in the pause mode after the autonomous test, and wait for the next command either "s" or "t" or "n" or "q". SYNTAX: net = mouseTrack(nhdut,prdst) It requires input: nhdut - number of hidden nodes in each hidden unit of SpiralRNN prdst - prediction step, number of iterations in autonomous test and return output: net - learning model of SpiralRNN
if (ischar(nhdut)),nhdut=str2num(nh_unit);end if (ischar(prdst)),prdst=str2num(prdst);end clear global CntKey global CntKey % initialization dim=2; net=spiralRNN(dim,nhdut); % construct the class scrWidth=1152;scrHeight=864; % resolution of computer monitor allowTest=0; allowTrain=0; iter=0; trajectory=zeros(dim,5e3); trajectErr=zeros(1,5e3); lengthTraj=0; lengthTraE=0; %relaxing/pause time between each iteration, such that computer can relax
153 iterPause=0.01; % preparation the interface fig = gcf; clf; set(fig,’KeyPressFcn’,@getCntKey); figure(fig);subplot(2,1,1);axis([-1,1,-1,1]) ,title(’Trajectory’) toContinue=1; while toContinue iter=iter+1; % detect the key press allowTrain=0; allowTest=0; if CntKey==’s’ allowTrain=1; elseif CntKey==’q’ close all return; elseif CntKey==’t’ allowTest=1; elseif CntKey==’n’ clear class net iter=0; net=spiralRNN(dim,nhdut); fig = gcf; clf; set(fig,’KeyPressFcn’,@getCntKey); lengthTraj=0; lengthTraE=0; CntKey=’s’; continue; else end if allowTrain==1 % initialization if ~exist(’utl’,’var’), utl = 0.02 ; dfd = utl; end if ~exist(’knnpt’,’var’) newdata=get(0,’PointerLocation’); newdata(1)= (newdata(1)-scrWidth/2)/(scrWidth/2); newdata(2)= (newdata(2)-scrHeight/2)/(scrHeight/2); knnpt=transpose(newdata); % the lastest known point on the trajectory
154
C. MatLab Code for MouseTracking iter=iter-1; continue; end if ~exist(’prevInP’,’var’), prevInP = knnpt; % the latest boundary point end trajectory(:,lengthTraj+1) = knnpt; % record the position of cursor lengthTraj=lengthTraj+1; % get data from mouse position fig=gcf; newdata=get(0,’PointerLocation’); newdata(1)= (newdata(1)-scrWidth/2)/(scrWidth/2); newdata(2)= (newdata(2)-scrHeight/2)/(scrHeight/2); ltstm=transpose(newdata); % the latest measuremet of mouse cursor % interpolation if gtdst(knnpt,ltstm) >= dfd % when mouse cursor moves to a new position such that the distance % is far enough to form at least one new boundary point. % sgmpt - concatenation of boundary points % dfd - difficiency in length to new the next boundary point [sgmpt,dfd] = intpl(knnpt,ltstm,dfd,utl); else % when mouse cursor moves to a new position where the distance % is not far enough to form at least one new boundary point, % then update the value, skip the training and waiting % for next measurment. dfd = dfd - gtdst(knnpt,ltstm); iter=iter-1; knnpt = ltstm; continue; end % training nosIntPoint=size(sgmpt,2); for k=1:nosIntPoint % train the network net=trnng(net,prevInP,sgmpt(:,k)); % record the training error iterErr(:,k) = get(net,’err’); % assign current target as the input for next iteration
155 prevInP=sgmpt(:,k); end % record the error and boundary points trajectErr((1:nosIntPoint)+lengthTraE)=mean(iterErr(:,1:nosIntPoint).^2); trajectory(:,(1:nosIntPoint)+lengthTraj)=sgmpt; lengthTraj = lengthTraj + nosIntPoint; lengthTraE = lengthTraE + nosIntPoint; % plot the trajectory and training error subplot(2,1,1),title(’Trajectory’) plot(trajectory(1,1:lengthTraj),trajectory(2,1:lengthTraj)) drawnow if iter>=2 subplot(2,1,2), plot(log(trajectErr(1:lengthTraE)/var(trajectErr(1:lengthTraE)))); title(’Logorithmic NMSE’),grid on, drawnow end % take the latest measurement point value in "knnpt" knnpt=ltstm; if size(trajectErr,2)>5e3,disp(’TrnngIter>=5e3’);return;end pause(iterPause); % slow down the simulation elseif allowTest==1 % autonomous test testOutput=auttt(net,prevInP,prdst); % plot the result of autonomous test figure(fig) subplot(2,1,1), hold on, plot(testOutput(1,1),testOutput(2,1),’gp’); for k=2:size(testOutput,2), plot(testOutput(1,1:k),testOutput(2,1:k),’r’,’linewidth’,4); drawnow, end hold off title(’Trajectory’) % print out notice after plotting temStr = strcat(num2str(prdst),’ steps’); temStr = [’Red line indicates the autonomous prediction with ’,temStr]; disp(temStr); % release the indicator
156
C. MatLab Code for MouseTracking CntKey=’’; allowTest=0; iter=iter-1; else iter=iter-1; end
end
pause(0.001) % relax the computer % end of WHILE
%%%%%%%%%%%%%%%%%%%%%%%%%%%%%%%%%%%%%%%% function dst = gtdst(pt1,pt2) %%%%%%%%%%%%%%%%%%%%%%%%%%%%%%%%%%%%%%%% %GTDST - get the distance between two point (2-dimensional) % GTDST calculates the euclidean distance between two 2-dimensional % point, and return the value. % % SYNTAX: % dst = gtdst(pt1,pt2); % % It requires the input: % pt1 - position vector of point 1 % pt2 - position vector of point 2 % % and returns output: % dst - euclidean distance between two given points % dst = sqrt(sum((pt1-pt2).^2));
%%%%%%%%%%%%%%%%%%%%%%%%%%%%%%%%%%%%%%%% function [sgp,dfd] = intpl(psp,lms,dfd,utl) %%%%%%%%%%%%%%%%%%%%%%%%%%%%%%%%%%%%%%%% % % % % % % % %
INTPL - interpolate the mouse trajectory INTPL - divide the path from "psp" to "lms" into even segments with each segement has length equals "utl", and concantenate all the segement points (points dividing the segments) and the defficiency of the last trial SYNTAX: [sgp,dfd] = intpl(psp,lms,dfd,utl);
157 % % % % % % % % % % % % %
It requires the input: psp - position vector of the latest boundary point lms - position vector of the latest measurement of mouse cursor dfd - deficiency (of length) which was required in the previous interpolation utl - unit of length which is used to segment the path of cursor and returns the output: sgp - concantenation of the position of newly formed boundary points dfd - deficiency (of length) which is required in the current interpolation
% the distance from psp to lms availableDist = gtdst(psp,lms); if availableDist < dfd % when "availableDist" is not longer than "dfd" % to form a segmentation sgp = []; dfd = dfd - availableDist; % update dfd else % number of segments which can be made within the "availableDist" fac = ceil((availableDist-dfd)/utl); % construct the boundary point one by one, and store in "sgp" sgp = zeros(2,fac); sgp(:,1) = gnsgp(psp,lms,dfd); for i=2:fac sgp(:,i) = gnsgp(sgp(:,i-1),lms,utl); end % calculate the deficiency to form another boundary point dfd=utl - gtdst(sgp(:,fac),lms); end
%%%%%%%%%%%%%%%%%%%%%%%%%%%%%%%%%%%%%%%% function nsp = gnsgp(psp,lms,rql) %%%%%%%%%%%%%%%%%%%%%%%%%%%%%%%%%%%%%%%% % %
GNSGP - generate the boundary points GNSGP generates one boundary point based on the position of previous
158 % % % % % % % % % % % % %
C. MatLab Code for MouseTracking boundary point and the latest measurement point.
SYNTAX: nsp = gnsgp(psp,lms,rql) It requires the input: psp - the previous boundary points lms - position vector of the latest measurement of mouse cursor rql - the required length in order to form a segment and returns the output: nsp - the position vector of the newly constructed boundary point
% distance dPs = gtdst(psp,lms); % calculate the position of boundary point % such that distance from "psp" to "nsp" % is equal to "rql" nsp = zeros(2,1); nsp(1) = rql/dPs*(lms(1)- psp(1))+psp(1); nsp(2) = rql/dPs*(lms(2)-psp(2))+psp(2);
%%%%%%%%%%%%%%%%%%%%%%%%%%%%%%%%%%%%%%%% function getCntKey(src,evnt) %%%%%%%%%%%%%%%%%%%%%%%%%%%%%%%%%%%%%%%% % get the key press global CntKey CntKey = evnt.Character;
List of Figures 1.1
Dynamics transformation . . . . . . . . . . . . . . . . . . . . . . . . . . . . . . . .
5
2.1
Artificial neurons and layers of neurons . . . . . . . . . . . . . . . . . . . . . . . . 10
2.2
Sketch of RNN in general . . . . . . . . . . . . . . . . . . . . . . . . . . . . . . . . 11
2.3
Sketch of TDNN model . . . . . . . . . . . . . . . . . . . . . . . . . . . . . . . . . 13
2.4
Sketches of the SRN and ESN model . . . . . . . . . . . . . . . . . . . . . . . . . 15
2.5
Sketch of BDRNN . . . . . . . . . . . . . . . . . . . . . . . . . . . . . . . . . . . . 16
2.6
Back-propagation of MLP . . . . . . . . . . . . . . . . . . . . . . . . . . . . . . . . 19
2.7
Learning paradigms . . . . . . . . . . . . . . . . . . . . . . . . . . . . . . . . . . . 22
2.8
Working cycle of a sensor node . . . . . . . . . . . . . . . . . . . . . . . . . . . . . 24
3.1
The structure of a hidden unit . . . . . . . . . . . . . . . . . . . . . . . . . . . . . 29
3.2
The typical structure of SpiralRNN s . . . . . . . . . . . . . . . . . . . . . . . . . . 31
3.3
Training of a SpiralRNN . . . . . . . . . . . . . . . . . . . . . . . . . . . . . . . . . 35
3.4
Autonomous test of SpiralRNN s . . . . . . . . . . . . . . . . . . . . . . . . . . . . 41
4.1
Data examples from Spike21 and Mackey-Glass datasets . . . . . . . . . . . . . . . 44
4.2
Lorenz chaotic time series . . . . . . . . . . . . . . . . . . . . . . . . . . . . . . . . 45
4.3
Results in Spike21 data with complexity Cs ≃ 50 . . . . . . . . . . . . . . . . . . . 51
4.4
Results in Spike21 data with complexity Cs ≃ 100 . . . . . . . . . . . . . . . . . . 52
4.5
Results in Mackey-Glass dataset . . . . . . . . . . . . . . . . . . . . . . . . . . . . 53
160
LIST OF FIGURES
4.6
Results in Lorenz data with model complexity Cs ≃ 100 . . . . . . . . . . . . . . . 54
4.7
Results in Lorenz data with complexity Cs ≃ 200 . . . . . . . . . . . . . . . . . . . 55
4.8
Autonomous output of MackeyGlass data . . . . . . . . . . . . . . . . . . . . . . . 56
4.9
MouseTracking’s graphical interface . . . . . . . . . . . . . . . . . . . . . . . . . . 57
4.10 Dataset examples in MouseTracking . . . . . . . . . . . . . . . . . . . . . . . . . . 59 4.11 Segmentation in MouseTracking . . . . . . . . . . . . . . . . . . . . . . . . . . . . . 59 4.12 Frequency analysis in MouseTracking with Cs ≃ 100 . . . . . . . . . . . . . . . . . 62 4.13 Frequency analysis in MouseTracking with Cs ≃ 200 . . . . . . . . . . . . . . . . . 62 4.14 Output examples of SpiralRNN in MouseTracking . . . . . . . . . . . . . . . . . . 63 4.15 Schematic diagram of warehouse . . . . . . . . . . . . . . . . . . . . . . . . . . . . 64 4.16 Histogram of evaluation error in scheme-1 . . . . . . . . . . . . . . . . . . . . . . . 71 4.17 Histogram of evaluation error in scheme-2 . . . . . . . . . . . . . . . . . . . . . . . 72 4.18 Histogram of evaluation error of SpiralRNN in scheme-2 . . . . . . . . . . . . . . . 73 4.19 Result examples from conditional prediction . . . . . . . . . . . . . . . . . . . . . . 74 4.20 Sample data from NN5 dataset . . . . . . . . . . . . . . . . . . . . . . . . . . . . . 76 4.21 Additional inputs . . . . . . . . . . . . . . . . . . . . . . . . . . . . . . . . . . . . . 77 4.22 Online training of SpiralRNN in NN5 competition . . . . . . . . . . . . . . . . . . 78 4.23 Committee of SpiralRNN experts . . . . . . . . . . . . . . . . . . . . . . . . . . . . 79
4.24 Comparison between result and data showing weekly behavior for time series 35. Dashed line with circles
4.25 Comparison between result and data for time series 9 showing seasonal behavior. Dashed curve is the da
4.26 Prediction result (solid curve) and data (dashed curve) for time series 110 showing a peak around Easte 4.27 Histogram (over 111 time series) of committee-average SMAPE error from experts .
82
4.28 Stability test with SpiralRNN in simulation with Spike21 . . . . . . . . . . . . . . 83 4.29 Stability test with SpiralRNN in simulation with Lorenz . . . . . . . . . . . . . . . 84 4.30 Measurement on short-term memory of SpiralRNN . . . . . . . . . . . . . . . . . . 86 4.31 Comparison of the impact of γ value on short-term memory . . . . . . . . . . . . . 87
List of Figures
161
4.32 Measurement on associative memory of SpiralRNN . . . . . . . . . . . . . . . . . . 89 5.1
Schematic diagram of the duty-cycle reduction . . . . . . . . . . . . . . . . . . . . . 92
5.2
Explanation of activity period . . . . . . . . . . . . . . . . . . . . . . . . . . . . . . 94
5.3
Structure modification in a sensor node . . . . . . . . . . . . . . . . . . . . . . . . 95
5.4
Sketch of the evolution framework
5.5
Modification of matrix P
6.1
Data example of heat diffusion simulations . . . . . . . . . . . . . . . . . . . . . . . 107
6.2
Example topology of sensor network . . . . . . . . . . . . . . . . . . . . . . . . . . 109
6.3
Example of sensor nodes in the network . . . . . . . . . . . . . . . . . . . . . . . . 110
6.4
Comparison of prediction error in Simulation-1 . . . . . . . . . . . . . . . . . . . . 115
6.5
Comparisons in Simulation-1 with Cs ≃ 100 . . . . . . . . . . . . . . . . . . . . . . 116
6.6
Comparisons in Simulation-1 with Cs ≃ 200 . . . . . . . . . . . . . . . . . . . . . . 117
6.7
Comparisons of np and nm in “EF+DCi” series with complexity Cs ≃ 100 . . . . . 118
6.8
Comparisons of np and nm in “EF+DCi” series with complexity Cs ≃ 200 . . . . . 119
6.9
Comparison of prediction between DC2 and the “normal” schemes . . . . . . . . . 120
. . . . . . . . . . . . . . . . . . . . . . . . . . . 96
. . . . . . . . . . . . . . . . . . . . . . . . . . . . . . . . 99
6.10 Reduction rate in duty-cycle reduction . . . . . . . . . . . . . . . . . . . . . . . . . 122 6.11 Occurrence probability of evolution operations . . . . . . . . . . . . . . . . . . . . 123 6.12 Histograms of amount of input neurons in sensor network . . . . . . . . . . . . . . 124 6.13 Histograms of maximum communication energy consumption . . . . . . . . . . . . 124 6.14 Histograms of maximum computation energy consumption . . . . . . . . . . . . . . 125
162
List of Figures
List of Tables 2.1
Specifications of the TelosB device . . . . . . . . . . . . . . . . . . . . . . . . . . . 23
3.1
Terminology of symbols
3.2
Pseudo code: implementation of SpiralRNN s . . . . . . . . . . . . . . . . . . . . . 33
4.1
Configuration of RNN architectures . . . . . . . . . . . . . . . . . . . . . . . . . . . 46
4.2
Comparison with Spike21 and Cs ≃ 50 . . . . . . . . . . . . . . . . . . . . . . . . . 51
4.3
Comparison with Spike21 and Cs ≃ 100 . . . . . . . . . . . . . . . . . . . . . . . . 52
4.4
Comparison with Mackey-Glass and Cs ≃ 50 . . . . . . . . . . . . . . . . . . . . . 53
4.5
Comparison with Mackey-Glass and Cs ≃ 100 . . . . . . . . . . . . . . . . . . . . . 53
4.6
Comparison with Lorenz and Cs ≃ 100 . . . . . . . . . . . . . . . . . . . . . . . . . 54
4.7
Comparison with Lorenz and Cs ≃ 200 . . . . . . . . . . . . . . . . . . . . . . . . . 55
4.8
The pseudo code for the MouseTracking. . . . . . . . . . . . . . . . . . . . . . . . 58
4.9
MatLab code for plotting frequency figure . . . . . . . . . . . . . . . . . . . . . . . 61
. . . . . . . . . . . . . . . . . . . . . . . . . . . . . . . . . 28
4.10 Comparison in MouseTracking with Cs ≃ 100 . . . . . . . . . . . . . . . . . . . . . 61 4.11 Comparison in MouseTracking with Cs ≃ 200 . . . . . . . . . . . . . . . . . . . . . 61 4.12 Pseudo code for initialization in conditional prediction . . . . . . . . . . . . . . . . 67 4.13 Pseudo code for training in conditional prediction . . . . . . . . . . . . . . . . . . . 67 4.14 Pseudo code for testing in conditional prediction . . . . . . . . . . . . . . . . . . . 68 4.15 Amount of hidden neurons in conditional prediction simulation . . . . . . . . . . . 69 4.16 Results of models in conditional prediction with scheme-1 . . . . . . . . . . . . . . 71
164
List of Tables
4.17 Results of SpiralRNN in conditional prediction with scheme-1 . . . . . . . . . . . . 72 4.18 Results of models in conditional prediction with scheme-2 . . . . . . . . . . . . . . 72 4.19 Results of SpiralRNN in conditional prediction with scheme-2 . . . . . . . . . . . . 73 4.20 Committee of experts.
. . . . . . . . . . . . . . . . . . . . . . . . . . . . . . . . . 79
4.21 Statistic results. The committee-averaged SMAPE error value of the expert committee on all 111 time se 5.1
Pseudo code for the duty-cycle reduction . . . . . . . . . . . . . . . . . . . . . . . . 95
5.2
Pseudo code for the evolution framework . . . . . . . . . . . . . . . . . . . . . . . . 103
6.1
Comparison in prediction error in simulation-1 with Cs ≃ 100 . . . . . . . . . . . . 115
6.2
Comparison in prediction error in simulation-1 with Cs ≃ 200 . . . . . . . . . . . . 116
6.3
Comparison in prediction error in “EF+DCi” series with Cs ≃ 100 . . . . . . . . . 118
6.4
Comparison in prediction error in “EF+DCi” series with Cs ≃ 200 . . . . . . . . . 118
Bibliography [1] D. Estrin, D. Culler, K. Pister, and G. Sukhatme, “Connecting the physical world with pervasive networks,” IEEE Pervasive Computing, vol. 1, pp. 59– 69, 2002. [2] J. J. Garrahan, P. A. Russo, K. Kitami, and R. Kung, “Intelligent network overview,” IEEE Communication Magazine, vol. March, pp. 30–36, 1993. [3] J. Stankovic, T. Abdelzaher, C. Lu, L. Sha, and J. Hou, “Real-time communication and coordination in embedded sensor networks,” Proceedings of the IEEE, vol. 91, pp. 1002– 1022, 2003. [4] C.-Y. Chong and S. Kumar, “Sensor networks: evolution, opportunities, and challenges,” Proceedings of the IEEE, vol. 91, pp. 1247–1256, 2003. [5] A. Kun, W. Miller, and W. Lenharth, “Modular system architecture for electronic device integration in police cruisers,” Intelligent Vehicle Symposium, 2002. IEEE, vol. 1, pp. 109– 114, 2002. [6] A. Mainwaring, J. Polastre, R. Szewczyk, D. Culler, and J. Anderson, “Wireless sensor networks for habitat monitoring,” ACM International Workshop on Wireless Sensor Networks and Applications (WSNA’02), 2002. [7] I. F. Akyildiz, W. Su, Y. Sankarasubramaniam, and E. Cayirci, “Wireless sensor networks: A survey,” Computer Networks, vol. 38, pp. 393–422, 2002. [8] G. J. Pottie and W. J. Kaiser, “Wireless integrated network sensors,” Commun. ACM, vol. 43, no. 5, pp. 51–58, 2000. [9] J. Heidemann, F. Silva, C. Intanagonwiwat, R. Govindan, and D. Estrin, “Building efficient wireless sensor networks with low-level naming,” in SOSP ’01: Proceedings of the eighteenth ACM symposium on Operating systems principles, ISBN: 1-58113-389-8, (New York, NY, USA), pp. 146–159, ACM Press, 2001. [10] D. Estrin, R. Govindan, J. Heidemann, and S. Kumar, “Next century challenges: Scalable coordination in sensor networks,” Proceedings of the Fifth Annual International Conference on Mobile Computing and Networks (MobiCOM ’99), pp. 263–270, 1999. [11] A. Kansal, A. A. Somasundara, D. D. Jea, M. B. Srivastava, and D. Estrin, “Intelligent fluid infrastructure for embedded networks,” in MobiSys ’04: Proceedings of the 2nd international
166
BIBLIOGRAPHY conference on Mobile systems, applications, and services, (New York, NY, USA), pp. 111– 124, ACM Press, 2004.
[12] E. C. Uberbacher and R. J. Mural, “Locating protein-coding regions in human DNA sequences by a multiple sensor-neural network approach,” Proceedings of the National Academy of Sciences, USA., vol. 88, pp. 11261–11265, 1991. [13] E. Yoneki, “Evolution of ubiquitous computing with sensor networks in urban environments,” in Ubicomp - Workshop on Metapolis and Urban Life, pp. 56–60, September 2005. [14] B. Hong and V. K. Prasanna, “Constrained flow optimization with applications to data gathering in sensor networks,” in First International Workshop on Algorithmic Aspects of Wireless Sensor Networks, 2004. [15] A. Hac, Wireless Sensor Network Designs. John Wiley & Sons, 2003. [16] R. V. Dyck and L. Miller, “Distributed sensor processing over an ad hoc wireless network: simulation framework and performance criteria,” in Military communications conference, 2001. [17] W. Ye, J. Heidemann, and D. Estrin, “An energy-efficient mac protocol for wireless sensor networks,” Twenty-First Annual Joint Conference of the IEEE Computer and Communications Societies, vol. 3, pp. 1567– 1576, 2002. [18] B. Chen, K. Jamieson, H. Balakrishnan, and R. Morris, “Span: An energy-efficient coordination algorithm for topology maintenance in ad hoc wireless networks,” Wireless Networks, vol. 8, pp. 481–494, 2004. [19] V. Rajendran, K. Obraczka, and J. J. Garcia-Luna-Aceves, “Energy-efficient, collision-free medium access control for wireless sensor networks,” Wireless Networks, vol. 12, pp. 63–78, 2006. [20] K. Hornik, M. Stinchcombe, and H. White, “Multilayer feedforward networks are universal approximators,” Neural Netw., vol. 2, no. 5, pp. 359–366, 1989. [21] F. Scarselli, “Universal approximation using feedforward neural networks: A survey of some existing methods, and some new results.,” Neural Networks, vol. 11, pp. 15–37, 1998. [22] A. Waibel, T. Hanazawa, G. Hinton, and K. Shikano, “Phoneme recognition using time-delay neural networks,” IEEE Transactions on Acoustics, Speech and Signal Processing, vol. 37(3), pp. 328–339, 1989. [23] J. Hertz, A. Krogh, and R. G. Palmer, Introduction to the theory of neural computation. Addison Wesley, 1991. [24] L. Li, “Approximation theory and recurrent networks,” International Joint Conference on Neural Network, vol. 2, pp. 266–271, 1992. [25] J. Choi, M. Bouchard, and T. Yeap, “Decision feedback recurrent neural equalization with fast convergence rate,” IEEE Transactions on Neural Networks, vol. 16, pp. 699–708, 2005.
BIBLIOGRAPHY
167
[26] A. C. Tsoi and A. Back, “Locally recurrent globally feedforward networks: a critical review of architectures,” IEEE Transactions on Neural Networks, vol. 5, no. 2, pp. 229–239, 1994. [27] J. Perez-Ortiz, J. Calera-Rubio, and M. Forcada, “A comparison between recurrent neural architectures for real-time nonlinear prediction of speech signals,” Neural Networks for Signal Processing XI, 2001, pp. 73–81, 2001. [28] H. Zimmermann, R. Grothmann, A. Schaefer, and C. Tietz, New Directions in Statistical Signal Processing: From Systems to Brain, ch. Identification and Forecasting of Large Dynamical Systems by Dynamical Consistent Neural Networks. MIT Press, 2005. [29] D. C. Psichogios and L. H. Ungar, “A hybrid neural network-first principles approach to process modeling,” AIChE Journal, vol. 38, pp. 1499 – 1511, 2004. [30] Y. Yao, G. Marcialis, M. Pontil, P. Frasconi, and F. Roli, “Combining flat and structured representations for fingerprint classification with recursive neural networks and support vector machines,” Pattern Recognition, vol. 36, pp. 397–406, 2003. [31] E. J. Hartman, J. D. Keeler, and J. Nowalski, “Layered neural networks with Gaussian hidden units as universal approximations,” Neural Computation, vol. 2, pp. 210–215, 1990. [32] K. Watanabe, J. Tang, M. Nakamura, S. Koga, and T. Fukuda, “Fuzzy-Gaussian neural network and its application to mobile robot control,” IEEE Transactions on Control Systems Technology, vol. 4, pp. 193–199, 1996. [33] A. Petrosian, D. Prokhorov, W. Lajara-Nanson, and R. Schiffer, “Recurrent neural networkbased approach for early recognition of Alzheimer’s disease in EEG,” Clinical Neurophysiology, vol. 112, pp. 1378–1387, 2001. [34] P. Angeline, G. Saunders, and J. Pollack, “An evolutionary algorithm that constructs recurrent neural networks,” IEEE Transactions on Neural Networks, vol. 5, pp. 54–65, 1994. [35] J. Sum, C.-s. Leung, G. H. Young, and W.-k. Kan, “On the Kalman filtering method in neural-network training and pruning,” IEEE Transactions on Neural Networks, vol. 10, pp. 161–166, 1999. [36] J. Sum, L. wan Chan, C. sing Leung, and G. H. Young, “Extended Kalman filter-based pruning method for recurrent neural networks,” Neural Comput., vol. 10, no. 6, pp. 1481– 1505, 1998. [37] R. Setiono and H. Liu, “Neural-network feature selector,” IEEE Transactions on Neural Networks, vol. 8, pp. 654–662, 1997. [38] W. McCulloch and W. Pitts, Bulletin of Mathematical Biophysics, ch. A Logical Calculus of Ideas Immanent in Nervous Activity, pp. 115–133. Springer New York, 1988. Reprinted from theBulletin of Mathematical Biophysics, Vol. 5, pp. 115-133 (1943). [39] R. P. Lippmann, “An introduction to computing with neural nets,” IEEE Acoustics, Speech and Signal Processing Magazine, vol. 4, pp. 4–22, Apr. 1987.
168
BIBLIOGRAPHY
[40] R. P. Lippmann, “Pattern classification using neural networks,” IEEE Comm. Mag., vol. 27, pp. 47–69, 1989. November. [41] J. Bioch, O. v. d. Meer, and R. Potharst, “Classification using Bayesian neural nets,” IEEE International Conference on Neural Networks, vol. 3, pp. 1488–1494, 1996. [42] D. E. Rumelhart and e. a. J. L. McClelland, Parallel distributed processing: explorations in the microstructure of cognition. Cambridge, Mass.,MIT Press, 1986. [43] T. Sejnowski and C. Rosenberg, “Parallel networks that learn to pronounce english text,” Complex Systems, vol. 1, pp. 145–168, 1987. [44] J. Ma, “The capacity of time-delay recurrent neural network for storing spatio-temporal sequences,” Neurocomputing, vol. 62, pp. 19–37, 2004. [45] A. D. Back and A. C. Tsoi, “FIR and IIR synapses, a new neural network architecture for time series modeling,” Neural Computations, vol. 3, pp. 375–385, 1991. [46] J. L. Elman, “Finding structure in time,” Cognitive Science, vol. 14, no. 2, pp. 179–211, 1990. [47] H. Zimmermann, R. Grothmann, A. Schaefer, and C. Tietz, “Dynamical consistent recurrent neural networks,” Int. Joint Conference on Neural Networks (IJCNN), 2005. [48] H. Jaeger, “The ”Echo State” approach to analysing and training recurrent neural networks,” Tech. Rep. GMD Report 148, German National Research Center for Information Technology, 2001. [49] H. Jaeger, “Short term memory in echo state networks,” Tech. Rep. GMD Report 152, German National Research Center for Information Technology, 2002. [50] H. Jaeger, “Adaptive nonlinear system identification with echo state networks,” Advances in Neural Information Processing Systems, vol. 15, pp. 593–600, 2003. [51] H. Jaeger, “Tutorial on training recurrent neural networks, covering BPTT, RTRL, EKF and the ”echo state network” approach.,” Tech. Rep. GMD Report 159, German National Research Center for Information Technology, 2002. [52] S. Sivakumar, W. Robertson, and W. Phillips, “Online stabilization of block-diagonal recurrent neural networks,” IEEE Transactions on Neural Networks, vol. 10, pp. 167 – 175, 1999. [53] P. Mastorocostas and J. Theocharis, “On stable learning algorithm for block-diagonal recurrent neural networks, part 1: the RENNCOM algorithm,” IEEE International Joint Conference on Neural Networks, vol. 2, pp. 815– 820, 2004. [54] L. Bottou, On-line learning in neural networks, ch. On-line learning and stochastic approximations, pp. 9–42. New York, NY, USA: Cambridge University Press, 1998. [55] R. Kalman, “A new approach to linear filtering and prediction problems,” Transactions of the ASME–Journal of Basic Engineering, vol. 82, pp. 35–45, 1960.
BIBLIOGRAPHY
169
[56] F. Lewis, Optimal Estimation: With an Introduction to Stochastic Control Theory. A WileyInterscience Publication, 1986. ISBN: 0-471-83741-5. [57] G. Welch and G. Bishop, “An introduction to the Kalman filter,” Tech. Rep. Technical Report 95-041, University of North Carolina at Chapel Hill, Department of Computer Science, 2002. [58] J. A. Perez-Ortiz, F. A. Gers, D. Eck, and J. Schmidhuber, “Kalman filters improve LSTM network performance in problems unsolvable by traditional recurrent nets,” Neural Network, vol. 16, pp. 241–250, Mar 2003. [59] P. Trebatickye, “Recurrent neural network training with the extended Kalman filter,” IIT.SRC 2005, pp. 57–64, 2005. [60] P. L. Bogler, “Tracking a maneuvering target using input estimation.,” IEEE Transactions on Aerospace and Electronic Systems, vol. AES-23, no. 3, pp. 298–310, 1987. [61] S. Singhal and L. Wu, “Training multilayer perceptrons with the extended Kalman algorithm,” Advances in neural information processing systems 1, pp. 133–140, 1989. [62] D. E. Catlin, Estimation, Control, and the Discrete Kalman Filter. ISBN: 038796777X, Springer, 1988. [63] Y.-R. Kim, S.-K. Sul, and M.-H. Park, “Speed sensorless vector control of an induction motor using an extended Kalman filter,” Industry Applications Society Annual Meeting, 1992., Conference Record of the 1992 IEEE, vol. 1, pp. 594–599, 1992. [64] R. G. Brown and P. Y. C. Hwang, Introduction to Random Signals and Applied Kalman Filtering: with MATLAB excercises and solutions. John Wiley & Sons,Inc., 3rd ed., 1997. [65] L. Xie and Y. C. Soh, “Robust Kalman filtering for uncertain systems,” Syst. Control Lett., vol. 22, no. 2, pp. 123–129, 1994. [66] R. Williams and D. Zipser, “A learning algorithm for continually running fully recurrent neural networks,” Neural Computtion, vol. 1, pp. 270–280, 1989. [67] A. W. Smith and D. Z. and, “Learning sequential structure with the real-time recurrent learning algorithm,” International Journal of Neural Systems, vol. 1, pp. 125 – 131, 1989. [68] T. Chow and Y. Fang, “A recurrent neural-network-based real-time learning controlstrategy applying to nonlinear systems with unknown dynamics,” IEEE Transactions on Industrial Electronics, vol. 45, pp. 151–161, 1998. [69] C. Fi-John, C. Li-Chiu, and H. Hau-Lung, “Real-time recurrent learning neural network for stream-flow forecasting,” Hydrological processes, vol. 16, pp. 2577–2588, 2002. [70] S. Haykin, ed., Nueral Networks - a Comprehensive Foundation. Prentice Hall, 1999. [71] N. B. Toomarian and J. Barhen, “Learning a trajectory using adjoint functions and teacher forcing,” Neural Networks, vol. 5, pp. 473 – 484, 1992.
170
BIBLIOGRAPHY
[72] N. Toomarian and J. Barhen, “Fast temporal neural learning using teacher forcing,” International Joint Conference on Neural Network, vol. 1, pp. 817–822, 1991. [73] J. Polastre, R. Szewczyk, and D. Culler, “Telos: Enabling ultra-low power wireless research,” in The Fourth International Conference on Information Processing in Sensor Networks: Special track on Platform Tools and Design Methods for Network Embedded Sensors, pp. 364– 369, 2005. [74] T. B¨ack, F. Hoffmeister, and H.-P. Schwefel, “A survey of evolution strategies,” Proceedings of the Fourth International Conference on Genetic Algorithms, pp. 2–9, 1991. [75] H.-G. Beyer, “Evolution strategies.” http://www.scholarpedia.org/, September 2007. [76] R. K. Belew, J. McInerney, and N. N. Schraudolph, Artificial Life II, ch. Evolving Networks: Using the Genetic Algorithm with Connectionist Learning, pp. 511–547. Addison-Wesley, 1992. [77] C. Igel, “Neuroevolution for reinforcement learning using evolution strategies,” Evolutionary Computation, vol. 4, pp. 2588 – 2595, 2003. [78] K. O. Stanley and R. Miikkulainen, “Evolving neural networks through augmenting topologies,” Evolutionary Computation, vol. 10, pp. 99–127, 2002. [79] K. O. Stanley, Efficient Evolution of Neural Networks through Complexification. PhD thesis, Department of Computer Sciences, The University of Texas at Austin, 2004. [80] H. Gao, R. Sollacher, and H.-P. Kriegel, “Spiral recurrent neural network for online learning,” in 15th European Symposium On Artificial Neural Networks Advances in Computational Intelligence and Learning, (Bruges (Belgium)), April 2007. [81] K. Wieand, “Eigenvalue distributions of random permutation matrices,” The Annals of Probability, vol. 28, no. 4, pp. 1563–1587, 2000. [82] D. Geller, I. Kra, S. Popescu, and S. Simanca, “On circulant matrices.” Preprint. [83] R. M. Gray, Toeplitz and Circulant Matrices: A Review. Now Publishers, Norwell, Massachusetts, 2006. [84] B. Schuermann, J. Hollatz, and U. Ramacher, “Models of brain function and artificial neuronal nets,” Models of Brain Function and Artificial Neuronal Nets, pp. 167–185, 1990. [85] L. Glass and M. C. Mackey, From Clocks to Chaos, The Rhythms of Life. Princeton University Press, 1988. [86] H. Gao and R. Sollacher, “Condictional prediction of time series using spiral recurrent neural network,” in European Symposium on Artificial Neural Networks Advances in Computational Intelligence and Learning, 2008. [87] R. Sollacher and H. Gao, “Efficient online learning with spiral recurrent neural networks,” in to appear in: International Joint Conference on Neural Networks, 2008.
BIBLIOGRAPHY
171
[88] R. J. McEliece, E. C. Posner, E. R. Rodemich, and S. S. Venkatesh, “The capacity of the hopfield associative memory,” IEEE Trans. Inf. Theor., vol. 33, no. 4, pp. 461–482, 1987. [89] R. Wattenhofer, L. Li, P. Bahl, and Y.-M. Wang, “Distributed topology control for power efficient operation in multihop wireless ad hoc networks,” in Twentieth Annual Joint Conference of the IEEE Computer and Communications Societies, 2001. [90] W. Krause, R. Sollacher, and M. Greiner, Lecture Notes in Computer Science, ch. Self* Topology Control in Wireless Multihop Ad Hoc Communication Networks, pp. 49–62. Springer Berlin / Heidelberg, 2005. [91] L. Kleinrock and J. Silverster, “Optimum transmission radii for packet radio networks or why six is a magic number,” in National Telecommunications Conference, 1978.