SIMULATION http://sim.sagepub.com
Distributed Modeling Architecture of a Multi-Agent-Based Behavioral Economic Landscape (MABEL) Model Zhen Lei, Bryan C. Pijanowski, Konstantinos T. Alexandridis and Jennifer Olson SIMULATION 2005; 81; 503 DOI: 10.1177/0037549705058067 The online version of this article can be found at: http://sim.sagepub.com/cgi/content/abstract/81/7/503
Published by: http://www.sagepublications.com
On behalf of:
Society for Modeling and Simulation International (SCS)
Additional services and information for SIMULATION can be found at: Email Alerts: http://sim.sagepub.com/cgi/alerts Subscriptions: http://sim.sagepub.com/subscriptions Reprints: http://www.sagepub.com/journalsReprints.nav Permissions: http://www.sagepub.com/journalsPermissions.nav
Downloaded from http://sim.sagepub.com at PENNSYLVANIA STATE UNIV on April 14, 2008 © 2005 Simulation Councils Inc.. All rights reserved. Not for commercial use or unauthorized distribution.
Distributed Modeling Architecture of a Multi-Agent-Based Behavioral Economic Landscape (MABEL) Model Zhen Lei Krannert School of Management Purdue University West Lafayette, IN 47901, USA Bryan C. Pijanowski Konstantinos T. Alexandridis Department of Forestry and Natural Resources Purdue University West Lafayette, IN 47901, USA
[email protected] Jennifer Olson Department of Geography Michigan State University East Lansing, MI 48824, USA The authors discuss a distributed modeling architecture in a multi-agent-based behavioral economic landscape (MABEL) model that simulates land-use changes over time and space. Based on agentbased modeling methodologies, MABEL presents a bottom-up approach to allow the analysis of dynamic features and relations among geographic, environmental, human, and socioeconomic attributes of landowners, as well as comprehensive relational schematics of land-use change. The authors adopt a distributed modeling architecture (DMA) in MABEL to separate the modeling of agent behaviors in Bayesian belief networks from task-specific simulation scenarios.Through a clientserver infrastructure, MABEL provides an efficient and scalable decision request-response mechanism among heterogeneous agents, scenarios, and behavioral models. As an important part of the land-use change model, a market-bidding system and an adaptive land partition algorithm for land transactions are also discussed. Keywords: Agent-based modeling, MABEL, distributed modeling architecture, Bayesian belief network, land-use change
1. Introduction Agent-based modeling (ABM) refers to a collection of computational techniques in which autonomous agents interact, communicate, evolve, learn, and make complex decisions within a real-time simulation framework, and emergent properties are observed [1]. Unlike traditional differential-equation modeling methods, in which system-level properties such as population densities are the fundamental elements of the model, agent-based model-
SIMULATION, Vol. 81, Issue 7, July 2005 503-515 © 2005 The Society for Modeling and Simulation International DOI: 10.1177/0037549705058067
| | | | |
ing presents a bottom-up approach [2] to assess the plausibility of the behaviors of fundamental actors of a social system. Agent-based models are constructed to represent and simulate problem-solving situations, in which collaborative and conflict behaviors can co-occur in the way that they emerge in everyday life [3]. Agent-based models have been developed to understand human societies (e.g., [4]), avian evolution of cooperation (e.g., [5-7]), the life histories of animals in dynamic landscapes (e.g., [8]), and the evolution of economic systems (e.g., [9]), to name a few. During the past decade, agent-based modeling approaches have been applied to simulate land-use changes [10-12]. Developing comprehensive, multi-agent-based systems that simulate land-use change over large regions, across large time horizons (years to decades), with many attributes
Downloaded from http://sim.sagepub.com at PENNSYLVANIA STATE UNIV on April 14, 2008 © 2005 Simulation Councils Inc.. All rights reserved. Not for commercial use or unauthorized distribution.
Lei, Pijanowski, Alexandridis, and Olson
that are spatially explicit, and with many heterogeneous agents, is technically challenging. First, simulations with large numbers of agents are computationally expensive and require high-end computational capabilities. Second, changing parameters within a complex model containing a lot of different types of agents is very time-consuming. Third, most agent-based modeling tools, such as Swarm [13], do not have libraries containing spatially explicit routines and spatial visualization tools. Finally, storing and processing large amounts of data require other software tools, many of which are highly specialized, such as Geographic Information Systems (GIS), relational databases, and statistical analysis packages. In this article, we present a distributed modeling architecture (DMA) that addresses the above challenges [14]. We demonstrate its application in our multi-agent-based behavioral economic landscape (MABEL) model. Within our DMA, we separate task-specific simulations from the modeling of agent behaviors in external modeling tools, such as Bayesian belief networks (BBN) [15, 16], in which modelers can easily build and alter agents’behavioral models without laborious coding for specific simulations. Furthermore, through a client-server infrastructure, our DMA distributes simulation tasks to remote computers over the Internet, allowing for a high degree of scalability of simulations. In addition, our DMA provides a flexible and cross-platform architecture, which enables us to integrate a variety of software tools into our model. This article is organized as follows. First, we give an overview of land-use change models and how Bayesian belief networks operate within the context of MABEL. Second, we provide a summary of the DMA and the MABEL client-server infrastructure. Third, we discuss the details of the MABEL client and server components of the DMA. Fourth, we show several graphical user interfaces (GUIs) of the client and server versions. We conclude with a brief discussion and presentation of future work. 2. Overview of MABEL 2.1 Land-Use Change Modeling A variety of land-use change models have been developed over the past 30 years [17]. Most of these models [18] use surrogate drivers of change (e.g., distance to a market) to simulate the spatial nature of land use and the economic rationale for the use. Many of these models are statistically based [19, 20]; they attempt to quantify the strength of different drivers of change using linear or logistic regression techniques. Another approach has been to use cellular automata [21-24] to parameterize land-use (e.g., urban) growth rules using nearest neighbor and other types of spatial information (e.g., densities of use that represent a driver) to determine whether a cell will undergo a landuse transition. Econometric modeling approaches [20, 25] attempt to describe land-use change drivers within the context of economic, transportation, and market (e.g., real estate and development) factors that influence development
patterns in various land-use-related sectors (e.g., residential, commercial, industrial). Multicriteria evaluation has also been used [26, 27] to model the spatial relationships of interacting variables, especially for areas where data are lacking on the specific nature of driving variables. Finally, agent-based methods [10, 28] have begun to become a popular means to simulate land-use change using agents that own single cells within a grid environment and make changes to their use on the basis of decisions and agentagent interaction. Our agent-based MABEL model endeavors to provide a comprehensive and illustrative simulation of land-use changes over time and space. It differs from previous landuse change modeling efforts [17, 29] in that we focus on a parcel-based approach rather than a grid of cells modeling environment (e.g., as in [30]). In our model, groups of cells configured together in ownership parcels are associated with agents that can buy, sell, or keep their land; land transactions can also result in changes in its use as well. Agents in MABEL represent real-world landowners who base their behavior and actions on their perception of maximizing their total marginal utility.Agents can communicate, interact, conflict, and collaborate, interacting with their environment and with each other. 2.2 Agents in MABEL Agents in MABEL can be classified into two main categories: base agents and nonbase agents. Base agents in MABEL are agents that own land, designated as parcels, on a landscape, the fundamental simulation environment. Currently, base agents in MABEL can be from any land-use category: farmer agents, urban residential agents, forestry agents, and so on. By contrast, nonbase agents in MABEL represent computational entities that do not necessarily own land, and thus they are not displayed on a geographical map. Examples of nonbase agents are policymakers and local and regional planners, among others. The interactions among nonbase agents and, more important, the transactions between nonbased agents and base agents can potentially affect the final decision-making attributes of base agents. For example, the local policymaker agent may set particular limitations in the amount, minimal size, or geometrical regularity properties of the land under transaction. Nevertheless, in this article, we primarily discuss the base agents and their interactions and assume the external factors posed by nonbase agents to be homogeneous within the simulated regions. Each base agent contains four main components: (1) parcel attributes that include agent ID, land-use and spatial variables of area and perimeter, and biophysical attributes, such as soil type and elevation (e.g., mean and range); (2) socioeconomic attributes of the landowner, such as income, age, and family size; (3) decision inference, which is encapsulated in a BBN framework; and (4) decision outcomes related to land transactions, land management, and other types of strategies related to landuse change.
504 SIMULATION Volume 81, Number 7
Downloaded from http://sim.sagepub.com at PENNSYLVANIA STATE UNIV on April 14, 2008 © 2005 Simulation Councils Inc.. All rights reserved. Not for commercial use or unauthorized distribution.
DISTRIBUTED MODELING ARCHITECTURE OF A MABEL MODEL
3. Distributed Modeling Architecture Our MABEL DMA contains three major software components that are integrated using a client-server framework (Fig. 2; DMA components are shown in gray). The first is a MABEL client, each representing spatial regions where agents “own” land and “use” it for a specific purpose (e.g., farming). Within the client, agents also participate in land transactions through a market model. The second component is the MABEL server, which coordinates all MABEL client input/output (I/O) traffic with the third component, an external software analysis package containing behavioral models in the Bayesian belief network. Our MABEL client is written in the Swarm multiagent simulation modeling package [13], developed originally at the Santa Fe Institute. Swarm can run on any Linux system or most UNIX systems; our client operates on Microsoft Windows XP Professional using the Cygwin utility, which is a Linux-like environment for Windows. As is true of all general multiagent simulations developed in Swarm, the MABEL client program is split into a collection of agent objects and a schedule of activity for those agents. Our MABEL client contains two main components (Fig. 3): MabelModelSwarm and MabelObserverSwarm. At the core of the client is the MabelModelSwarm, which encapsulates the simulation “world.” The MabelModel-
Cognitive inference level
Decisions
Experience BDI level
Intentions
Beliefs Desires
Figure 1. The main conceptual elements of a belief-desiresintentions (BDI) decision model that is contained in our Bayesian belief networks (BBN) behavioral models
Windows Platform Geographic Information Information System System Geographic
One of the important features of our MABEL model is an agent behavioral model encapsulated in BBNs. Since in real-world situations it is often impossible to know the causes and roots of the decisions made at the individual level, the use of BBNs allows us to answer how likely (probable) it is to observe a specific decision (or a known distribution of decisions) made by an agent, given the observed values of an agent’s external environment and the observed historical land use yielded by those decisions. The two main levels of the BBN in our MABEL agents are shown in Figure 1. At the cognitive inference level [31], both the decisions and experience components are often observed indirectly, as observed or revealed preferences and historical decision-making attributes, respectively. At the belief-desires-intentions (BDI) level, often encountered in the relevant social agents literature [32, 33], the expected or observed agent decisions (depending on the deterministic or stochastic role of a simulation) are represented by a “loop” between their beliefs. In artificial intelligence terms, the BDI architecture represents a global, generic set of agent properties, thus promoting synthetic and proactive behavior. Generally speaking, the foundations of the development of the BDI architecture, built on intuitive cognitive philosophical foundations, can be summarized using the simple phrase: a person (an agent) intends to do these actions that she or he believes will achieve her or his goals (desires), and these actions are consistent given that person’s beliefs about the world. Each BDI component thereby reflects the informational, motivational, and deliberate states of an agent [34-36].
Spatially Spatially Explicit Explicit Knowledge Knowledge Base Base
Bayesian Bayesian Belief Belief Network Network
Statistical Statistical Software Software
API
MABEL Server TCP/IP
MABEL MABEL Clients Clients Swarm Simulator using Cygwin
Figure 2. Core components of the multi-agent-based behavioral economic landscape (MABEL) distributed modeling architecture (DMA) illustrating the server, client, and Bayesian belief networks (BBN) components and the different operating systems supporting these components
Swarm contains a collection of landowner agents and policymaking agents, a spatial world to represent the physical properties of the simulated area, and an “area” where agents can “meet” and participate in a market model to buy and sell land. Our MabelModelSwarm also uses the schedule routine of Swarm to control the temporal aspects of the model. The schedule routine defines the execution orders of system-level processes, such as updating the simulation environment by time; generates simulated environmental and social events probabilistically; and lets every land agent and policymaker agent make decisions, “develop” themselves, and carry out transactions during each Volume 81, Number 7
Downloaded from http://sim.sagepub.com at PENNSYLVANIA STATE UNIV on April 14, 2008 © 2005 Simulation Councils Inc.. All rights reserved. Not for commercial use or unauthorized distribution.
SIMULATION 505
Lei, Pijanowski, Alexandridis, and Olson
Initialization
Land Use/Parcel Attributes Input
MABELModelSwarm
MABELModelObserver
Interactive GUI
Market Model scheduler
Tabular and GIS Input
Socioeconomic Attributes Input
2D Spatial Maps Dynamic Analysis Charts
Agent ID
Attribute Tables
Decision Inference
Simulation Control Bayesian Belief Network (via MABEL Server)
Figure 3. The three components of the multi-agent-based behavioral economic landscape (MABEL) client highlighting the importance of the agent ID in linking all components
time step. The inputs to the MabelModelSwarm are the following model parameters: the spatial simulated map, biophysical and socioeconomic attributes, land-use types, and so on. The outputs of the MabelModelSwarm are the geographical and socioeconomic data and GUI observables of the model. The MabelObserverSwarm component includes the internal routines used for visualizations of the MabelModelSwarm. When running in graphics mode, the objects of MabelObserverSwarm, including Raster widgets, EZGraphs, and Probes, are connected into the MabelModelSwarm to read data and draw the visualizations that are part of the interactive graphical user interfaces. 4. MABEL Client As previously stated, each MABEL client represents a spatially defined area, with base agents making land transaction decisions that ultimately affect land-use changes over time and space. Here we describe several phases of execution, many of which are summarized in Figure 4, which occurs within the MABEL client that allows for agents to own, buy, and sell land and make decisions on the basis of outcomes from the BBN. 4.1 Initialization In the initialization phase, the MABEL client first creates the simulation environment and the corresponding 2-D geographic “world.” The size of the simulation world is derived from header information specified in ASCII flat files generated from spatial data layers from a GIS. Landuse/parcel and socioeconomic data are linked together by an agent’s ID number (Fig. 3), which is used to represent and index a specific agent. Next, the MABEL client creates all agent objects with corresponding land-use/parcel and socioeconomic attributes organized by an agent’s ID number. The client then matches parcel locations to indi-
viduals in socioeconomic databases. Finally, each agent draws and updates itself in the geographic 2-D “world” and is ready to respond to user queries to display land-use and socioeconomic attributes associated with each parcel. The MABEL client also creates the market model area with policy rules that control transactions among agents in the area. 4.2 Single-Agent Decision-Making Framework Using BBN Decision modeling is an important component of MABEL as it simulates the dynamic, adaptive, and intelligent character of the agents. Figure 5 shows an example BBN for MABEL agents involved in the decision to buy and sell land. The MABEL model initialization phase provides each agent with a range of attributes (e.g., distance to urban) and associated values that can be stored as probability distributions or as categorical values [18, 37]. Here we show attributes with categorical values. Our example in Figure 5 shows how we can group these attributes in broader, more homogeneous categories (e.g., Economic Attribute Index) using a weighted index for each of the attribute categories [38, 39]. Here we show three different homogeneous categories that we are exploring: a Biophysical Attribute Index (BIO) (e.g., attributes of land-use type; distances to urban centers, agriculture, roads, and lakes; parcel property size, etc.), an Economic Attribute Index (ECN) (e.g., attributes related to income, land-use type source of income, parcel property value, willingness to pay for environmental amenities, etc.), and a Social Attribute Index (SOC) (e.g., attributes of age, education level, social/professional group membership, social capital attributes, etc.). The three indices can be combined into a single weighted index that reflects the expected transaction decision (node DEC in the diagram) that an agent is more likely to choose given its attributes. The expected utility of the proposed transaction decision (or its probability
506 SIMULATION Volume 81, Number 7
Downloaded from http://sim.sagepub.com at PENNSYLVANIA STATE UNIV on April 14, 2008 © 2005 Simulation Councils Inc.. All rights reserved. Not for commercial use or unauthorized distribution.
DISTRIBUTED MODELING ARCHITECTURE OF A MABEL MODEL
Policy Controls
Bidding Market Model
Policy Maker Agent 1 … Agents Grouped into Classes
Policy Maker Agent M
Land Partition Routine & New Agent Creation
Population of Agents in Each Client Simulation
Land Agent 1
Land Agent 2
…
Land Agent N
Interface to MABEL Server for Decision Inference MABEL Client
MABEL Server
Figure 4. The pathways of information flow within the multi-agent-based behavioral economic landscape (MABEL) client and their relationship to the subcomponents
distribution) is compared across all associated costs (node Cs, ranging from 0 to 100) and benefits (node Bs, ranging from 0 to 100) related to this particular decision by calculating a cost-benefit combined index (where CBs = Bs −Cs, ranging from –100 to 100). The expected utility calculation in such a case, in its simplest form, will be a normalized CB index (ranging from 0-100). The results derived from running the BBN model define an expected or preferred action by a specific agent or a preferred action probability distribution for a group (class) of agents participating in a simulation. Over the simulation time period, the sequence of preferred action probability distributions is often referred to as an optimal policy [40]. The preferred agents’ actions are further calibrated in practice in the course of the simulation since each agent has to match his or her preferred choice with a specific transaction in the market module component. The final choice, which can or cannot be the same as the preferred action defined by the BBN model, depending on the final market bidding process, is channeled back to the BBN model to perform a dynamic Bayesian update for the network [41, 42]. The dynamic Bayesian update procedure over the simulation defines an optimal action, and the adaptive role of the agents participating in the simulation is to adjust their beliefs in such a way that their optimal policies converge with their optimal actions over time (for details, see [12]). 4.3 Multiagent Interaction within a Market Model Acquisition of land in a market model represents the basic framework for determining base agents’ actions [12, 43]. During every time step, agents communicate with the corresponding behavioral models in the BBN (Fig. 4) through
the MABEL server to inquire what the preferred decision is based on current conditions. The decision requests that an agent send to its behavioral model an included up-to-date state-space set of related land-use/parcel and socioeconomic attributes that are needed for the decision inference by its behavioral model. The maximum reward decision received from the BBN model includes action type (buy, sell, or no transaction), action quantity, and the appropriate agent types that match the transaction requirements. Then, according to the preferred decisions made in the behavioral models, agents execute a corresponding strategy to develop themselves, based on the land-use type (e.g., farm) and other land-use/parcel and socioeconomic data. On the other hand, the set of agents that intend to make transactions does so on the basis of the most profitable “deal” (i.e., best transaction) within the market model given land-use policy and rule regulations. Finally, agents update their land-use/parcel and socioeconomic attributes in the simulation using a Bayesian update approach [12]. The interface of the MABEL client with the cognitive decision inference model component (BBN) is achieved through an iterative sequence of nonparametric Bayesian diagnostic and updating inference techniques and procedures [40] as a part of the BBN model development and additional Bayesian library functions [48]. Example sources that can be used include (but are not restricted to) the opensource Bayesian filtering classes, Bayes++ [44], or any commercial Bayesian modeling software that provides an application programming interface (API) with a C/C++ source code. The objective of the market model is to help a potential buyer agent make the most profitable deal with any corresponding agent that intends to sell. The degree of profit in Volume 81, Number 7
Downloaded from http://sim.sagepub.com at PENNSYLVANIA STATE UNIV on April 14, 2008 © 2005 Simulation Councils Inc.. All rights reserved. Not for commercial use or unauthorized distribution.
SIMULATION 507
Lei, Pijanowski, Alexandridis, and Olson
Figure 5. An example Bayesian belief network (BBN) for land-use change simulations. This example shows the diversity of the types of attributes that can be introduced into the behavioral model and how they are integrated to create the required output (a preferred intention)
a transaction depends on how close the transaction quantity is of the agent that desires to buy land and meets the quantity of an agent that wants to sell. Also within the market model is a routine that first classifies all participating agents into different transaction groups by the transaction type (i.e., buy or sell) and sorts the agents in each group by transaction quantities. Then that buyer agent, which is the agent that has the largest transaction quantity in the list of buyer agents and that we call the “premium buyer agent,” checks the list of seller agents for a corresponding premium seller agent having the most land available to sell. If a match is successful, a transaction is made between the premium buyer agent and premium seller agent. Unless the seller agent sells all its land to the buyer agent, the seller agent partitions its land, and a new agent is created for the transaction area. The new agent adopts most land-use/parcel and socioeconomic attributes of the buyer agent and inherits some attributes from the seller agent (Fig. 6). The original premium buyer agent and premium seller agent then update their posttransaction quantities and are inserted back into the seller/buyer agent lists as long as they still satisfy the policy and regulation requirements,
such as minimum parcel size for the transaction. The process of finding a matched pair of a buyer agent and a seller agent for transaction continues in this way until the buyer list or seller list is empty. 4.4 Land-Partitioning Process In the process of creating the new agent, a seller agent has to determine how to partition the original area into two blocks with a corresponding shape and position for the new agent (i.e., the buyer agent) and the seller agent after the land transaction (Fig. 6). Based on their land shapes and transaction quantities, true landowners choose proper partition methods that correspond to local land-use policies. To simulate this land partition occurring in the real world, we [45] have developed a routine that examines the shapes and sizes of up to 16 different possible partition methods used in the real world. The routine, based on a spatial scanning method, is used to calculate width and height of the potential new parcel (x- and y-spatial dimensions in a 2-D planar map), and the shape that is selected is the one that has the minimum
508 SIMULATION Volume 81, Number 7
Downloaded from http://sim.sagepub.com at PENNSYLVANIA STATE UNIV on April 14, 2008 © 2005 Simulation Councils Inc.. All rights reserved. Not for commercial use or unauthorized distribution.
DISTRIBUTED MODELING ARCHITECTURE OF A MABEL MODEL
Agent ID: 001 Agent ID: 001 (Seller) From Market Model
Partition Algorithm Scan Method
Choice Method
1 2 3
…
Agent ID: 002 (Buyer)
(Remaining)
Inheritance: shape
min OPT
Agent ID: 002
Inheritance: attributes
(Buyer)
8
Agent ID: 003 (New)
Figure 6. Flow diagram showing how agents decide to split parcels and then how attributes from agents are inherited in the next time step
optimal value (denoted as OPT in Fig. 6). The minimum optimal value represents the best among 16 weighted values in terms of landscape shape properties of different or alternative partitioning (parcelization) algorithm methods. A detailed description of such a process is included in a relevant paper [45], where the parcelization routine and the partitioning algorithm performance were tested and evaluated against historically observed land-use changes. Using the minimum optimal value information, the parcel is then split, and a new agent is created that owns the new parcel. Attributes from the seller stay (Fig. 6) with the original seller through the next time step after the size of the parcel changes; attributes from the buyer are transferred to the new agent and also remain with the buyer, who “lives” in the simulated client area.
5. MABEL Server The MABEL server acts as a bridge between the MABEL clients and the external behavioral models built and stored in BBNs (Fig. 7). To satisfy the reliability requirement of the communication between the MABEL clients and MABEL server, the network connections are established with Transmission Control Protocol/Internet Protocol (TCP/IP) network protocols over the Internet. The MABEL server first receives agent decision requests from multiple MABEL clients simultaneously. According to an agent’s attributes, such as land-use types, the MABEL server delivers these requests to corresponding behavior models for the decision inference. Last, the MABEL server collects the decision replies from behavior models and sends them back to corresponding agents from different areas (MABEL clients).
In the design of the MABEL server, which is written in Visual Studio.NET C/C++ [46], we employ the multithreaded technique to achieve a parallel processing capability with high execution efficiency. Rather than using a single thread in the single-threaded program, which executes tasks sequentially, each thread in the multithreaded program only executes part of the task. On the other hand, the MABEL server classifies all the tasks by land types and parallelizes multiclass threads in execution. In this way, the MABEL server achieves parallel execution capability with optimal efficiency and scalability. The MABEL server follows two phases: an initialization and an execution phase. In the initialization phase, each proxy thread first loads configuration files, creates its working queue to buffer incoming and unprocessed decision requests from the agents of a specific land type, and initializes communication with the corresponding behavioral model in the BBN by executing routines in the BBN API library. Then, every proxy thread begins to watch its queue for the incoming decision requests. After all of the above initializations are finished, the MABEL server then enters the execution phase and is ready to receive the connect requests from MABEL clients. In the execution phase, at the beginning of every time step, agents in the MABEL client communicate directly with the server to inquire from the corresponding behavioral model in the BBN about what the preferred actions might be. The decision requests that agents send include their up-to-date attributes needed for the decisionmaking process by behavioral models. Before the MABEL client sends agents’ decision requests for inference, it first establishes the communication link with the MABEL server by sending a connection request using the TCP/IP protocol. Upon receiving a connection request from a Volume 81, Number 7
Downloaded from http://sim.sagepub.com at PENNSYLVANIA STATE UNIV on April 14, 2008 © 2005 Simulation Councils Inc.. All rights reserved. Not for commercial use or unauthorized distribution.
SIMULATION 509
Lei, Pijanowski, Alexandridis, and Olson
Figure 7. An illustration of the information flow and main components of the multi-agent-based behavioral economic landscape (MABEL) server in relationship to the Bayesian belief network (BBN) and MABEL clients
MABEL client, the MABEL server assigns a communication link/socket for that client and launches two I/O threads for the input/output operations with that client. The input thread, named the request dispatcher thread (Fig. 7), is responsible for receiving different types of agents’ decision requests from multiple MABEL clients and dispatching these requests into corresponding work queues of the proxy threads by particular land-use/parcel and socioeco-
nomic attributes. In addition, the request dispatcher thread attaches a unique service port number for all decision requests from a particular MABEL client. Therefore, the proxy thread can later send decision responses from the behavioral models to the corresponding client by this port number. On the other hand, the output thread, called the decision collector thread, of a MABEL client keeps waiting for the decision responses forwarded by proxy threads
510 SIMULATION Volume 81, Number 7
Downloaded from http://sim.sagepub.com at PENNSYLVANIA STATE UNIV on April 14, 2008 © 2005 Simulation Councils Inc.. All rights reserved. Not for commercial use or unauthorized distribution.
DISTRIBUTED MODELING ARCHITECTURE OF A MABEL MODEL
D
A G
B E J
C H F
Figure 8. An illustration of the type of behavior that is being modeled using the multi-agent-based behavioral economic landscape (MABEL) distributed modeling architecture (DMA). Locations shown represent different types of areas with diverse parcel shapes
at that service port, so that optimal decisions can be sent back to agents in the MABEL client. With the efficiency and scalability of this design, the MABEL server connects heterogeneous agents, different locations, and behavioral models dynamically. For simulated areas represented by different MABEL clients, the MABEL server is the only bridge to the central decisionmaking component—the BBN. Thus, the MABEL server can easily control and synchronize the temporal execution of the simulations of different areas in MABEL clients. Therefore, we can distribute and partition large simulation tasks over many computers and coordinate the distributed working processes. 6. Simulation Examples Figure 8 shows various GUIs for the MABEL client. The GUI labeled A shows a map of the simulated area (3 by 3 miles) that also includes a portion of a lake located in the lower right corner. The menu labeled B is the main menu that controls program start, stop (freeze simulation), next
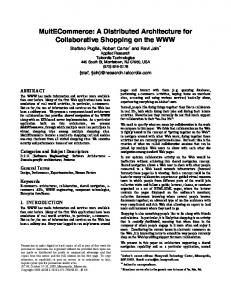
(proceed with next time step interactively), save (save outputs), and quit (stop and exit the program). If users click on a parcel, they are provided with the parcel header information (menu C); selecting the dispStatisticData button on menu C brings up the attribute data (menu D) for the entire agent. Several of the variables in this database are dynamically updated throughout the simulation. Another set of important menus includes the simulation summary charts that are dynamically displayed. These include the number of agents per land use (menu E), number of agents over time (menu F ), and attribute variables grouped according the land-use type (e.g., menu G). Users can also select to have other summary tables or charts displayed (menu H ). Another menu (J ) also allows the user to interact with the maps to zoom in and zoom out or change the frequency that the maps are displayed (speed up and slow down). One of the parameters for the MABEL client is the option of not showing any of the GUIs; this is useful if the simulation requires no user interaction or is placed in a batch mode. Figure 9 shows a screen grab of the MABEL server GUIs. The main GUI (A) contains a list of the MABEL Volume 81, Number 7
Downloaded from http://sim.sagepub.com at PENNSYLVANIA STATE UNIV on April 14, 2008 © 2005 Simulation Councils Inc.. All rights reserved. Not for commercial use or unauthorized distribution.
SIMULATION 511
Lei, Pijanowski, Alexandridis, and Olson
A High Density Residential
B
C
Figure 9. An illustration of the multi-agent-based behavioral economic landscape (MABEL) server graphical user interface (GUI) components. (A) Main GUI, (B) amount of requested server-client activity, and (C) agent proxy activity chart
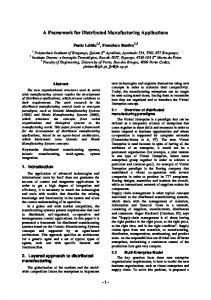
clients that are participating in the simulation. The location (area), user, remote computer name, and the start time and date are shown. The agent BBNs contained in the behavioral models are listed on the right side of this GUI. In addition, the MABEL server also allows the user to select a client and have it display the amount of activity, as reflected in the number of requests from the client to the server (menu B), over the simulation period. Users can also select the agent type and get a proxy activity chart (menu C), shown here for the high-density residential agent. Figure 10 shows results of simulations of the land-use changes over time in three different areas. Data for Michigan (Grand Traverse and Mecosta Counties) on parcels for 3-by-3-mile area frames were developed from paper plat books that were digitized using a GIS for three decadal periods—1970, 1980, and 1990. Data for the Ivondo Region, Mbeere District, Kenya, located along the slopes of Mt. Kenya, are for one time period, indicated as “sim t0 ”; these data were developed from field measurements of ownership boundaries obtained using a Global Positioning System (GPS).
An approach we have been using to assess the performance of our model has been to start our simulation using our oldest parcel and land-use data (e.g., 1970 for the Michigan data) and then execute the simulation for the period containing historical data (i.e., 1970 to 1990) and compare these results to the observed results. Figure 10 shows maps of three such simulations: Grand Traverse County (Michigan), Mecosta County (Michigan), and Ivondo, Kenya. In the two Michigan examples, the number of parcels created was set to the number contained in the historical database; the shapes of these parcels were then analyzed using a variety of spatial tools, such as FRAGSTATS [47]. For the Ivondo region data set, simulations were set to occur over a hypothetical time period because only one time period (year 1996) exists for this area. While the average simulation time sequence in the MABEL model depends on the level of abstraction, agent classes and attributes, and spatial database size, it does not require extensive simulation time runs. In the simulations described above, the average times varied from less than 10
512 SIMULATION Volume 81, Number 7
Downloaded from http://sim.sagepub.com at PENNSYLVANIA STATE UNIV on April 14, 2008 © 2005 Simulation Councils Inc.. All rights reserved. Not for commercial use or unauthorized distribution.
DISTRIBUTED MODELING ARCHITECTURE OF A MABEL MODEL
Grand Traverse County, Michigan, USA
Sim LU, 1980
Sim LU, 1990
Real LU, 1980
Real LU, 1990
Real LU, 1970
Mecosta County, Michigan, USA
Sim LU, 1980
Sim LU, 1990
Real LU, 1980
Real LU, 1990
Real LU, 1970
Ivondo Region, Kenya, East Africa
Sim to
Sim to+20
Sim to+10
Sim to+30
Figure 10. Samples of multi-agent-based behavioral economic landscape (MABEL) simulation results and real temporal change comparisons in three different geographic areas Volume 81, Number 7
Downloaded from http://sim.sagepub.com at PENNSYLVANIA STATE UNIV on April 14, 2008 © 2005 Simulation Councils Inc.. All rights reserved. Not for commercial use or unauthorized distribution.
SIMULATION 513
Lei, Pijanowski, Alexandridis, and Olson
minutes in the 3-by-3-mile areas (Grand Traverse Counties and Mecosta Counties) for 100 agent time steps to less than 5 minutes for the Ivondo region in Kenya (for 30 time steps). In more thorough model run simulations (e.g., in Alexandridis and Pijanowski [45], 8 blocks of 3 × 3 miles areas were used, in two regions, for 100 time steps by 100 Monte Carlo replication runs for 16 parcelization routines: more than 6000 replication experiments in areas eight times larger than the Grand Traverse example described above), the total simulation time remained well below a 10-hour threshold of computation time. Increasing the complexity of the models’ assumptions (e.g., adding more detailed agent classes, nonbase agents, and more complex BBN models; comparing more complex parcelization routines; adding more complex market model rules; or increasing the spatial landscape complexity) would evidently increase the average computation time of the simulation.
data, integrate, and process spatial data; and (3) incorporating the ability of the server to synchronize all clients in the DMA environment so that large-scale inputs such as climate change and macroeconomic dynamics can be introduced. In addition, we plan to use the MABEL DMA in a workshop setting so that groups of stakeholders interested in land-use changes can interact with the simulation simultaneously.
The authors wish to thank the following agencies for funding of this work: National Science Foundation Biocomplexity Program (BE/CNH 0308420), National Science Foundation Water Cycle Research Program (WCR 0233648), Great Lakes Fisheries Trust, EPA STAR Biological Classification Program, and the Michigan State University Research Foundation.
7. Discussion
9. References
In this article, we introduced a DMA framework and its application to our MABEL model. We described the types of agents that are involved in the land-use change model, the way in which we simulate behaviors using Bayesian belief networks, and how the structure of the MABEL client and MABEL server components allow for multiple simulations of parallel locations; we also presented sample graphical user interfaces of the client, server, and BBN. The key component within the DMA, the client-server architecture, in the MABEL system allows us to simultaneously simulate land-use change over large regions in an efficient and scalable way. Moreover, the separation of simulation locations and agents’ behavioral models simplifies the work required to parameterize these models for taskspecific use in the distributed modeling environment and greatly eliminates the translation from the intent or conceptualization of a behavior model to its implementation. Modelers can easily create, assess, and evaluate agents’ behavior models in the external model tool, while the simulation builders (programmers) can focus on organizing and scheduling agents’ activity for specific simulation scenarios. We developed a MABEL client in the Swarm simulation environment, a software package for multiagent simulation of complex systems. MABEL clients can execute in either normal GUI mode or batch mode. In normal GUI mode, agents in a MABEL client are able to dynamically draw (on the screen) and update themselves in the simulated “world” and respond to users’ inquiries to view an agent’s landuse/parcel and socioeconomic attributes anytime during the simulation. While in batch mode, the MABEL client has no GUI, so that it can be faster and simple to run. Future work related to DMA and our MABEL model will include (1) standardizing the interface between MABEL clients and the MABEL server with xml extraction and manipulation tools; (2) developing tighter linkages to GIS through softwareAPIs that would query, import/export
[1] Holland, John H. 1992. Adaptation in natural and artificial systems: An introductory analysis with applications to biology, control, and artificial intelligence. Cambridge, MA: MIT Press. [2] Bacon, P. J., J. D. Cain, and D. C. Howard. 2002. Belief network models of land manager decisions and land use change. Journal of Environmental Management 65 (1): 1-23. [3] Murch, Richard, and Tony Johnson. 1999. Intelligent software agents. Upper Saddle River, NJ: Prentice Hall. [4] Epstein, Joshua M., and Robert Axtell. 1996. Growing artificial societies: Social science from the ground up. Washington, D.C.: Brookings Institution Press. [5] Axelrod, R. M. 1997. The complexity of cooperation: Agent-based models of competition and collaboration. Princeton, NJ: Princeton University Press. [6] Riolo, Rick L., Michael D. Cohen, and Robert Axelrod. 2001. Evolution of cooperation without reciprocity. Nature 414:441-3. [7] Harper, Steven J., James D. Wstervelt, and Ann-Marie Trame. 2002. Management application of an agent-based model: Control for cowbirds at the landscape scale. In Integrating geographic information systems and agent-based modeling techniques for simulating social and ecological processes, edited by R. H. Gimblett, 105-24. New York: Oxford University Press. [8] DeAngelis, Donald L., Wolf M. Mooij, M. Philip Nott, and Robert Bennetts. 2001. Individual-based models: Tracking variability among individuals. In Modeling in natural resource management: Development, interpretation, and application, edited by T. M. Shenk andA. B. Franklin, 171-96. Washington, D.C.: Island Press. [9] Holland, J., and J. Miller. 1991. Artificial adaptive agents in economic theory. American Economic Review 81:365-70. [10] Parker, Dawn C., and Vicky Meretsky. 2004. Measuring pattern outcomes in an agent-based model of edge-effect externalities using spatial metrics. Agriculture, Ecosystems & Environment 101 (23): 233-50. [11] Alexandridis, Konstantinos T., and Bryan C. Pijanowski. 2002. Multi agent-based environmental landscape (MABEL)—An artificial intelligence simulation model: Some early assessments. Staff Paper No. 2002-09, Department of Agricultural Economics, Michigan State University, Lansing. [12] Alexandridis, Konstantinos T. and Bryan C. Pijanowski (2005). A multi agent-based behavioral economic landscape (MABEL) model of land use change. Manuscript submitted for publication. [13] Swarm Intelligence Group. 2000. SWARM (version 2.1.1) [Computer software]. www.swarm.org [14] North, Michael, Alan Borning, and Paul Waddell. 2000. An extensible, modular architecture for simulating urban development,
8. Acknowledgments
514 SIMULATION Volume 81, Number 7
Downloaded from http://sim.sagepub.com at PENNSYLVANIA STATE UNIV on April 14, 2008 © 2005 Simulation Councils Inc.. All rights reserved. Not for commercial use or unauthorized distribution.
DISTRIBUTED MODELING ARCHITECTURE OF A MABEL MODEL
[15] [16] [17]
[18]
[19] [20] [21] [22] [23]
[24] [25] [26]
[27]
[28]
[29] [30] [31] [32] [33] [34] [35]
transportation, and environmental impacts. Technical Report No. 2000-12-01, Department of Computer Science and Engineering, University of Washington, Seattle. Epstein, Larry G., and Tan Wang. 1996. “Beliefs about beliefs” without probabilities. Econometrica: Journal of the Econometric Society 64 (6): 1343-73. El-Gamal, Mahmoud A., and David M. Grether. 1995. Are people Bayesian? Uncovering behavioral strategies. Journal of the American Statistical Association 90 (432): 1137-45. Parker, Dawn C., S. M. Manson, M. A. Janssen, M. Hoffmann, and P. Deadman. 2003. Multi-agent systems for the simulation of landuse and land-cover change: A review. Annals of the Association of American Geographers 93 (2): 314-37. Pijanowski, Bryan C., Bradley Shellito, Snehal Pithadia, and Konstantinos Alexandridis. 2002b. Forecasting and assessing the impact of urban sprawl in coastal watersheds along eastern Lake Michigan. Lakes and Reservoirs: Research and Management 7 (3): 271-85. Veldkamp, A., and E. F. Lambin. 2001. Predicting land-use change [editorial]. Agriculture, Ecosystems & Environment 85 (1-3): 1-6. Bockstael, Nancy. 1996. Modeling economics and ecology: The importance of a spatial perspective. American Journal of Agricultural Economics 78 (5): 1168-81. Clarke, K. C., S. Hoppen, and L. Gaydos. 1997. A self-modifying cellular automaton model of historical urbanization in the San Francisco Bay area. Environment and Planning B 24:247-61. Batty, M., Y. Xie, and Z. Sun. 1999. Modeling urban dynamics through GIS-based cellular automata. Computers, Environment and Urban Systems 23 (3): 205-33. Clarke, K. C. 2004. Loose-coupling a cellular automation model and GIS: Long-term urban growth prediction for San Francisco and Washington/Baltimore. International Journal of Geographic Information Science 12 (7): 699-714. White, R., and G. Engelen. 2000. High-resolution integrated modelling of the spatial dynamics of urban and regional systems. Computers, Environment and Urban Systems 24 (5): 383-400. Waddell, Paul. 2002. UrbanSim: Modeling urban development for land use, transportation and environmental planning. Journal of the American Planning Association 68 (3): 297-314. Pontius, Gil R., Jr. 2002. Statistical methods to partition effects of quantity and location during comparison of categorical maps at multiple resolutions. Photogrammetric Engineering & Remote Sensing 68 (10): 1041-9. Bose, Utpal, and David B. Paradice. 1999. The effects of integrating cognitive feedback and multi-attribute utility-based multicriteria decision-making methods in GDSS. Group Decision and Negotiation 8 (2): 157-82. Cioffi-Revilla, Claudio, and Nicholas Gotts. 2003. Comparative analysis of agent-based social simulations: GeoSim and FEARLUS models. Journal of Artificial Societies and Social Simulation 6 (4): 23. Irwin, Elena, and Nancy Bockstael. 2002. Interacting agents, spatial externalities, and the evolution of residential land use patterns. Journal of Economic Geography 2 (1): 31-54. Evans, Tom P., and Hugh Kelley. 2004. Multi-scale analysis of a household level agent-based model of landcover change. Journal of Environmental Management 72 (1-2): 57-72. Sebastiani, Paola, and Marco Ramoni. 2001. On the use of Bayesian networks to analyze survey data. Research in Official Statistics 4 (1): 53-64. Berikov, Vladimir, and Alexander Litvinenko. 2003. The influence of prior knowledge on the expected performance of a classifier. Pattern Recognition Letters 24 (15): 2537-48. Gammerman, A. 1995. Probabilistic reasoning and Bayesian belief networks. Henley-on-Thames, UK: A. Waller/Unicom. Bratman, M. E. 1987. Intention, plans, and practical reason. Cambridge, MA: Harvard University Press. Rao, Anard S., and Michael P. Georgeff. 1995. BDI agents: From theory to practice. In Proceedings of the First International Conference on Multi-Agent Systems (ICMAS-95), San Francisco.
[36] Kinny, David, and Michael Georgeff. 1996. Modelling and design of multi-agent systems. In Intelligent Agents III: Proceedings of the Third International Workshop on Agent Theories, Architectures, and Languages (ATAL’96), 1-20. Lecture Notes in Artificial Intelligence. Heidelberg: Springer-Verlag. [37] Pijanowski, B. C., D. G. Brown, G. Manik, and B. Shellito. 2002. Using artificial neural networks and GIS to forecast land use changes: A land transformation model. Computers, Environment and Urban Systems 26 (6): 553-75. [38] Barron, F. Hutton. 1988. Limits and extensions of equal weights in additive multiattribute models. Acta Psychologica 68 (1-3): 14152. [39] Jimenez, Antonio, Sixto Rios-Insua, and Alfonso Mateos. 2003. A decision support system for multiattribute utility evaluation based on imprecise assignments. Decision Support Systems 36 (1): 6579. [40] Russell, Stuart J., and Peter Norvig. 2003. Artificial intelligence: A modern approach. 2nd ed. Englewood Cliffs, NJ: Prentice Hall. [41] Therrien, Sakura S. 2003. A Bayesian model to incorporate human factors in the commanders’ decision making. Paper presented at the Hawaii International Conference on Statistics and Related Fields, June 5-8, Honolulu, HI. [42] Adams, Keith, John Lamont III, Ralph Patterson, Marvin Choo, Natasha Khan, and Jesse Smith. 2002. Defining procedures for decision analysis. Algorithms Report No. Engr 466-02A, Iowa State University, Ames. [43] Alexandridis, Konstantinos, Bryan C. Pijanowski, and Zhen Lei. 2003. Simulating land-use entelechy using multi agent-based behavioral economic landscape (MABEL) model. Paper presented at the “Agent 2003” Conference, October 4, Gleacher Center, Chicago. [44] Stevens, Michael. 2003. Bayes++: Open source Bayesian filtering classes (version 5) [Computer software]. Sydney: Australian Centre for Field Robotics, University of Sidney. http://bayesclasses.sourceforge.net/Bayes++.html [45] Alexandridis, Konstantinos, Bryan C. Pijanowski, and Zhen Lei. Assessing multi-agent parcelization performance in the MABEL simulation model using Monte-Carlo replication experiments. Environment & Planning B: planning and design, (in revision). [46] Microsoft Corp. 2003. Microsoft Visual Studio.NET. http://msdn. microsoft.com/vstudio/ [47] McGarigal, K., S. A. Cushman, M. C. Neel, and E. Ene. 2002. Fragstats: Spatial pattern analysis program for categorical maps (version 3.3) [Computer software]. Amherst: University of Massachusetts. www.umass.edu/landeco/research/ fragstats/fragstats.html. [48] Norsys Software Corp. (2004). Netica VB/C++API. Electronic Software: http://www.norsys.com.
Zhen Lei is currently an MBA candidate at the Krannert School of Management concentrating in Operation and Technology Management and Finance. Bryan C. Pijanowski is an associate professor in the Department of Forestry and Natural Resources and a member of the Purdue Interdisciplinary Center for Ecological Sustainability, the Purdue Climate Change Research Center and the Discovery Park Center for the Environment. Konstantinos Alexandridis is currently a PhD candidate in the Department of Forestry and Natural Resources specializing in agent-based modeling and land use change. Jennifer Olson is an assistant professor in the Department of Geography and a Senior Scientist at the International Livestock Research Institute in Nairobi, Kenya.
Volume 81, Number 7
Downloaded from http://sim.sagepub.com at PENNSYLVANIA STATE UNIV on April 14, 2008 © 2005 Simulation Councils Inc.. All rights reserved. Not for commercial use or unauthorized distribution.
SIMULATION 515