[7] Nouranian, S., Toghiani, H., Lacy, T.E., and Pittman, C.U., “Viscoelastic ... http:/
/www.lms.polytechnique.fr/dynamique/greef/web4034_david.html, 2005.
High Strain Rate Behavior of Carbon Nanofiber Reinforced Vinyl Ester John W. Hutchins1 Mississippi State University, Mississippi State, MS 39762 John Sisti2 The University of Buffalo, The State University of New York, Buffalo, NY 14260 Thomas E. Lacy, Jr.3 Mississippi State University, Mississippi State, MS 39762 Sasan Nouranian4 and Hossain Toghiani5 Mississippi State University, Mississippi State, MS 39762 and Charles U. Pittman, Jr.6 Mississippi State University, Mississippi State, MS 39762
The dynamic uniaxial compressive response of neat vinyl ester resin with and without the addition of a dispersing agent and vinyl ester reinforced with both 0.50 and 1.00 parts (by weight) per hundred (parts of) resin of vapor grown carbon nanofibers was analyzed using a classical split Hopkinson pressure bar at strain rates ranging from 750 s-1 to 2350 s-1. Dynamic force equilibrium was verified at all strain rates in order to validate the small strain data and the observed dynamic elastic modulus. Both the effects of the dispersing agent and the nanofiber loading level conducive for optimal yield stress and stiffness were shown to be highly strain rate dependent. Due to the viscoelastic nature of the vinyl ester resin/matrix, the differences in the observed dynamic stress-strain response (notably yield stress and stiffness) of all four material configurations likely was attributed to the coupled effect of the strain rate and the associated internal temperature rise experienced during split Hopkinson pressure bar tests.
Nomenclature DA
= = phr = SHPB = t* = VE = (VG)CNF =
dispersing agent elastic strain value at which dynamic force equilibrium is reached parts (by weight) per hundred (parts of) resin split Hopkinson pressure bar time at which dynamic force equilibrium is reached vinyl ester (resin/matrix) (vapor grown) carbon nanofiber
1
Graduate Research Assistant, Department of Aerospace Engineering,
[email protected] Undergraduate Student, Department of Mechanical and Aerospace Engineering,
[email protected], AIAA President at SUNY at Buffalo Associate Professor, Department of Aerospace Engineering,
[email protected], AIAA Associate Fellow 4 Graduate Research Assistant, Dave C. Swalm School of Chemical Engineering,
[email protected] 5 Associate Professor, Dave C. Swalm School of Chemical Engineering,
[email protected] 6 Professor, Department of Chemistry,
[email protected] 2 3
1 American Institute of Aeronautics and Astronautics
I. Introduction
R
ECENT advances in the manufacturability of polymer nanocomposites and rising demands for cost-effective, weight-critical structural components in both the automotive and aerospace industries have inspired the incorporation of polymer nanocomposites into primary structural components as a means of reducing weight without sacrificing structural integrity. Recent work1 has shown that a vacuum-assisted resin transfer molding (VARTM) technique has been successfully employed to infuse continuous glass fiber/thermoset resin systems with small amounts (1% by weight) of carbon nanofiber (CNF) reinforcements to significantly improve the mode I delamination resistance of the resulting laminate. Others2 have used pultrusion to fabricate laminates comprised of a nanoclay reinforced thermoplastic resin system coupled with continuous E-glass fibers that exhibited excellent improvements in both longitudinal compressive strength and in-plane shear strength. Also, nominal improvements in the longitudinal tensile strength in comparison to the baseline (no nano-reinforcements) system occurred with as little as 3% (by weight) nanoclay reinforcements. The motivation for these works1,2 was to achieve significant improvements to the matrix-dominated properties of traditional polymer matrix/continuous fiber composite systems with the addition of a small weight percentage (compared to the continuous fiber phase) of nano-phased reinforcements. However, the current work is in its initial phase, which focuses on improvements in the dynamic compressive response of vinyl ester resin (VE) reinforced with vapor-grown carbon nanofibers (VGCNFs) with plans to incorporate this type of nano-phased resin system into three-phase composites (polymer resin, nanoreinforcement, and continuous reinforcement) similar to those investigated in Ref. 1. Therefore, the high strain rate response of these polymer nanocomposite materials must be characterized at strain rates consistent with crash/impact events in automotive and aerospace applications in order to provide experimental validation for damage tolerance models for polymer nanocomposites and subsequent three-phase composites exposed to extreme dynamic loadings. Recent work by Plaseied and Fatemi3 characterized the mechanical response of CNF reinforced VE under quasi-static loading rates. This work analyzed the effects of the following parameters on the tensile behavior of CNF-VE: quasi-static strain rates, CNF fiber type (oxidized and specially functionalized), CNF weight fraction, temperature, humidity, curing schedule, and styrene content of the resin. Meanwhile, others4,5 have focused on characterizing the dynamic behavior of pure resins at strain rates consistent with those obtained using a classical split Hopkinson pressure bar (SHPB) as a means to deduce information about the high strain rate impact resistance of composites with similar resin systems. A plethora of work has been done to characterize the rate-dependent response of continuous fiber composites, which has sometimes produced contradictory results, but the ratedependent response of randomly oriented, short fiber composites has yet to be fully developed6. A classical SHPB apparatus was employed to investigate the response of neat VE resin (with and without the addition of a dispersing agent) as well as VE reinforced with 0.50 and 1.00 parts (by weight) per hundred resin (phr) of VGCNF at strain rates of 750 s-1, 1550 s-1, and 2350 s-1. The rate-dependent behavior of the peak yield stress of the each material was characterized at strain rates between 750 s-1 and 2350 s-1. The relative performance of all four material configurations was evaluated at each strain rate. Furthermore, careful validation of the dynamic force equilibrium was established in order to validate any assessments of the small strain data or the dynamic modulus.
II. Specimen Fabrication A total of four distinct material configurations were used for the proposed high rate testing program: neat VE resin, VE resin with a dispersing agent (DA) chemical (neat VE-DA), VE resin reinforced with 0.50 phr VGCNF (VE-0.50 phr VGCNF), and VE resin reinforced with 1.00 phr VGCNF (VE-1.00 phr VGCNF). Derakane 411-400, an inexpensive epoxy VE resin from Ashland Co. with low styrene content (33%), was used as the baseline resin system for all four material configurations studied, while PR-24-XT-LHT pristine (unoxidized) VGCNFs from Applied Sciences Inc. were used as the nano-reinforcement phase for the two nanocomposite configurations. Although the formulation procedure was consistent with that developed in Ref. 7 (except for step 6), it is outlined below for reference. The following steps describe the general procedure for specimen preparation: 1) Add 100 g of VE resin. 2) Add 0.2 g of 6% cobalt naphthenate promoter to initiate the polymerization reaction. 3) Add 0.2 g of BYK-A 515 air release agent followed by 0.2 g of BYK-A 555 air release agent to disseminate any air bubbles trapped in the resin after the mixing processes. *4) Add BYK-9076 dispersing agent (DA) in a 1:1 ratio (by weight) with respect to the VGCNFs. In the case for the VE resin with DA, 1.0 g of DA was used in order to be consistent with the same amount 2 American Institute of Aeronautics and Astronautics
**5) **6) **7) 8) 9) 10) 11) 12)
of DA present in the 1.00 phr VE-VGCNF specimens. DA was used in both nanocomposite configurations as well as one of the configurations of pure VE resin. Add either 0.50 g or 1.00 g of pristine VGCNFs Mix with a high shear mixer for 15 min at 4000 rpm. Mix with ultrasonication for one hour at constant amplitude of 20% (to avoid overheating the mixture). Add 1.00 g of methyl ethyl ketone peroxide (MEKP) curing agent hardener. Degas the mixture using a vacuum pump to remove all air bubbles. Pour the mixture into a mold containing ten 38.10 mm tall x 12.70 mm diameter cylindrical cavities. Cure in a pre-heated oven for five hours at 60 C followed by two hours at 120 C. Cut the cured samples into 6.35 mm long specimens consistent with the optimal specimen geometry to reduce inertial effects in SHPB experiments8. * Step 4 was skipped for the neat VE resin specimens with no DA added. ** Steps 5-7 were only used for the nanocomposite specimens.
The neat resin containing the DA was prepared to investigate the effect of the DA on the properties of the neat resin because previous work7 showed that dynamic mechanical analysis (DMA) revealed degraded stiffness properties at lower weight fractions of VGCNF when compared to nanocomposite specimens without DA. However, this trend was reversed at higher weight fractions.
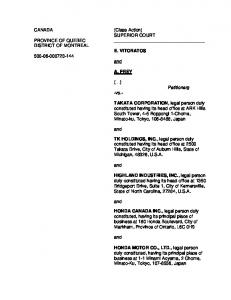
III. Testing Method A classical SHPB device shown in Fig. (1) was used to test specimens of all four material configurations at strain rates of 750 s-1, 1550 s-1, and 2350 s-1. In specimen preparation step 12, an optimal specimen aspect ratio, L/D = 0.5, where L and D are the respective length and diameter of the cylindrical SHPB specimens, was used to reduce inertial effects and to ensure a uniaxial stress state in the specimen. However, the optimal specimen geometry conducive for minimizing frictional effects (L/D ~ 1.5-2.0) does not coincide with the optimal specimen geometry for reducing inertial effects (L/D ~ 0.5). Thus, a thin film of lubricating grease was used at the specimenbar interfaces to reduce the frictional effects and further ensure a uniaxial stress state in the specimen. This technique proved to be useful as minimal specimen barreling was observed in the recovered post-test specimens. Five tests were conducted at each target strain rate for all four material configurations. The true strain in the specimen was plotted against the time duration of the experiment (in seconds) as shown in Fig. (2a), and a linear trendline was fit through the data from an elastic strain value of 2% to the end of the valid strain data (just before the bars separate and the specimen falls). The coefficient of the resulting trendline then gives the strain rate of that particular test, while the R2 value tells how well the trendline fits the experimental data points. Therefore, a perfectly constant strain rate throughout the duration of the test corresponds to R2 = 1. The raw stress data for the three tests closest to the target strain rate (with a maximum allowable deviation of ±50 s-1 from the target strain rate) for each material configuration was averaged at incrementally constant values of strain (a strain increment of 0.001 was used for the averaging algorithm). Very little experimental scatter was seen between the individual experiments and the averaged values, so a single averaged curve is used to characterize the series of tests for each material configuration at all strain rates investigated. Al7075 T651 aluminum striker, incident, and transmit bars (see Fig. (1)) were used in order to obtain an appropriate impedance mismatch at the bar-specimen interface. This procedure gave accurate measurements of the incident, transmit and reflected waves consistent with those shown in Fig. (2b). The striker bar measured 38.1 mm (1.5 in.) in diameter and 605.0 mm (1.5 ft) long. Meanwhile the incident bar, and the transmit bar each measured 38.1 mm (1.5 in.) in diameter with lengths of 1829.0 mm (6 ft) and 914.0 mm (3 ft), respectively. The Al7075 T651 bars were found to have a wave speed of 5060m/s, a mass density of 2810 kg/m3, and a Poisson’s ratio of 0.3. No pulse shaper was employed for these experiments; however, Figs. (3a-c) show that the dynamic force equilibrium was established at a time corresponding to an elastic strain value of * = 0.005 for a given strain rate of 750 s-1. Similar arguments to those shown in Figs. (3a-c) reveal that the dynamic force equilibrium was established at a time corresponding to elastic strain values of 0.002 and 0.004 at strain rates of 1550 s-1 and 2350 s-1, respectively. Therefore, it is believed that the elastic small strain data as well as the dynamic elastic modulus values are accurate and reliable. Furthermore, a complete three dimensional elastic wave dispersion correction9 was used to analyze the data in order account for geometric (finite length incident/transmit bars) and/or material configurations (nonisotropic specimens) that deviate from the traditional one-dimensional wave propagation assumption predominant in SHPB theory. 3 American Institute of Aeronautics and Astronautics
IV. Rate-Dependent Behavior of VE-VGCNF Nanocomposites Figures (4a-d) show the average stress-strain response of each material configuration at strain rates of 750 s-1, 1550 s-1, and 2350 s-1. Figure (4a) shows that the neat VE resin displays a slight increase in both yield stress and stiffness across the full range of strain rates. The yield stress and stiffness are plotted against strain rate in Figs. (5ad). Figure (5a) shows that the neat VE resin exhibits a linear relationship between both the yield stress/dynamic modulus and strain rate over the range of strain rates investigated in this study. Meanwhile, Figs. (5b-d) exhibit a linearly decreasing relationship between yield stress and strain rate for all three material configurations containing the DA: neat VE-DA, VE-0.50 phr VGCNF, and VE-1.00 phr VGCNF. Furthermore, it was noted that at these elevated strain rates the recovered post-test specimens displayed a significant temperature rise that was easily observable by touch; however, this extreme temperature rise proved to be significantly more noticeable at the two highest strain rates. Therefore, the decrease in yield stress with increasing strain rate for the three material configurations containing the DA is attributed to a thermally induced softening effect that seems to be induced by the presence of the DA. However, this work is still progressing, and further experiments need to be performed in order to characterize the strain rate/temperature relationship across a consistent range of strain rates. As Figs. (6a-b) show, the neat VE resin with 1.00 phr DA (neat VE-DA) showed a response very similar to the neat VE resin with no DA at strain rates of 750 s-1 and 1550 s-1 although the neat VE-DA had a slightly lower stiffness and a nominally higher yield strength at both strain rates. However, Table (1) and Fig. (5c) show that at the highest strain rate of 2350 s-1 the neat VE-DA exhibits drastically lower properties than the neat VE resin with no DA for both yield strength and stiffness. This result suggests that the presence of the DA acts as a plasticizer to degrade the resulting mechanical properties of the VE-VGCNF nanocomposites. Across the entire range of strain rates investigated, the VE resin reinforced with 0.50 phr VGCNF (VE-0.50 phr VGCNF) shows the overall highest yield stress (197.2 MPa) at 750 s-1 and the highest overall stiffness (5.30 GPa) at 1550 s-1. Furthermore, as the strain rate increased from 750 s-1 to 1550 s-1, Fig. (4c), Table (2a), and Fig. (6c) show that the VE-0.50 phr VGCNF exhibits a nominal decrease in yield strength but a significant increase (~26%) in stiffness. However, both the yield stress and stiffness of VE-0.50 phr VGCNF decreased significantly (~12% and ~18%, respectively) as the strain rate increased from 1550 s-1 to 2350 s-1. These results suggest that the presence of the well dispersed VGCNF dominate the mechanical response at the two lower strain rates, but at the highest strain rate, the presence of the DA degrades the properties more than the presence of the VGCNF increases the properties. The VE resin reinforced with 1.00 phr VGCNF (VE-1.00 phr VGCNF) yielded the most non-intuitive results of all the material configurations considered. Table (1) and Figs. (5a-c) reveal that the VE-1.00 phr VGCNF shows the lowest stiffness at all of the dynamic strain rates investigated. Therefore, transmission electron microscopy (TEM) images from both of the nanocomposite specimens were used to help characterize the dispersion of the VGCNFs. Figs. (7a-b) show that the VE-1.00 phr VGCNF specimens displayed noticeably larger and denser agglomerations of clustered VGCNFs than the VE-0.50 phr VGCNF specimens. Furthermore, it is not apparent whether or not all of the VGCNFs within the agglomerations show in Fig. (7b) for the VE-1.00 phr VGCNF specimens were completely wetted with resin. Therefore, it is proposed that the interior portions of the VGCNF agglomerations that may not be fully wetted with resin may act as microvoids causing a reduction in stiffness properties in the bulk nanocomposite response for the VE-1.00 phr VGCNF configuration. Thus, due to the poorer level of dispersion observed in the VE-1.00 phr VGCNF specimens, the higher loading level of VGCNFs actually produced a lower yield stress and lower dynamic stiffness. Therefore, these results agree (at least in trend) with the published nanocomposite literature1-3 that greater improvements in overall mechanical properties of the nanocomposite specimens can be observed at a material system dependent optimal configuration at relatively low weight fractions of nanoreinforcements. Furthermore, subsequent additions of nanoreinforcements actually serve to degrade the mechanical properties of the resulting nanocomposite systems.
V. Conclusion The dynamic uniaxial compressive response of VE-VGCNF nanocomposites was investigated across a range of strain rates consistent with those experienced in automotive and aerospace impact/crash events. The dynamic force equilibrium was verified at all strain rates, and the small strain data/dynamic elastic modulus was subsequently validated through the dynamic force equilibration. The observed mechanical properties proved to be moderately rate dependent at the two lower strain rates and highly rate dependent at the highest strain rate. The presence of the DA degraded the properties of both the neat VE resin and the nanocomposite specimens at the highest strain rate investigated suggesting that the strain rate/temperature relationship proved to dominate the observed mechanical response at the highest strain rate. Finally, the optimal level of VGCNF loading proved to be highly dependent on the dispersion characteristics observed through TEM images, and the higher level of VGCNF loading proved to 4 American Institute of Aeronautics and Astronautics
degrade the observed response. This work still needs to progress towards characterizing the strain rate/temperature relationship across a similar range of strain rates and quantifying the degradation of properties due to the DA at temperatures consistent with those experienced during the SHPB tests at the highest strain rates.
Acknowledgments The authors from Mississippi State University would like to thank the Department of Energy for sponsoring this work under grant DE-FC26-06NT42755. Furthermore, J. Sisti graciously thanks the National Science Foundation Research Experience for Undergraduates program for sponsoring his work on this project.
References
[1] Sadeghian, R., Gangireddy, S., Minaei, B., and Hsiao, K.-T. “Manufacturing Carbon Nanofibers Toughened Polyester-glass Fiber Composites Using Vacuum Assisted Resin Transfer Molding.” Composites: Part A 37: 1787-1795, 2006. [2] Hussain, F., Roy, S., Narasimhan, K., Vengadassalam, K., and Lu, H., “E-Glass– Polypropylene Pultruded Nanocomposite: Manufacture, Characterization, Thermal and Mechanical Properties,” 20: 411-434, 2007. [3] Plaseied, A., Fatemi, A. “Mechanical Properties and Deformation Behavior of Carbon Nanofiber Polymer Composite Material,” Proceedings of Multifunctional Nanocomposites, 2006, Honolulu, HI. [4] Chen, W., Zhou, B., “Constitutive Behavior of Epon 828/T-403 at Various Strain Rates,” Mechanics of TimeDependent Materials 2: 103–111, 1998. [5] Tao, X., Bin, Y., Jie, X., Xian-jian, X., Kai, Z., and Ming-shong, M., “Effect of Strain Rate on Compressive Behavior of Vinyl Ester Resin Casting,” Materials Engineering, 5: 63-72, 2006. [6] Jacob, G.C., Starbuck, J.M., Fellers, J.F., Simunovic, S., Boeman, R.G., “Strain Rate Effects on the Mechanical Properties of Polymer Composite Materials,” Journal of Applied Polymer Science, 94: 296-301, 2004. [7] Nouranian, S., Toghiani, H., Lacy, T.E., and Pittman, C.U., “Viscoelastic Properties of Vapor-Grown Carbon Nanofiber/Vinyl Ester Nanocomposites,” Proceedings of SAMPE ’09. [8] Gama, B.A., Lopatnikov, S.L., and Gillespie, Jr., J.W., “Hopkinson Bar Experimental Technique: A Critical Review,” Appl Mech Rev, 57-4: 223-250, 2004. [9] Gary G. DAVID Instruction manual, Palaiseau, France, http://www.lms.polytechnique.fr/dynamique/greef/web4034_david.html, 2005.
5 American Institute of Aeronautics and Astronautics
Figure 1. Split-Hopkinson pressure bar (SHPB) schematic
6 American Institute of Aeronautics and Astronautics
Figure 2. (a) Strain-time history response of the specimens used to calculate the strain rate of each test and (b) elastic pressure pulse waves for a uniaxial compressive SHPB test
7 American Institute of Aeronautics and Astronautics
Figure 3. Validation of dynamic force equilibrium for SHPB tests at 750 s-1 through (a) establishing the average load-time response in the bars, (b) correlating the time at which the dynamic force equilibrium is established to the corresponding strain value, and (c) verifying that the strain value at which dynamic force equilibrium occurs corresponds to the elastic small strain regime in the stress-strain response
8 American Institute of Aeronautics and Astronautics
(b) 250
250
200
200
Stress, MPa
Stress, MPa
(a)
150 100 Neat VE - 750/s Neat VE - 1550/s Neat VE - 2350/s
50
150 100
0
0 0.0
0.2 0.4 Strain, mm/mm
0.6
0.0
250
(d) 250
200
200
Stress, MPa
(c)
Stress, MPa
Neat VE-DA - 750/s Neat VE-DA - 1550/s Neat VE-DA - 2350/s
50
0.2 0.4 Strain, mm/mm
0.6
150
150 100
100
VE-0.50 phr VGCNF - 750/s VE-0.50 phr VGCNF - 1550/s VE-0.50 phr VGCNF - 2350/s
50 0
VE-1.00 phr VGCNF - 750/s VE-1.00 phr VGCNF - 1550/s VE-1.00 phr VGCNF - 2350/s
50 0
0.0
0.2 0.4 Strain, mm/mm
0.6
0.0
0.2 0.4 Strain, mm/mm
0.6
Figure 4. Dynamic response of (a) pure vinyl ester (VE) resin with no additives (Neat VE), (b) VE resin with a dispersing agent (DA) chemical added (Neat VE-DA), (c) VE resin reinforced with 0.50 parts (by weight) per hundred (parts of) resin (phr) of vapor grown carbon nanofibers (VGCNF) (VE-0.50 phr VGCNF) and (d) VE resin reinforced with 1.00 phr of VGCNF (VE-1.00 phr VGCNF) at strain rates of 750 s-1, 1550 s-1 and 2350 s-1
9 American Institute of Aeronautics and Astronautics
5 4 3 2 Yield Strength Elastic Modulus 0
1
1000 2000 Strain Rate, s-1
Yield Stress (MPa)
6
0 3000
6 5 4 3 2 Yield Strength Elastic Modulus 0
1000 2000 Strain Rate, s-1
1 0 3000
(d)
5 4 3 2 Yield Strength Elastic Modulus
1
Yield Stress, MPa
6 Elastic Modulus, GPa
200 175 150 125 100 75 50 25 0
200 175 150 125 100 75 50 25 0
6 5 4 3 2 Yield Strength Elastic Modulus
1
Elastic Modulus, GPa
(c)
Yield Stress, MPa
200 175 150 125 100 75 50 25 0
Elastic Modulus, GPa
(b) 200 175 150 125 100 75 50 25 0
Elastic Modulus, GPa
Yield Stress, MPa
(a)
0 1000 2000 3000 0 1000 2000 Strain Rate, s-1 Strain Rate, s-1 Figure 5. Strain rate dependent behavior of both yield stress and elastic modulus for (a) pure vinyl ester (VE) resin with no additives (Neat VE), (b) VE resin with a dispersing agent (DA) chemical added (Neat VE-DA), (c) VE resin reinforced with 0.50 parts (by weight) per hundred (parts of) resin (phr) of vapor grown carbon nanofibers (VGCNF) (VE-0.50 phr VGCNF) and (d) VE resin reinforced with 1.00 phr of VGCNF (VE-1.00 phr VGCNF) 0 3000
0
10 American Institute of Aeronautics and Astronautics
(a)
(b) 200
150 100 Neat VE - 750/s Neat VE-DA - 750/s VE-0.50 phr VGCNF - 750/s VE-1.00 phr VGCNF - 750/s
50 0
Stress (MPa)
Stress (MPa)
200
150 100 Neat VE - 1550/s Neat VE-DA - 1550/s VE-0.50 phr VGCNF - 1550/s VE-1.00 phr VGCNF - 1550/s
50 0
0.00
0.05 0.10 0.15 Strain (mm/mm)
0.20
0
0.1 0.2 0.3 Strain (mm/mm)
0.4
(c) Stress (MPa)
250 200 150 Neat VE - 2350/s Neat VE-DA - 2350/s VE-0.50 phr VGCNF - 2350/s VE-1.00 phr VGCNF - 2350/s
100 50 0 0
0.1
0.2 0.3 0.4 0.5 0.6 Strain (mm/mm) Figure 6. Dynamic response of pure vinyl ester (VE) resin with no additives (Neat VE), VE resin with a dispersing agent (DA) chemical added (Neat VE-DA), VE resin reinforced with 0.50 parts (by weight) per hundred (parts of) resin (phr) of vapor grown carbon nanofibers (VGCNF) (VE-0.50 phr VGCNF) and VE resin reinforced with 1.00 phr of VGCNF (VE-1.00 phr VGCNF) at strain rates of (a) 750 s-1, (b) 1550 s-1 and (c) 2350 s-1
11 American Institute of Aeronautics and Astronautics
(a)
(b)
Figure 7. Transmission electron microscopy (TEM) images showing the average size and density of the agglomerated nests of vapor grown carbon nanofiber (VGCNF) particles in vinyl ester (VE) resin reinforced with (a) 0.50 and (b) 1.00 parts (by weight) per hundred (parts of) resin (phr) of VGCNF at 6,700 X and 1,400 X magnifications, respectively
12 American Institute of Aeronautics and Astronautics
Strain Rate (s-1) Material Yield Stress (MPa) Elastic Modulus (GPa) 1) 750 1) Neat VE 187.3 3.6 1) 750 2) Neat VE-DA 192.2 3.1 1) 750 3) VE-0.50 phr VGCNF 197.2 4.2 1) 750 4) VE-1.00 phr VGCNF 185.9 2.8 2) 1550 1) Neat VE 187.4 3.9 2) 1550 2) Neat VE-DA 188.1 3.4 2) 1550 3) VE-0.50 phr VGCNF 196.0 5.3 2) 1550 4) VE-1.00 phr VGCNF 184.6 3.2 3) 2350 1) Neat VE 194.7 4.6 3) 2350 2) Neat VE-DA 175.6 3.8 3) 2350 3) VE-0.50 phr VGCNF 172.7 4.3 3) 2350 4) VE-1.00 phr VGCNF 181.1 3.4 Table 1. Summary of dynamic compressive properties of VE-VGCNF nanocomposites with the material designations listed as follows: Neat VE = pure vinyl ester (VE) resin with no additives, Neat VE-DA = pure VE resin with a dispersing agent (DA) chemical added, VE-0.50 phr VGCNF = VE resin reinforced with 0.50 parts (by weight) per hundred (parts of) resin (phr) of vapor grown carbon nanofibers (VGCNF), VE-1.00 phr VGCNF = VE resin reinforced with 1.00 phr of VGCNF
13 American Institute of Aeronautics and Astronautics
(a) 1) 2) 3) 4)
Material Neat VE Neat VE-DA VE-0.50 phr VGCNF VE-1.00 phr VGCNF
Δσy (%) 0.1 -2.1 -0.6 -0.7
ΔE (%) 9.8 9.7 26.2 14.2
1) 2) 3) 4)
Material Neat VE Neat VE-DA VE-0.50 phr VGCNF VE-1.00 phr VGCNF
Δσy (%) 3.9 -6.7 -11.9 -1.9
ΔE (%) 17.3 12.9 -18.1 6.5
(b)
(c) Material Δσy (%) ΔE (%) 4.0 28.8 1) Neat VE -8.7 23.9 2) Neat VE-DA -12.4 3.3 3) VE-0.50 phr VGCNF -2.6 21.7 4) VE-1.00 phr VGCNF Table 2. Changes in mechanical properties for all four materials with respect to strain rate as strain rates range from (a) 750 s-1 to 1550 s-1, (b) 1550 s-1to 2350 s-1, and (c) 750 s-1 to 2350 s-1 with the material designations listed as follows: Neat VE = pure vinyl ester (VE) resin with no additives, Neat VE-DA = pure VE resin with a dispersing agent (DA) chemical added, VE-0.50 phr VGCNF = VE resin reinforced with 0.50 parts (by weight) per hundred (parts of) resin (phr) of vapor grown carbon nanofibers (VGCNF), VE-1.00 phr VGCNF = VE resin reinforced with 1.00 phr of VGCNF
14 American Institute of Aeronautics and Astronautics