UV/Vis absorption â The UV/Vis absorption of the hemin solution was measured by .... 0.25mm. 0.5mm. 0.75mm. 1mm. 1.5mm. 2mm. 2.5mm. 3.5mm. 6mm. 9mm.
Copyright WILEY-VCH Verlag GmbH & Co. KGaA, 69469 Weinheim, Germany, 2017.
Supporting Information for Adv. Mater., DOI: 10.1002/adma.201700810
Electron Hopping Across Hemin-Doped Serum Albumin Mats on Centimeter-Length Scales Nadav Amdursky,* Xuhua Wang, Paul Meredith, D. Jason Riley, David J. Payne, Donal D. C. Bradley, and Molly M. Stevens*
Copyright WILEY-VCH Verlag GmbH & Co. KGaA, 69469 Weinheim, Germany, 2013.
Supporting Information Electron Hopping Across Hemin-Doped Serum Albumin Mats on Centimetre-Length Scales Nadav Amdursky,* Xuhua Wang, Paul Meredith, D. Jason Riley, David J. Payne, Donal D. C. Bradley, Molly M. Stevens*
Materials and Methods Electrospinning of BSA mat – Bovine serum albumin (Sigma-Aldrich, A3608, ≥96%) was used to form the mats. The BSA was dissolved in 90% TFE to a final BSA concentration of 14% (w/v). β-mercaptoethanol was added to the solution to a final concentration of 5% (v/v). A custom built electrospinning system was used, where a bias of 11.5 kV was applied on an 18-gauge blunt needle, and the collector was grounded. The distance between the collector and the end of the needle was 11 cm, and the rate of injection was 0.8 mL/min. Metal finger-shaped electrode preparation – Several cleaned microscope slides were used as the substrates. An MBraun thermal evaporator inside a nitrogen filled glovebox system under the vacuum of 5x 10⁻⁷mbar was used to deposit ~60nm Au thin films and ~55 nm Ti thin films, respectively. Prior to the Au evaporation, a 10nm chromium layer was deposited on the glass substrates as an adhesive layer. A tungsten boat was used for the evaporation of Au, and an alumina coated tungsten boat was used for the evaporation of Ti, since Ti reacts with tungsten in direct contact. The patterning electrodes were defined by a custom made metal mask with varied distances. Impedance spectroscopy – The impedance spectroscopy was carried out by an SI 1260 impedance/gain-phase analyser (Schlumberger). At least 24 h before the measurement the dry
1
mats were placed in either deionised water for the non-doped mat, in NaCl solutions of 0.05 M or 0.5 M for the salt-doped mats, or in 0.1 mM hemin (Sigma-Aldrich, ≥97%) solution that was prepared by diluting an aliquot from a stock solution of 12 mM hemin in dimethyl sulfoxide to an aqueous solution (×0.2 PBS buffer, pH7.4, final salt concentration: 27.4 mM NaCl, 2 mM PO43- and 0.5 mM KCl, final hemin concentration: 0.15 mM) for the doped mat. Following the incubation of 24 h, the mats were placed in water to wash away any unbound dopants and the wet mats were placed on the finger-shaped electrode (Figure S4) and were dried by a filter paper to remove any excess water molecules that are not tightly bound to the surface. For the measurements with the hemin film, the above dopant solution containing 0.15 mM hemin was drop-casted on the finger-shaped electrode and left to dry. Micromanipulators probes were used in order to contact the gold electrodes. The frequency range was 10 MHz – 1 KHz with an applied AC bias of 50 mV, an integration time of 0.5 s, and no DC bias was applied. The impedance spectra were fitted using the ZView software (© Scribner Associates, Inc). Current-Voltage measurements – The current-voltage sweeps were carried out by a Keithley 2400 source-measure unit controlled by a computer via a home written Labview program. The same finger-shaped electrodes, mats and micromanipulators probes were also used for the impedance spectroscopy measurement, where one of the probes was biased while the other was grounded. Temperature dependence – The gold finger-shape electrode with the mat was placed on a heater controlled by a Keithley temperature controller. The impedance and I-V measurements were conducted exactly as described above. X-ray photoelectron spectroscopy (XPS)– The XPS spectra were obtained on a Thermo Fisher K-Alpha utilising a monochromatic Al-Kα X-ray source (h = 1486.7 eV). Samples were positioned with the electron take-off angle normal to the surface with respect to the analyser. The valence band measurements were measured with a pass 2
energy of 40 eV, and 0.2 eV step energy, over the range of -5 eV to 40. A low energy electron/ion flood gun was used to ensure an effective surface charge compensation. UV/Vis absorption – The UV/Vis absorption of the hemin solution was measured by a NanoDrop 2000 spectrophotometer (Thermo Scientific) using a quartz cuvette with a 4 mm pathlength. The absorption spectra were taken before placing the mats and after ~48 h where the mats were in the solution with mild (60 rpm) shaking.
Solution of hemin before placing the mat After placing the mat for 24h
1.0
(b) Normalized Absorption
Absorption [O.D.]
(a)
0.8 0.6 0.4 0.2 0.0 200
300
400
500
600
700
0.8 0.6 0.4 0.2 0.0 200
800
Hemin in solution Hemin-doped BSA mat
1.0
400
600
800
Wavelength [nm]
Wavelength [nm]
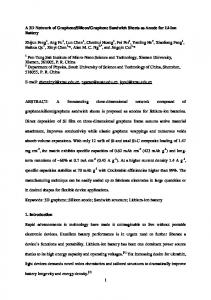
Figure S1. (a) A typical UV-Vis absorption spectra of hemin solution (75 μM) before placing the mat (black curve) and after 24 h where the mat was placed in the solution (red curve). The path length was 4 mm. (b) A normalized absorption comparison between the hemin-doped mat and free hemins in solution. Due to the high absorbance of the BSA mat we used in this experiment a thinner mat (~25 μm) that what was used for the other characterisations together with an integrating sphere.
3
Figure S2. (a) Valence band of the non-doped (red curve) and doped (blue curve) mats. Note the peak at ~30 eV binding energy in the doped sample is due to Na 2p states most likely introduced during the doping stage. (b) Expansion of the valence band maximum region showing the increased electronic states above the valence band maximum.
4
(a)
(b)
Non-doped
C 1s
O 1s
Doped C 1s O 1s
N 1s
N 1s Fe 2p
Na KLL
S 2s S 2p
800
700
600
500
400
300
200
S 2s S 2p
100
800
Binding energy [eV]
700
600
500
400
300
200
100
Binding energy [eV]
Figure S3. XPS survey scans for the (a) non-doped and (b) doped mats showing the presence of iron in the doped mats as well as a sodium auger peak (Na KLL). The atom ratios from the elemental analysis have been calculated for the non-doped mats. The fair agreement between the calculated ratios to the theoretical values of the atoms in BSA implies that no major impurities have been added to the protein during the electrospinning stage. N/S C/S O/S C/N C/O O/N Theoretical 22.3 84.2 25.7 3.8 3.3 1.2 values Measured 19.2 93.6 25.1 4.8 3.7 1.3 values Unfortunately, the low intensity Fe 2p peak has not allowed us to extract a quantitative ratio for Fe in comparison to the rest of the atoms, which would have enabled us to estimate the number of hemin molecules per BSA protein.
5
(a)
(b)
(c)
(d)
(e)
Figure S4. Images of the doped BSA mats on the different Au finger array electrodes. The scale bar represents 5 mm. The distances present in the images are (from left to right): (a) 3.5 – 0.25 mm spacing. (b) 6, 24, 8 (not used in the study), 18 (c) 13.5, 30, 9 mm, (d) 14.5 (not used in the study), 36 mm (e) 45, 6 mm.
6
Table S1. Resistance values as measured by EIS Distance [mm]
Non-doped Resistance [Ω]
0.25 0.5 0.75 1 1.5 2 2.5 3.5 6 9 13.5 18 24
0.98±0.30·105 1.60±0.39·105 2.52±0.98·105 3.39±1.35·105 4.72±1.81·105 6.49±2.73·105 8.08±3.04·105 -
0.25 0.5 0.75 1 1.5 2 2.5 3.5 6 9 13.5 18 24
5
0.83±0.28·10 1.30±0.41·105 2.06±0.85·105 3.21±1.33·105 5.46±1.88·105 7.45±2.91·105 9.04±3.59·105 -
Doped Non-doped Doped Resistance Conductivity Conductivity [Ω] [S·cm-1] [S·cm-1] Au electrodes 3.08±0.51·103 4.01·10-5 1.28·10-3 3 -5 4.78±0.65·10 4.88·10 1.64·10-3 7.40±1.06·103 4.65·10-5 1.59·10-3 3 -5 9.84±1.10·10 4.63·10 1.60·10-3 1.30±0.24·104 4.97·10-5 1.80·10-3 4 -5 1.59±0.47·10 4.83·10 1.96·10-3 4 -5 1.92±0.56·10 4.86·10 2.03·10-3 2.61±0.59·104 2.09·10-3 4 3.64±0.68·10 2.58·10-3 6.12±0.81·104 2.30·10-3 4 8.74±1.05·10 2.41·10-3 1.25±0.30·105 2.24·10-3 5 1.63±0.45·10 2.30·10-3 Ti Electrodes 2.17±0.57·103 3.24±0.71·103 4.95±0.96·103 7.36±1.94·103 1.13±0.21·104 1.57±0.57·104 1.92±0.70·104 2.66±0.89·104 3.63±1.05·104 5.44±1.30·104 7.89±1.73·104 1.11±0.32·105 1.41±0.49·105
4.67·10-5 5.97·10-5 5.69·10-5 4.86·10-5 4.29·10-5 4.20·10-5 4.32·10-5 -
7
1.80·10-3 2.41·10-3 2.37·10-3 2.12·10-3 2.08·10-3 2.00·10-3 2.04·10-3 2.05·10-3 2.60·10-3 2.58·10-3 2.67·10-3 2.54·10-3 2.66·10-3
400000
Au electrodes
300000
BSA mat
200000 100000
(b) 0.25mm 0.5mm 0.75mm 1mm 1.5mm 2mm 2.5mm
500000
Ti electrodes 400000
-ZIm []
-ZIm []
(a)
BSA mat
300000 200000 100000 0
0 0
200000
400000
600000
800000
0
1000000
500000
1000000
ZReal []
ZReal [] 80000 120000
0
50000
100000
150000
200000
250000
ZReal [] 8000
4000
40000 20000 0 0
50000
100000
150000
ZReal [] 8000
-ZIm []
0
0.25mm 0.5mm 0.75mm 1mm 1.5mm 2mm 2.5mm 3.5mm 6mm 9mm 13.5mm 18mm 24mm
-ZIm []
40000
-ZIm []
-ZIm []
60000 80000
6000 4000 2000 0
0 0
5000
10000
15000
20000
0
25000
5000
10000
15000
20000
25000
ZReal []
ZReal []
Figure S5. Nyquist plot representation of the imaginary part of the impedance resistance as a function of the real part across non-doped mats (blue squares, upper panels) and doped mats (red squares), measured with (a) Au or (b) Ti electrodes. The lowest panels are a magnification of the low resistance regime of the doped mats displayed in the medium panel. The graphs are plotted on an isometric scale.
8
6
(a) 6
2.5 mm
(b)10
Au electrodes Ti electrodes
Non-doped Mats
24 mm
10
Au electrodes Ti electrodes
Doped Mats
105
Z []
Z []
105
0.25 mm
104
104 0.25 mm
103 103 103
104
105
106
107
103
Frequency [Hz]
104
105
106
Frequency [Hz]
Figure S6. Bode plot comparison of the EIS measurements measured with Au or Ti electrodes for (a) non-doped and (b) doped mats.
9
107
(a)
(b)
0.05 M NaCl
106 2.5 mm
300000
0.05 M NaCl
105 0.25 mm
0.25mm 0.5mm 0.75mm 1mm 1.5mm 2mm 2.5mm
200000
ZIm []
Z []
250000 150000 100000 50000
4
10
0 0
250000
500000
750000
ZReal []
103
103
104
105
106
107
Frequency [Hz]
(c)
(d)
0.5 M NaCl
106 2.5 mm 0.5 M NaCl
ZIm []
5
10
0.25 mm
0.25mm 0.5mm 0.75mm 1mm 1.5mm 2mm 2.5mm
-150000 -100000 -50000
104
0 0
200000
400000
600000
ZReal []
103
103
104
105
106
107
Frequency [Hz]
(e)
Impedance conductance [S]
Z []
-200000
Mats in 0.05M NaCl Mats in 0.5M NaCl Original nondoped mat
16 12 8 4 0 0.0
0.5
1.0
1.5
2.0
2.5
Distance [mm]
Figure S7. The absolute impedance as a function of frequency and distance for the mats placed in (a) 0.05 M and (c) 0.5 M NaCl. Nyquist plot representation of the imaginary part of the impedance resistance as a function of the real part across the mats placed in (b) 0.05 M and (d) 0.5 M NaCl. (e) The distance dependent conductance across the mats placed in 0.05 and 0.5 M NaCl compared to the mats placed in deionized water.
10
(a)
(b)
18 mm
ZIm []
Z [] 104
0.5mm 0.75mm 1mm 1.5mm 2mm 2.5mm 3.5mm 6mm 9mm 13.5mm 18mm
120000
105
80000
40000
0.5 mm 0 0
10
75000
150000
225000
ZReal []
3
103
104
105
106
107
(c)
Impedance conductance [S]
Frequency [Hz] 250 Hemin drop-casted Original doped mat
200 150 100 50 0 0
2
4
6
8 10 12 14 16 18 20
Distance [mm]
Figure S8. (a) The absolute impedance as a function of frequency and distance together with (b) Nyquist plot representation of the imaginary part of the impedance resistance as a function of the real part across drop-cast hemin films. (c) The distance dependent conductance across the drop-cast hemin films compared to the hemin-doped mats.
11
Current [A]
2
2
0.25 mm
2
0.5 mm
2
0.75 mm
1
1
1
1
0
0
0
0
-1
-1
-1
-1
-2
Doped Undoped -1
0
-2
1
2
-1
0
-2
1 2
1.5 mm
-1
0 2
2 mm
1
1
1
0
0
0
-1
-1
-1
-2
-1
0
1
-2
-1
0
1
-2
1
-2
1 mm
-1
0
1
2.5 mm
-1
0
1
Bias [V]
Current [A]
0.10
0.10
0.25 mm
0.10
0.5 mm
0.10
0.75 mm
0.05
0.05
0.05
0.05
0.00
0.00
0.00
0.00
-0.05
-0.05
-0.05
-0.05
-0.10
Doped Undoped -0.4
0.0
0.4
0.10
-0.10
-0.4
0.0
0.4
0.10
1.5 mm
-0.10
-0.4
0.0 0.10
2 mm
0.05
0.05
0.05
0.00
0.00
0.00
-0.05
-0.05
-0.05
-0.10
-0.4
0.0
0.4
-0.10
-0.4
0.0
0.4
0.4
-0.10
-0.10
1 mm
-0.4
0.0
0.4
2.5 mm
-0.4
0.0
0.4
Bias [V]
Figure S9. I-V comparison between the doped and non-doped mats in the distance range of 0.25 – 2.5 mm measured with Au electrodes. The bottom set of graphs are zoomed areas of the upper set of graphs.
12
Current [A]
3
3
0.25 mm
3
0.5 mm
3
0.75 mm
2
2
2
2
1
1
1
1
0
0
0
0
-1
-1
-1
-1
-2
-2
-2
-2 -3
Doped Undoped -1
0
-3
1
3
-1
0
-3
1 3
1.5 mm
-1
0 3
2 mm
2
2
2
1
1
1
0
0
0
-1
-1
-1
-2
-2
-2
-3
-1
0
1
-3
-1
0
1
-3
1
-3
1 mm
-1
0
1
2.5 mm
-1
0
1
Bias [V]
Current [A]
0.15
0.15
0.25 mm
0.15
0.5 mm
0.15
0.75 mm
0.10
0.10
0.10
0.10
0.05
0.05
0.05
0.05
0.00
0.00
0.00
0.00
-0.05
-0.05
-0.05
-0.05
-0.10
-0.10
-0.10
-0.10 -0.15
Doped Undoped -0.2
0.0
0.2
0.15
-0.15
-0.2
0.0
0.2
0.15
1.5 mm
-0.15
-0.2
0.0 0.15
2 mm
0.10
0.10
0.10
0.05
0.05
0.05
0.00
0.00
0.00
-0.05
-0.05
-0.05
-0.10
-0.10
-0.10
-0.15
-0.2
0.0
0.2
-0.15
-0.2
0.0
0.2
0.2
-0.15
-0.15
1 mm
-0.2
0.0
0.2
2.5 mm
-0.2
0.0
0.2
Bias [V]
Figure S10. I-V comparison between the doped and non-doped mats in the distance range of 0.25 – 2.5 mm measured with Ti electrodes. The bottom set of graphs are zoomed areas of the upper set of graphs. 13
2.0 2 0.25 mm
0.5 mm
2.0 0.75 mm
1.0 1 mm
1.5 1.5 1.0
1
0.5 1.0
0.5
0
0.0
0.5 0.0 0.0
-1
-0.5
-2
-1.0
-0.5
-0.5 -1.0
-1.0 -1.5
-3
-1.5 -1.0
-0.5
0.0
0.5
1.0
-1.0
-0.5
0.0
0.5
-1.5
1.0
-1.0
-0.5
0.0
0.5
1.0
2.0
1.5 mm 1.5
Current [A]
-1.0
-0.5
0.0
0.5
1.0
-0.5
0.0
0.5
1.0
-0.5
0.0
0.5
1.0
-0.5
0.0
0.5
1.0
1.5 2.0 2 mm
1.5 2.5 mm
1.5
1.0
1.0
0.5
0.5
0.0
0.0
-0.5
-0.5
-1.0
-1.0
0.5
0.5
0.0
0.0
-0.5
-0.5
-1.0
-1.5
-1.5
3.5 mm 1.0
1.0
-1.0
-1.5
-2.0 -2.0
-1.5 -1.0
-0.5
0.0
0.5
1.0
-1.0
-0.5
0.0
0.5
1.0
-1.0
-0.5
0.0
0.5
1.0
-1.0 1.2
1.0
6 mm
1.0
9 mm
1.0
13.5 mm
18 mm 0.8
0.5
0.5
0.5
0.4
0.0
0.0 0.0
0.0
-0.5
-0.5 -0.4
-0.5 -1.0
-1.0
-0.8
-1.0 -1.0
-0.5
0.0
0.5
1.0
-1.0
-0.5
0.0
0.5
1.0
-1.0
-0.5
0.0
0.5
1.0
-1.0
0.8
24 mm
0.8 30 mm
36 mm
0.4 45 mm
0.6
0.8
0.3
0.6 0.4
0.4
0.2 0.0
0.4
0.2
0.2
0.1
0.0
0.0
0.0
-0.2
-0.2
-0.1
-0.4
-0.4
-0.4
-0.2 -0.3
-0.8
-0.6 -1.0
-0.5
0.0
0.5
1.0
-0.6 -1.0
-0.5
0.0
0.5
1.0
-1.0
-0.5
0.0
0.5
1.0
-1.0
Bias [V]
Figure S11. Forward (red curve) and reverse (black curve) I-V curves across the doped mat on Au electrodes at all measured distances.
14
0.5
(b)
Bias [V]
0.4
Vox Vred
0.3
-0.3
0.90 0.85
VOx-Vred [V]
(a)
-0.4
0.80 0.75 0.70 0.65 0.60
-0.5 0
10
20
0
30
5
10
15
20
25
30
Distance [mm]
Distance [mm]
Figure S12. (a) The bias position of the oxidation (Vox) and reduction (Vred) peaks and (b) the difference between them as a function of the distance. The values for the location of the oxidation and reduction peaks for the different distances are as follows: Distance VOx [V] VRed [V] [mm] 0.33±0.05 -0.31±0.03 0.5 0.34±0.04 -0.32±0.03 0.75 0.34±0.05 -0.32±0.03 1 0.36±0.03 -0.33±0.05 1.5 0.37±0.04 -0.37±0.04 2 0.41±0.04 -0.37±0.05 2.5 0.42±0.05 -0.36±0.04 3.5 0.43±0.07 -0.35±0.06 6 0.45±0.06 -0.35±0.06 9 0.43±0.06 -0.40±0.07 13.5 0.44±0.07 -0.38±0.06 18 0.45±0.05 -0.42±0.08 24 0.45±0.07 -0.44±0.07 30 Since we used the same sweep rate and integration time for the DC measurements at different distances, the longer the distance the faster the electric field was. Accordingly, as in common electrochemical type of measurement, an increase in the rate of the electric field induces an increase in the voltage difference between the oxidation and reduction peaks.
15
(a) 1.5x10
(b) 5x10
9
8
Non-doped Mat
Non-doped Mat Resistance []
Resistance []
4x10 1.0x10⁹
5.0x10
8
Au electrodes
8
3x10⁸ 2x10⁸ Ti electrodes
1x10⁸
BSA mat 0.0 0.0
0.5
1.0
1.5
2.0
2.5
BSA mat 0 0.0
3.0
0.5
1.0
Distance [mm] 1x10
(c)
(d)
3.0
Ti electrodes
Resistance []
Resistance []
2.5
Doped Mat
1x10⁷
6
6x10⁶ 4x10⁶
4x10⁶ 2x10⁶
2x10
2.0
Distance [mm]
7
Doped Mat 8x10
1.5
BSA mat
8x10⁶
4.0x10⁶
4x10⁶
2.0x10⁶
Au electrodes
6
BSA mat
0
0 0
10
20
0
1
30
2
3
40
0.0
4
0
50
Distance [mm]
0
10
20
0
1
30
2
3
40
Distance [mm]
Figure S13. The DC contact resistance estimation for the non-doped (a and b) and doped (c and d) mats, measured with Au (a and c) and Ti (b and d) electrodes. The contact resistance was estimated by the extrapolation of the resistance (extrapolated by a linear fitting to the ±0.05V regime of the I-V plot) for zero distance. The insets in the lower panels are a magnification of the short distance regime.
16
4
50
3 0.5 mm
Current [A]
2 1 0
24 mm
-1 -2 -3 -1.0
-0.5
0.0
0.5
1.0
Bias [V] Figure S14. I-V curves as a function of distance for drop-cast hemin films measured with Au electrodes.
17
(a) 104
15C 20C 25C 30C 35C
15C
103
ln(Conductance [-1])
Z []
35C
-8.8 -9.0
Ea=0.2eV
-9.2 3.3
3.4
3.5
1000/T [K-1]
104
105
106
107
(b)
Current [A]
2
1
ln(Conductance [S])
Frequency [Hz] -14.3 -14.4
Ea=0.15eV
-14.5
35C
-14.6 -14.7
15C
-14.8 3.25 3.30 3.35 3.40 3.45 3.50
1000/T [K-1]
0
15C 20C 25C 30C 35C
-1
-2 -1.0
-0.5
0.0
0.5
1.0
Bias [V] Figure S15. Temperature-dependence of (a) the AC EIS and (b) DC I-V, taken with the Au electrodes across the 2.5 mm junction. The insets show the activation energy as calculated by fitting the measured conductance/current to an Arrhenius equation.
18
Table S2. Conductance (G) values obtained by Eq. (4) in the main text (
) in
comparison to the measured EIS conductance with Au and Ti electrodes. The resulted parameters for the measurements with Au electrodes are: the distance between adjacent hemin molecules is rnn = 5.5 Å, the reorganization energy is λ = 0.84 eV, and the electron hopping rate is khop = 1.9 × 10⁹ s-1. The resulted parameters for the measurements with Ti electrodes are: rnn = 5.5 Å, λ = 0.75 eV and khop = 4.3 × 10⁹ s-1. Distance [mm]
Measured G – Au [S]
Calculated G - Au [S] R2=0.99
Measured G – Ti [S]
Calculated G - Ti [S] R2=0.98
0.25 0.5 0.75 1 1.5 2 2.5 3.5 6 9 13.5 18 24
3.25·10-4 2.10·10-4 1.35·10-4 1.01·10-4 7.67·10-5 6.28·10-5 5.19·10-5 3.82·10-5 2.75·10-5 1.63·10-5 1.14·10-5 7.97·10-6 6.15·10-6
3.17·10-4 1.84·10-4 1.33·10-4 1.06·10-4 7.71·10-5 6.14·10-5 5.15·10-5 3.95·10-5 2.58·10-5 1.87·10-5 1.36·10-5 1.08·10-5 8.62·10-6
4.61·10-4 3.08·10-4 2.02·10-4 1.36·10-4 8.86·10-5 6.34·10-5 5.22·10-5 3.75·10-5 2.75·10-5 1.84·10-5 1.27·10-5 9.01·10-6 7.09·10-6
4.32·10-4 2.40·10-4 1.70·10-4 1.33·10-4 9.42·10-5 7.37·10-5 6.10·10-5 4.58·10-5 2.90·10-5 2.05·10-5 1.45·10-5 1.14·10-5 8.92·10-6
19
2 -2 3 -1 4 0 5 1 6 2 7 3
Au
hemin
Ti
Energy relative to vacuum [eV]
Potential vs SHE [V]
-3
Figure S16. Band alignment of the Au and Ti electrodes around a possible distribution of the hemin molecules within the BSA mat. The energy distribution of the hemin molecules was estimated by a ±1V range around the redox potential of hemin in aqueous solution (~ (-0.1) – (-0.2)V* Vs SHE). Due to the uncertainty in the position of the redox potential, and the band gap of each of the hemin molecules, the exact position of the HOMO and LUMO states are unknown. As suggested from the valence band position in Figure S2, the band gap of the system might be very small, and accordingly the HOMO and LUMO band would be situated close (