The solution to the above non-linear PDE can be obtained using a finite element
(FE) partial differential solver. FlexPDE (PDE Solution Inc., 2004). It is a scripted ...
S15-7
COMPARISON OF TWO WATER STORAGE FUNCTIONS OF SOIL ON POREWATER PRESSURE OF EARTH-FILLED DAM UNDER CHANGING ENVIRONMENT Meen-Wah Gui1*, Chia-Hsian Wu1, and Chih-Wei Lu2 1
2
Department of Civil Engineering, National Taipei University of Technology, Taipei, Taiwan Department of Construction Engineering, National Kaohsiung First University of Science and Technology, Kaohsiung, Taiwan * Corresponding author (
[email protected])
ABSTRACT: Seepage of water through earth fill dam involves both the saturated and unsaturated flows of water. Unsaturated flow of water is often neglected because of the complexity required in solving the non-linear partial differential equation involved. This paper presents a seepage analysis of water flows through the partially saturated Renyi-Tan earth fill dam in Taiwan. The governing non-linear partial differential flow equation together with equations representing the characteristics of dam materials was solved using a PDE solver. Two water storage functions, which were derived by differentiating the van Genuchten (1980) and Leong and Rahardjo (1997)’s SWCC functions, have been used, and the two sets of results obtained have been compared for their sensitivity in seepage analysis of the study dam. Keywords: Earth-fill Dam, Seepage, Unsaturated Soil, Water Storage Function, PDE 1. INTRODUCTION Seepage analysis is important in the assessment of long
Taiwan is receiving plenty of rainfall that was brought by
term stability of slope, underground excavation, dam, etc.
could the stability of dam be affected by the sudden rise of
For homogeneous and isotropic material, the flow of water
the upstream water-table it could also be affected by the
in saturated zone is commonly estimated by solving the
infiltration of the rain. Taking two different functions of
typhoons between May and October every year. Not only
water storage capacity of soil into consideration, this study
linear partial differential equation (PDE) through the use of
aims at examining the generation and distribution of pore-
the graphical flow net method (Thieu et al., 2001). The
water pressure of Renyi-Tan earth fill dam due to the rising
flow of water in unsaturated soil is a very complicated
upstream water-table and rainfall infiltration. The two sets
problem because water flow and moisture content in un-
of results, generated by the two water storage functions, are
saturated soil may vary both spatially and temporally as a
then evaluated and compared in terms of pore-water pres-
result of time-dependent changes in environmental condi-
sure contour generated in the dam.
tions, such as rainfall and rising water-table, and the stor2. THEORETICAL BACKGROUND
age capacity of soil (Lu and Likos, 2004). The environ-
The governing law for transient water flow in soil under
mental changes are normally considered by including them
isothermal conditions can be derived by applying the prin-
into the boundary conditions of the problem under consid-
ciple of mass conservation, which is also called the conti-
eration while the storage capacity of the soil is considered
nuity principle. It states that for a given elemental volume
via the governing laws of flow, which is essentially represented by a non-linear partial differential equation.
538
S15-7
water volume vs net normal stress curve when
of soil, the rate of water loss or gain is conservative and is
is zero,
equal to the net flux of inflow and outflow, leading to
= gradient of the water volume vs matric is zero. For a non-
suction curve when (1)
deformable soil, it can be assumed that the total stress remains constant and the pore-air pressure remains at atmos-
is the density of water (kg/m3), qx, qy and qz are
pheric conditions; hence, a change of volumetric water
fluxes in the x, y and z directions, respectively (m/s). Equa-
content can be related to a change in pore-water pressure as
where
tion (1) is the governing equation of unsteady state of flow (6b)
and it can be applied in both saturated and unsaturated conditions. Using Darcy’s law
The PDE for water flow through an unsaturated soil is thus: ,
,
(2)
where kx = hydraulic conductivity and
(7)
hydraulic
To solve this PDE, three characteristic functions: (i) SWCC
gradient in x-direction and so on, thus
function, (ii) hydraulic conductivity function, and (iii) water storage function must first be defined. The SWCC is the
(3)
relation between the volumetric water content and matric suction; the hydraulic conductivity is a function of the vol-
Darcy’s law also applies to water flow through unsaturated
umetric water content, which is in turn a function of matric
soil (Richards, 1931). However, the hydraulic conductivity
suction; and the water storage, which is the gradient of the
in the unsaturated soil cannot be assumed to be a constant,
volumetric water content vs matric suction curve, is an
as in the case of saturate soil, but a function of soil suction
indication of the amount of water entering or leaving the
h (Richards, 1931), hence
soil as a result of a change in the pore-water pressure or (4)
The term
matric suction. 3. NUMERICAL MODELING
can be written in terms of matric suction head
The solution to the above non-linear PDE can be obtained using a finite element (FE) partial differential solver
(5)
FlexPDE (PDE Solution Inc., 2004). It is a scripted FE model builder and numerical solver for system of PDEs. It
where
is the gradient of the soil-water characteristics
can solve systems of: non-linear or time-dependent, and 1st
curve (SWCC), plotted in terms of volumetric water con-
or 2nd order PDEs in two or three dimensional geometry. In
tent vs suction head, and is referred to the water storage
FlexPDE, the non-linear system is solved by a modified
function. Fredlund and Morgenstern (1976) suggested that
Newton-Raphson iteration
the water phase constitutive relationship as
dependent system is solved by a 2nd order implicit Back-
process while the time-
ward Difference Formula (Gear method). It first tries to (6a)
find a valid starting time step by comparing one-step and two-step solutions over a trial time step and reducing this
where mean = mean stress, ua = pore-air pressure, uw =
trial time step until the one- and two-step solutions agree
= mean net normal
within a specified error tolerance. In short, the user writes
= gradient of the
the script of the PDE system and FlexPDE turns the script
pore-water pressure, stress,
= matric suction,
539
S15-7
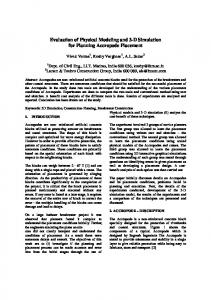
into a FE model and solve the system before presenting graphical output of the results. The program is capable of auto-mesh generation and refinement and, thus, simplifies the mesh creation process. It also allows the material properties to be input in equation form or a series of data points. 4. RENYI-TAN DAM AND INPUT PARAMETERS 4.1 Background of the Dam Fig. 2 Experimental and back-fitted SWCC functions.
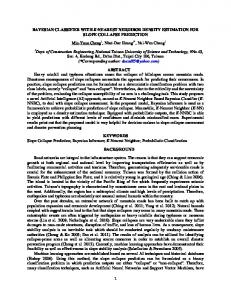
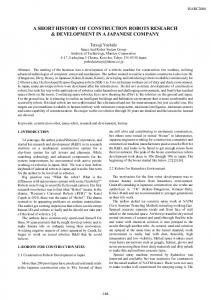
Fig. 1 Cross-sectional view of Renyi-Tan dam (in meter). Fig. 3 Estimated hydraulic conductivity functions. The study dam that formed part of an off-stream reservoir is called Renyi-Tan dam. It is a roller-compacted earth fill
km; the total water-holding capacity is 29.11 million m
Table 1: Fitting parameters used in fitting SWCC and . Soil type van Genuchten Leong and Rahardjo (1980) (1997) a, n, m(=1-1/n) a, n, m CL 0.01599, 1.180 70.54, 1.211, 0.4620 ML 0.01721, 1.209 104.0, 1.016, 0.5904 SM 0.06816, 1.411 21.42, 1.734, 0.8811
but the effective water-holding capacity is only 27.31 mil3 lion m . The dam itself is situated at the upstream of the
SWCC
Ba-Zhang River, which is 2.1 km from the Lan-Tan dam.
Experimental data of the SWC of the three materials (CL,
Construction of the dam started in 1980 and it began to
ML, and SM) have been obtained using the pressure plate
store water in August 1987. Together with Lan-Tan dam, it
extractor tests (Fig. 2). The figure shows that the saturated
supplies water to the community in Jia-Yi County, and the
volumetric water content
industry around the area. The dam was constructed using
was 45%, 37%, and 35%, respectively. These data were
four materials. The shell of the dam was constructed by
fitted, with the fitting parameters a, n, and m tabulated in
SM material, the core by CL material and the two semi-
Table 1, using the functions proposed by van Genuchten
impermeable zones, located between the shell and the core,
(1980) with residual volumetric water content
dam with layout shown in Fig. 1. The dam has a maximum height of 28 m and a 9 m wide by 1550 m long crest located at elevation EL. 108 m. The highest water-table is at EL. 105 m with a water surface covers an area of 3.66 square 3
for CL, ML and SM materials
=0:
by ML material (Fig 1). The surface layer of the shell was covered by gravelly material.
∗
4.2 Input Parameters
(8)
and Leong and Rahardjo (1997):
Equation (7) reveals that three characteristic functions (SWCC, hydraulic conductivity and water storage) are
(9)
needed in this seepage analysis.
540
S15-7
∗ ∗ ∗
∗
(13) ∗
The relationship between
and matric suction is shown
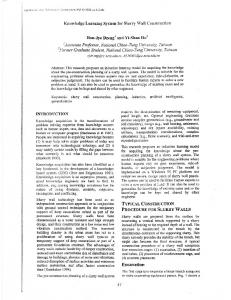
in Fig. 4. The relatively sharp peak for the SM materials reflects that it has a relatively narrow pore size distribution (Lu and Likos, 2004). Fig. 4 Estimated water storage functions. 4.3 Environmental Parameters Hydraulic Conductivity
Rising water-table , the diffi-
From the record collected by Water Resources Agency it
cult task of measuring this function directly can be over-
was observed that there was a continuous rise of upstream
come by estimating the function from either a measured or
water-table between 21 May and 21 June, 2008 (Fig. 5a).
predicted SWCC function. It is unnecessary to specify the
The rise of the water-table was due to rainfall. Fig. The
precise value of hydraulic conductivity when computing
upstream water-table rose 7.09 m from EL. 96.54 m on 21
the distribution of pore-water pressure; however, if the
May to EL. 103.63 m on 9 June. The average lowest and
quantity of flux is a concern, the function must be specified
highest water-table levels were determined at EL. 96.54 m
precisely (Thieu et al., 2001). For this study, two unsaturat-
and EL. 104.66 m.
For hydraulic conductivity of unsaturated soil
ed hydraulic conductivity functions: van Genuchten (1980) and Leong and Rahardjo (1997) have been obtained and shown in Fig. 3 from the SWCC data shown in Fig. 2.
(10)
(11)
The laboratory measured saturated hydraulic conductivity for the SM, ML, and CL materials was 7.00E-6 m/s, 2.45E-8 m/s and 1.29E-10 m/s, respectively. The correFig. 5 (a) Water-table; and (b) rainfall between May 21 and
sponding fitting parameters a, n and m used in the two
June 21, 2008.
functions have been shown in Table 1. Rainfall
Water Storage , as described earlier, is the
Taiwan faces high intensity rainfall between May and Oc-
gradient of the SWCC. Hence, after differentiating the
tober every year, and the stability of dams could be com-
SWCC functions of van Genuchten (1980) and Leong and
promised as a result of rainfall infiltration because the ef-
Rahardjo (1997), respectively, we obtained the following
fective stress and, hence, the strength of the dam will de-
two water storage functions:
crease due to the increase of pore-water pressure caused by
The water storage function
excessive rainfall. The daily rainfall data between 21 May ∗ ∗ ∗
∗ ∗
∗
and 21 June, 2008 is presented in Fig. 5(b).
(12)
541
S15-7
the occurrence of piping at the toe of the downstream slope.
4.4 Boundary Conditions The earth fill dam considered is 28 m high and incorporates a filter under the downstream slope of the dam. The transient seepage problem requires that initial conditions of head be specified. To represent the low storage condition water-table level at 96.54 m, a head of 16.54 m was defined on the upstream face of the dam. The initial condition of the dam was obtained by first solving a steady state run
Fig. 6 Contour of pore-water pressure (kPa) from steady-
of the problem with the 16.54 m head on the upstream face
state analysis with water-table at EL. 96.54 m [contour
and a head of 0 m on the lower portion of the filter. All
interval: 50 kPa; e.g. c=-50 kPa, d=0 kPa; e=50 kPa].
other boundaries were set to zero flux condition. The results from the steady state analysis were then used as the
5.2 Transient State: Rising water-table
initial condition for the transient analysis.
The process of filling up a reservoir is a transient process. The upstream water-table rose 7.09 m during a nineteen-
5. RESULTS AND DISCUSSION
day period between 21 May and 9 June (Fig. 5a). This is
The above seepage analysis results are evaluated and plot-
equal to an average rise of 0.373 m per day. Using the daily
ted here in terms of pore-water pressure distribution.
rise shown in Fig. 5(a) and setting the initial water-table at EL. 96.54 m, a 31-day seepage analysis has been carried out for this dam.
5.1 Steady State: Initial condition Fig. 6 shows the distribution of steady-state pore-water pressure distribution across the dam. The contour that corresponds to zero pressure (line ‘d’) represents the phreatic line in the dam. Soil that lies below this line is saturated with positive pore-water pressure and soil that lies above
(a) day-11
this line is unsaturated with negative pore-water pressure. At the crest, the value of the matric suction was 196 kPa. In practice, dam design required the water to exit the dam before the toe of the downstream slope. If the water-table
(b) day-31
had extended to the toe of the dam, there would be concern that the toe of the dam would become unstable due to pip-
Fig. 7 van Genuchten (1980)’s function: change of pore-
ing failure. As expected, with a filtering layer installed at
water pressure due to rising water-table [contour inter-
the base of the downstream slope it is obvious that the
val=50 kPa; a=-150 kPa; d=0; l=400 kPa].
pore-water pressure was unable to accumulate in the downstream semi-permeable zone (Fig. 6). In this zone, most of
The distributions of the pore-water pressure in the dam,
the pressure dissipated along the filter of the dam with zero
obtained through the functions of van Genuchten (1980)
pore-water pressure as shown by contour “d” in Fig. 6.
and Leong and Rahardjo (1997), for day-11 and day-31 are
Above the filtering layer, negative pore-water pressures
shown in Fig. 7 and 8, respectively. In all cases, the maxi-
(matric suction) exist. In general, matric suction would
mum pore-pressure of 426 kPa (11-day) and 428 kPa (31-
increase shear strength and, thus, the stability of the down-
day), compared to 424 kPa in the case of steady-state con-
stream slope in this case. In addition, the existence of the
dition, occurred at the base of the upstream slope of the
matric suction in the downstream slope would also prevent
dam. No significant variation of pore-water pressure distri-
542
S15-7
bution is seen due to the 7.09 m rise of water-table. Using
the Leong and Rahardjo’s function. van Genuchten’s func-
both the van Genuchten (Fig. 7) and Leong and Rahardjo
tion shows that the value decreased by about 27 kPa be-
(Fig. 8) functions: at day-11, the water flows mainly
tween day-1 and day-31.
through the shell of the dam, which is shown by the curved pore-water pressure contour; at day-31, the water reached
CONCLUSIONS
the semi-impermeable zone. The hydraulic conductivity of
Seepage analysis using two different water storage func-
the core zone is about two orders lower than the hydraulic
tions for a saturated-unsaturated earth fill dam has been
conductivity of the semi-permeable zones. This has in turn
performed and compared. Effects of rising water-table and
resulted in the slow movement of water in the core zone.
rainfall were shown by the change of pore-water pressure
The difference between the two functions was the value of
distribution at the crest and shell regions of the dam. Pre-
the matric suction near the crest of the dam. van Genuch-
liminary result revealed that analysis using the water stor-
ten’s function gave a matric suction value of 192 and 191
age function derived by differentiating the van Genuchten’s
kPa, respectively, for day 11 and 31; while Leong and Ra-
SWCC function is more sensitive in capturing changes of
hardjo gave a matric suction value of 201 and 195, respec-
matric suction than the Leong and Rahardjo’s function.
tively. ACKNOWLEDGEMENT The authors are grateful to the support provided by NSC99-2221-E-027-055. REFERENCES
(a) day-11
[1] Fredlund, D.G. and Morgenstern, N.R. (1976). “Constitutive relations for volume change in unsaturated soils. Canadian Geotehcnical Journal, Vol. 13, p261-276. [2] van Genuchten, M.T. (1980). “A closed-form equation for predicting the hydraulic conductivity of unsaturated
(b) day-31
soils”, Soil Science Society Am. J. Vol. 44, p892-898.
Fig. 8 Leong and Rahardjo (1997)’s function: change of
[3] Leong, E.C. and Rahardjo, H. (1997). “A review of
pore-water pressure due to rising water-table [contour in-
soil-water characteristic curve equations”, J of Geotech-
terval=50 kPa; a=-200 kPa; e=0; l=350 kPa].
nical and Geo-environment Engineering, 123(12), p11061117.
5.3 Transient State: Rainfall infiltration
[4] Lu and Likos (2004). Unsaturated Soil Mechanics,
By setting the upstream water-table at EL. 96.54 m and
John Wiley & Sons, Inc., New York.
using the daily rainfall pattern shown in Fig. 5(b), the dis-
[5] PDE Solution Inc. (2007). FlexPDE 5.0 Reference
tribution of pore-water pressure of the dam due to rainfall
Manual, Antioch, CA, USA.
infiltration could be obtained. For both functions, except
[6] Richards, L. A. (1931). “Capillary conduction of liquids
near the dam crest, no significant variation in pore-water
through porous mediums”, J of Physics, Vol. 1, p318-333.
pressure distribution was observed in the dam between
[7] Thieu, N.T.M, Fredlund, M.D., Fredlund, D.G., and
day-11 and day-31 results. This was due to the low infiltra-
Hung, V.Q. (2001). “Seepage modeling in a saturat-
tion capability of the dam. There was a reduction of matric
ed/unsaturated soil system”, Proc. Int. Conf. on Manage-
suction at the crest of the dam after a period of continuous
ment of the Land and Water Resources, MLWR, Hanoi,
rainfall. The magnitude of reduction was clearly seen in the
Vietnam.
van Genuchten’s function while it was not so obvious in
543