1 Efficient Algorithms and Cost Models for Reverse Spatial-Keyword k-Nearest Neighbor Search YING LU and JIAHENG LU, Renmin University of China GAO CONG, Nanyang Technological University WEI WU, Institute for Infocomm Research, Singapore CYRUS SHAHABI, University of Southern California
Geographic objects associated with descriptive texts are becoming prevalent, justifying the need for spatial keyword queries that consider both locations and textual descriptions of the objects. Specifically, the relevance of an object to a query is measured by spatial-textual similarity that is based on both spatial proximity and textual similarity. In this article, we introduce the Reverse Spatial-Keyword k-Nearest Neighbor (RSKk NN) query, which finds those objects that have the query as one of their k nearest spatial-textual objects. The RSKk NN queries have numerous applications in online maps and GIS decision support systems. To answer RSKk NN queries efficiently, we propose a hybrid index tree, called IUR-tree (IntersectionUnion R-Tree) that effectively combines location proximity with textual similarity. Subsequently, we design a branch-and-bound search algorithm based on the IUR-tree. To accelerate the query processing, we improve IUR-tree by leveraging the distribution of textual description, leading to some variants of the IUR-tree called clustered IUR-tree (CIUR-tree) and combined clustered IUR-tree (C2 IUR-tree), for each of which we develop optimized algorithms. We also provide a theoretical cost model to analyze the efficiency of our algorithms. Our empirical studies show that the proposed algorithms are efficient and scalable. Categories and Subject Descriptors: H.2.8 [Database applications]: Spatial databases and GIS General Terms: Algorithms, Experimentation Additional Key Words and Phrases: Reverse k-Nearest Neighbor queries, Spatial-Keyword Query, Performance Analysis ACM Reference Format: Ying Lu, Jiaheng Lu, Gao Cong, Wei Wu, and Cyrus Shahabi. 2014. Efficient Algorithms and Cost Models for Reverse Spatial-Keyword k-Nearest Neighbor Search. ACM Trans. Datab. Syst. V, N, Article 1 (January YYYY), 42 pages. DOI = 10.1145/0000000.0000000 http://doi.acm.org/10.1145/0000000.0000000
1. Introduction
With the advent of Web 2.0, many Web objects are associated with both textual contents and locations. For example, more than 7 million tweets per day are geotagged, or many review websites such as Yelp have both location and textual information, such as “Seafood buffet promotion” or “Japanese sushi takeaway”. This phenomena gives rise to spatial keyword queries that can search for objects in both keywords and location spaces. This research is partially supported by 973 Program of China (Project No. 2012CB316205), NSF China (No: 61170011), RUC Research Funds (No.11XNJ003), Singapore MOE AcRF Tier 2 Grant (ARC30/12) and Tier 1 Grant (RG66/12). Author’s addresses: Y. Lu, (current address) Department of Computer Science, University of Southern California, Los Angeles, CA, 90089; email:
[email protected]. The bulk of the research of Y. Lu was done at Renmin University, and she is currently affiliated with University of Southern California. J. Lu (corresponding author), DEKE, MOE and School of Information, Renmin University of China, Beijing, China, 100872; email:
[email protected]. G. Cong, School of Computer Engineering, Nanyang Technological University, Singapore, 639798; email:
[email protected]. W. Wu, Data Analytics Department, Institute for Infocomm Research, Singapore 138632; email:
[email protected]. C. Shahabi, Department of Computer Science, University of Southern California, Los Angeles, CA, 90089; email:
[email protected]. Permission to make digital or hard copies of part or all of this work for personal or classroom use is granted without fee provided that copies are not made or distributed for profit or commercial advantage and that copies show this notice on the first page or initial screen of a display along with the full citation. Copyrights for components of this work owned by others than ACM must be honored. Abstracting with credit is permitted. To copy otherwise, to republish, to post on servers, to redistribute to lists, or to use any component of this work in other works requires prior specific permission and/or a fee. Permissions may be requested from Publications Dept., ACM, Inc., 2 Penn Plaza, Suite 701, New York, NY 10121-0701 USA, fax +1 (212) 869-0481, or
[email protected]. c YYYY ACM 0362-5915/YYYY/01-ART1 $10.00 ⃝ DOI 10.1145/0000000.0000000 http://doi.acm.org/10.1145/0000000.0000000
ACM Transactions on Database Systems, Vol. V, No. N, Article 1, Publication date: January YYYY.
1:2
Y. Lu et al.
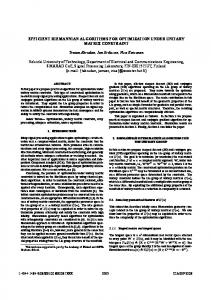
Towards this end, we introduce a new type of spatial-keyword query, dubbed Reverse SpatialKeyword k-Nearest Neighbor (RSKkNN), which is a type of RkNN queries for finding objects whose k-nearest neighbors (kNN) include the query. RkNN has received considerable attention in the recent decades due to its importance in several applications involving decision support [Korn and Muthukrishnan 2000; Kang et al. 2007; Wu et al. 2008a], resource allocation [Cheema et al. 2009], profile-based marketing [Emrich et al. 2010], etc. Among many of these applications, the RkNN is mainly used to discover influence sets. An influence set is a set of objects in a dataset that are highly influenced by the query object. For example, existing stores may be “influenced” by a new store outlet since their customers may be closer to the new store and they may be attracted by the new store. To illustrate, consider the example in Figure 1. The points p1 · · · p9 in Fig. 1(a) are existing stores in a region, and q is a new store (the rectangles N1· · · N7 in Fig. 1(a) are MBRs that will be explained later in Section 5). Assuming k=2, the results of the RkNN query for point q are {p4 , p5 , p9 }, as q is the top-2 spatial nearest neighbor of p4 , p5 and p9 . In previous studies [Stanoi et al. 2000; Tao et al. 2004; Achtert et al. 2006; Wu et al. 2008b], spatial distance is usually considered as the sole influence factor. However, in real applications, distance alone may not be sufficient to characterize the influence between two objects. For example, two objects (e.g., restaurants) are more likely to influence each other if their textual descriptions (e.g., seafood buffet lunch including crab and shrimp) are similar. Therefore, in this article, we incorporate textual similarity in RkNN, and study a new type of the RkNN problem, named Reverse Spatial-Keyword k Nearest Neighbor (RSKkNN), where both spatial distance and textual similarity are considered. The RSKkNN query finds the objects that have the query object as one of their k most spatial-textual nearest objects. Recall Figure 1, which illustrates the difference between our proposed RSKkNN query and the conventional RkNN query. Points p1 · · · p9 in Fig. 1(a) are existing stores in a region, and q is a newly opened store. The textual description of each store is given in Fig. 1(b), where the weight of each word can be calculated using the TF-IDF measure [Salton 1988]. An RSKkNN query with q as the query object finds the existing stores that will be influenced most by q considering both the spatial proximity and the textual similarity. For example, suppose k=2, the results of the traditional RkNN query are {p4 , p5 , p9 }, while the results of our RSTkNN query will be {p1 , p4 , p5 , p9 }. Note p1 becomes an answer since the textual description of p1 is similar to that of q, and q is a top-2 spatial-textual nearest neighbor when spatial proximity and textual similarity are considered. However, q is not a 2-NN of p1 when spatial distance alone is considered.
y p7 N1 p 8
N7 p2
p3
N4
N5
p6 p1
N6 p5
N2 p 4
p1 p2 p3 p4 p5 p6 p7 p8 p9 q
N3 p9
q(12,6)
x
(a) Distribution of branch stores
x 3 4 14 11 6 0 18 25 19 12
y vectors 12 ObjVct1 16 ObjVct2 15 ObjVct3 0 ObjVct4 5 ObjVct5 11 ObjVct6 20 ObjVct7 22 ObjVct8 10 ObjVct9 6 ObjVctQ
ear ry ionesportsw pan stat
p er era diap cam lapto
8 1 1 7 4 1 0 1 0 8
0 8 4 1 1 7 0 0 1 0
8 1 1 7 4 1 0 1 0 8
0 8 4 1 1 7 0 0 1 0
0 4 1 0 0 0 8 7 4 0
0 4 1 0 0 0 8 7 4 0
(b) Locations and products of branch stores in (a)
Fig. 1. An example of RSKkNN queries
RSKkNN queries have many applications ranging from map-based Web search to GIS decision support. For example, a shopping mall can use RSKkNN queries to find potential customers whose profiles are relevant to the products of the shopping mall and whose locations are close to this shopping mall. As another example, a person who wants to buy/rent a house would describe her/his desired house with both location and textual description that specifies the amenities (s)he wants. ACM Transactions on Database Systems, Vol. V, No. N, Article 1, Publication date: January YYYY.
Efficient Algorithms and Cost Models for Reverse Spatial-Keyword k-Nearest Neighbor Search 1:3
The RSKkNN query can help landlords find the potential buyers/renters who may be interested in their houses based on the location and description of the houses. Unfortunately, taking into account the textual relevance in RSKkNN will pose great challenges to the existing techniques for processing conventional RkNNs (without considering textual relevance), and render them inapplicable to process RSKkNN queries. In particular, an attempt to solve the RSKkNN problem using the existing methods is to map the keywords to feature dimensions, and use the existing techniques for conventional RkNN queries. Unfortunately, this simple solution has the following limitations: Existing solutions for RkNN queries are based on the ℓp norm metric space, which is suitable to compute the similarity for dense dataset (e.g., location points) but not for the high dimensional and sparse dataset [Tan et al. 2005]. However, the spatial-keyword objects in our problem, which is the fusion of geographical coordinates of point data and the textual descriptions, can be both high dimensional and sparse. Thus, most of existing algorithms based on ℓp norm metric space are not effective for answering RSKkNN queries. Even if we can use the ℓp norm metric to measure the textual similarity, they might still suffer from a severe efficiency problem (a.k.a. “curse of dimensionality”) ([Stanoi et al. 2000; Stanoi et al. 2001; Tao et al. 2004; Wu et al. 2008b; Cheema et al. 2011]). Finally, the work in [Singh et al. 2003] proposes an efficient approach to answer RkNN queries in high dimension. Unfortunately, their algorithm can only provide approximate answers in high dimension. Note that our problem requires efficient algorithms to provide exact answers. Therefore, to process an RSKkNN query accurately and efficiently, in this article, we propose a series of carefully designed solutions and optimizations. In particular, we first give a formal definition of RSKkNN queries, which combines the Euclidean distance for spatial data and the extended Jaccard similarity for textual data. We then propose an effective hybrid indexing structure called Intersection-Union-R tree (IUR-tree) that stores both spatial and textual information. We develop an efficient branch-and-bound algorithm to process RSKkNN queries based IUR-trees by effectively computing spatial-textual similarities between index nodes. We carefully design the upper and lower bounds on the similarity between nodes to avoid the access of irrelevant index nodes, thus saving I/O costs. In addition, as the main theoretical contribution of this article, we propose a cost model and analyze the performance of our algorithm theoretically based on IUR-trees. We are not aware of any existing cost model with the fusion of location proximity and textual similarity. To further optimize our algorithm, we then propose two enhanced hybrid indexes, namely Clustered IUR-tree (i.e. CIUR-tree) and Combined CIUR-tree (i.e. C2 IUR-tree), which enriches the entry contents of R-trees by adding cluster information of texts and changes the method of R-tree construction. Algorithms based on CIUR-tree and C2 IUR-tree are also proposed, by leveraging the cluster information to change the order of node access during the traversal of trees to speedup the prcessing. Finally, results of empirical studies with implementations of all the proposed techniques demonstrate the scalability and efficiency of our indexes and algorithms. Outline of the article. The article is structured as follows. Section 2 defines our research problem. In Sections 3 and 4, we extensively survey the related work and show baseline algorithms, respectively. The IUR-tree index and the RSKkNN algorithm are presented in Sections 5 and 6, respectively. In particular, we develop a cost model and analyze the complexity of our algorithm in Section 6.3. Sections 7 is dedicated to the CIUR-tree and the C2 IUR-tree. Section 8 reports on the experimental results and finally Section 9 concludes this article. 2. Problem Definition
We treat the textual content of a Web object as a bag of weighted words. Formally, a document is defined as {}, i = 1· · · m, where wi is the weight of word di . The weight can be computed by the well-known TF-IDF scheme [Salton 1988]. Let P be a universal Web object set. Each object p∈P is defined as a pair (p.loc, p.vct), where p.loc represents the spatial location information and p.vct is the associated text represented in vector space model. We define RSKkNN query as follows. Given a set of objects P and a query point q (loc,vct), RSKkNN(q, k, P ) finds all objects in the database that have the query point q as one of the ACM Transactions on Database Systems, Vol. V, No. N, Article 1, Publication date: January YYYY.
1:4
Y. Lu et al.
k most “similar” neighbors among all points in P , where the similarity metric combines the spatial distance and textual similarity. Following the existing work [I.D.Felipe et al. 2008; Cong et al. 2009], we define a similarity metric, called spatial-textual similarity1 , in Eqn(1), where parameter α ∈ [0, 1] is used to adjust the importance of the spatial proximity and the textual similarity factors. Note that users can adjust the parameter α at the query time. SimST (p1 , p2 ) = α ∗ SimS(p1 .loc, p2 .loc) + (1 − α) ∗ SimT (p1 .vct, p2 .vct) dist(p1 .loc, p2 .loc) − φs ψs − φs EJ(p1 .vct, p2 .vct) − φt SimT (p1 .vct, p2 .vct) = ψt − φt
SimS(p1 .loc, p2 .loc) = 1 −
(1) (2) (3)
As shown in Eqn(2), the spatial proximity SimS(., .) of objects p1 , p2 ∈ P describes the spatial closeness based on the Euclidean distance dist(p1 .loc, p2 .loc). In Eqn(2), φs and ψs denote the minimum and maximum distance of pairs of distinct objects in P . They are used to normalize the spatial distance to the range [0, 1]. The textual similarity SimT (., .) of objects p1 , p2 ∈ P is shown in Eqn(3). Similarly, φt and ψt are the minimum and maximum textual similarity of pairs of distinct objects in the dataset, respectively. Specifically, EJ(p1 .vct, p2 .vct) is the Extended Jaccard [Tan et al. 2005], which is widely used in textual similarity computing, as shown in Eqn(4). ∑n ′ j=1 wj × wj ′ ⃗ , (4) EJ(⃗v , v ) = ∑n ∑ ∑ n n ′ ′2 2 j=1 wj × wj j=1 wj − j=1 wj + where ⃗v =< w1 , · · · , wn >, v⃗′ =< w1′ , · · · , wn′ > Alternatively, the textual similarity can also be measured by other distance measures such as cosine similarity, Euclidean similarity, Pearson Correlation Coefficient (PCC) [Strehl et al. 2000], averaged Kullbak-Leibler divergence (KL divergence) [Kullback and Leibler 1951], or the categorical similarity measures in [Boriah et al. 2008]. For example, cosine similarity between two textual vectors ⃗v and v⃗′ is given in Eqn. (5), where cosine similarity is defined by the cosine of the angle between two vectors independent from the length difference of the two vectors. Therefore, cosine is translation variant but scale invariant, whereas Euclidean similarity is translation invariant but scale variant. Extended Jaccard combines both aspects of direction and length differences of the two vectors. Previous studies [Huang 2008; Lee and Welsh 2005; Haveliwala et al. 2002; Strehl et al. 2000], which extensively compare various distance measures for text, show that there is no similarity measure that outperforms other measures in all cases. In fact, their difference in many applications is not significant. In this article, we present our new algorithms using the extended Jaccard, but it is important to note that our algorithm is not specific to the extended Jaccard and we will discuss how to extend our method to other similarity measure such as cosine similarity. ∑n ′ j=1 wj × wj ′ ⃗ √∑ , Cosine(⃗v , v ) = √∑ n n 2 ′2 j=1 wj ∗ j=1 wj
(5)
where ⃗v =< w1 , · · · , wn >, v⃗′ =< w1′ , · · · , wn′ > Formally, given a query object q=(loc, vct), an object q∈P is one of k most similar objects with p, denoted by q∈ SKkNN (p, k, P ) if and only if it satisfies the condition: |{o ∈ P |SimST (o, p) ≥ SimST (q, p)}| < k 1 Hereafter,
“spatial-textual similarity” is also called “similarity” for short.
ACM Transactions on Database Systems, Vol. V, No. N, Article 1, Publication date: January YYYY.
Efficient Algorithms and Cost Models for Reverse Spatial-Keyword k-Nearest Neighbor Search 1:5
Given a query q, RSKkNN query retrieves objects whose k most similar objects include q. It is formally defined as: RSKkNN (q, k, P ) = {p ∈ P |q ∈ SKkNN (p, k, P )}
(6)
For example, in Fig. 1, given a query q(12, 6) whose textual vector is , and k=2, α=0.6, then RSKkNN (q, k, P )={p1 , p4 , p5 , p9 }. Note that p1 is an answer due to the high textual similarity between p1 and q. 3. Related Work
In this section, we review the existing studies on reverse kNN queries, and analyze why they are not applicable to process RSKkNN queries. We also extensively survey related works on spatial keyword queries and cost models on R-tree family index structures. 3.1. Reverse k Nearest Neighbor Queries
Reverse k Nearest Neighbor (RkNN) queries have applications in decision support systems, profile based marketing, data streaming, document databases, and bio-informatics. There exist a host of works on RkNN queries. The existing approaches for RkNN can be grouped into the following two categories. 1) The first class of solutions is based on pre-computation. In particular, [Korn and Muthukrishnan 2000] shows a pre-processing based algorithm for answering RNN (i.e., k=1) queries. In the preprocessing stage, each object’s nearest neighbor is found, and a circle centered at the object with distance to its nearest neighbor as radius is created. Given a query node q, if q appears in the circle of node n, then n is one of answers. [Lin et al. 2003] proposes an index structure called RDNNtree (R-tree containing Distance of Nearest Neighbors) to facilitate the processing of RNN queries. Those pre-computing methods naturally extends to k > 1. However, they cannot work for RSKkNN queries, since the value of k in an RSKkNN query is given online at the query time. It is impractical to pre-compute each object’s k spatial-textual nearest neighbors for all possible values of k. 2) The second class of solutions is based on ℓp norm metric space [Stanoi et al. 2000; Stanoi et al. 2001; Tao et al. 2004; Wu et al. 2008b; Cheema et al. 2011; Achtert et al. 2009]. Stanoi et al. [Stanoi et al. 2000] propose an algorithm for processing an RNN query that does not require the pre-computation of the nearest neighbor circles. The idea is to split the data space centered at query point into six regions of 60◦ each. The algorithm finds the query point’s k nearest neighbors in each of the six regions and examines whether they are the query’s RkNN by checking whether the query point is one of their k nearest neighbors. This algorithm reduces an RkNN query to six conditional kNN queries and 6 ∗ k kNN queries. A variation of RkNN is called the bichromatic RNN query, for which Stanoi et al. further propose a Voronoi based algorithm [Stanoi et al. 2001]. They observe that a bichromatic RNN query’s influence region is the query point’s Voronoi cell. Thus, they design a method that comprises three steps: approximate, refine and filter. Their methods cannot be extended to process RSKkNN queries as the textual space is a high dimensional space and the cardinality of regions increases exponentially in terms of the number of n dimensions (i.e., 3n -1 for n dimensions [Singh et al. 2003]). [Tao et al. 2004], [Wu et al. 2008b], and [Cheema et al. 2011] propose bisector-based solutions. These solutions exploit the following geometric property of a bisector: a bisector between two points p and q (query point) divides the data space into two half-planes, and p is closer than q to the points in the half-plane that contains p. Hence, if an object is contained in more than k such half-planes, there exist more than k objects that are closer to the object than the query point, and therefore the object cannot be a result of the RkNN query q. Achtert et al. [Achtert et al. 2009] propose an algorithm that processes RkNN queries by estimating the lower bound and the upper bound of an object’s (and an index entry’s) distance to its kth nearest neighbor. If the distance between a query point and an object is larger than the estimated upper bound of the kNN distance, the object is pruned. On the other hand, if the distance between the query point and an object is shorter than the estimated lower bound of the kNN distance, the ACM Transactions on Database Systems, Vol. V, No. N, Article 1, Publication date: January YYYY.
1:6
Y. Lu et al.
object belongs to the result set. As more objects are retrieved, their upper bound and lower bound of kNN distance becomes tighter, and finally all objects are either pruned out or included in the final result set. To sum up for the second class of solutions, the previous studies are based on ℓp norm metric space and they exploit geometric properties to facilitate the processing of RkNN queries. Unforturally, they cannot address the RSKkNN queries, which combines the RkNN and textual similarity search. This is because with textual information, the geometric properties are lost. Further, the ℓp norm metric space is not suitable for computing the similarity between textual descriptions as their vector representations are high dimensional and sparse [Tan et al. 2005]. 3.2. Spatial Keyword Queries
Queries on spatial objects associated with textual information are closely related to the RSKkNN query. Top-k spatial keyword query, proposed in [I.D.Felipe et al. 2008], is a combination of a top-k spatial query and a keyword query. The result of a top-k query is a list of the top-k objects ranked according to a ranking function that considers both distance and text relevance. Locationaware top-k text retrieval (LkT) query [Cong et al. 2009] is similar to top-k spatial keyword query. In an LkT query, the text relevancy score can be computed using the information retrieval models (e.g., TF-IDF model). Cong et al. [Cong et al. 2009] propose an indexing structure called IR-tree for processing the LkT query. During the processing of an LkT query, the minimum spatial-textual similarity between query and index node is computed to guide the search for the top k spatialtextual relevant objects. In addition, the LkPT query [Cao et al. 2010] extends the LkT query by taking “prestige” into account in text relevance computation where a relevant object with nearby objects that are also relevant is prestigious and thus preferred. These queries are different from the RSKkNN queries, which can be considered as the “reverse” version of the spatial keyword query. Indexing Structures for Spatial Keyword Queries Several indexing structures have been proposed to facilitate the processing of spatial keyword queries ([Vaid et al. 2005] [Zhou et al. 2005] [I.D.Felipe et al. 2008] [Cong et al. 2009] [Zhang et al. 2009] [Li et al. 2011]). Vaid et al. [Vaid et al. 2005] propose two spatial-textual indexing schemes based on grid indexing and inverted file. Zhou et al. [Zhou et al. 2005] consider three hybrid index structures that integrate inverted files and R*-tree in different ways: (i) inverted file and R*-tree index, (ii) first inverted file then R*-tree, (iii) first R*-tree then inverted file. It is shown that the second scheme works the best for location-based web search. The IR-tree [Cong et al. 2009] structure augments an R-tree node with inverted lists, which is suitable for location-aware top-k text retrieval (LkT) queries that load posting lists only for the query keywords. Li et al. [Li et al. 2011] presents an index structure, which is also called IR-tree. To distinguish the two IR-trees, we refer to the IR-tree [Li et al. 2011] as the Li-IR-tree, and that in [Cong et al. 2009] as the Cong-IR-tree. The difference between the Cong-IR-tree and the Li-IRtree is that the Cong-IR-tree stores the inverted files for each node separately while the Li-IR-tree stores one integrated inverted file for all the nodes. More specifically, the posting list for each term in the Li-IR-tree corresponds to the concatenation of the posting lists of all the nodes of the CongIR-tree. Note that with the RSKkNN queries, we need the information about all the words in an entry to estimate similarity between entries, which are provided in neither Cong-IR-tree nor Li-IRtree. In [Khodaei et al. 2012], Khodaei et. al also combine a spatial distance measure with a textual distance measure. They use TF/IDF for text and then devise their own spatial similarity measure to make it consistent with the fundamentals of TF/IDF. This way they could use a single inverted-file index structure for both the textual and spatial features of the objects. However, they focuse on the top-k queries only. 3.3. Reverse top-k queries
Recent work on reverse top-k queries [Vlachou et al. 2010] is also relevant to our work. Reverse top-k query is a “reverse” version of top-k query and it also finds the objects that are influenced by ACM Transactions on Database Systems, Vol. V, No. N, Article 1, Publication date: January YYYY.
Efficient Algorithms and Cost Models for Reverse Spatial-Keyword k-Nearest Neighbor Search 1:7
a query object. Given a set of user preferences and a set of objects, a reverse top-k query finds an object for a set of users for whom the object is one of their top-k objects. Reverse top-k queries and RSKkNN queries are different in the following two aspects. First, RSKkNN queries consider spatial proximity while reverse top-k queries do not. Second, RSKkNN queries work on objects associated with location information and text description while reverse top-k queries work on objects and user preferences described by a set of numerical attribute values. Due to these fundamental differences, techniques developed for reverse top-k queries are not applicable to RSKkNN queries. 3.4. Cost models on R-tree family index structures
In this article, for the first time (to the best of our knowledge), we propose a cost model and theoretical analysis for a query that considers the fusion of both location proximity and textual similarity. Hence, in this section, we extensively review performance analysis on the R-tree family index structures that has been studied for various spatial queries in the past decades. The previous studies on cost model can be divided into five groups: (i) for range queries and window queries; (ii) for k nearest neighbor queries; (iii) for spatial join queries; and (iv) for continuous queries; and (v) for reverse k nearest neighbor queries in Lp -norm space. 3.4.1. Cost analysis for range queries and window queries. There has been a large body of work [Pagel et al. 1993; Kamel and Faloutsos 1993; Faloutsos and Kamel 1994; Theodoridis and Sellis 1996; Papadopoulos and Manolopoulos 1997] that studies the cost models for predicting the performance of R-trees on the execution of range (or window) queries. Specifically, Faloutsos et al. [Faloutsos et al. 1987] present a model that estimates the performance of R-trees and R+ -trees assuming uniform distribution of the data. Kamel and Faloutsos [Kamel and Faloutsos 1993] and Pagel et al. [Pagel et al. 1993] independently estimate the number of disk accesses for window queries, assuming that the MBR of each node of the R-tree is already given. Based on the work [Kamel and Faloutsos 1993; Pagel et al. 1993], Foloutsos and Kamel [Faloutsos and Kamel 1994] use a property of the dataset called fractal dimension to model R-tree performance for non-uniform distribution. However the model [Faloutsos and Kamel 1994] is applicable only to point datasets. Theodoridis et al. [Theodoridis and Sellis 1996] propose an analytical model which predicts the performance of R-trees for range queries based on the density property of the dataset without assuming uniform data distribution. The model works for both point and non-point datasets. 3.4.2. Cost analysis for k nearest neighbor queries. Papadopoulos et al. [Papadopoulos and Manolopoulos 1997] provide lower and upper bounds of the nearest neighbor query performance on R-trees for the L2 norm metric. Korn et al. [Korn et al. 2001] extends the work [Papadopoulos and Manolopoulos 1997] for k-nearest neighbor queries with arbitrary parameter k. However, the bounds [Korn et al. 2001] become excessively loose when the dimensionality of k increases, rendering it impractical for high dimensional data. Berchtold et al. [Berchtold et al. 1997] present a cost model for query processing in high-dimensional data spaces, and Tao et al. [Tao et al. 2004] propose a cost model for kNN queries in low and medium dimension spaces. 3.4.3. Cost analysis for spatial join queries. To the best of our knowledge, the work by Huang et al. [Huang et al. 1997] is the first attempt to provide a formula to predict the efficiency for spatial join queries. Theodoridis et al. [Theodoridis et al. 2000] present a model that predicts the performance of R-tree-based index structures for selection queries and an extension of this model for supporting join queries. Moreover, an analytical model and a performance study of the similarity join operation is given in [Bohm and Kriegel 2001]. Furthermore, [Corral et al. 2006] gives a cost model for the k-Closest-Pairs query (a type of distance join in spatial databases), which discovers the k pairs of objects formed from two different datasets with the k smallest distances. 3.4.4. Cost analysis for continuous queries. [Tao and Papadias 2003] presents three cost models for continuous queries, including continuous window queries, continuous k nearest neighbor queries and continuous spatial joins, based on TPR-tree [Saltenis et al. 2000]. The three models are based on a general framework for transforming any continuous spatial query to the corresponding timeACM Transactions on Database Systems, Vol. V, No. N, Article 1, Publication date: January YYYY.
1:8
Y. Lu et al.
parameterized version query, which returns: (i) the objects that satisfy the corresponding spatial query, (ii) the expiry time of the result, and (iii) the change that causes the expiration of the result. 3.4.5. Cost analysis for reverse k nearest neighbor queries in Lp -norm space. I/O cost analysis for both monochromatic and bichromatic RkNN queries in Lp -norm space are studied in the recent work [Cheema et al. 2011; 2012]. Their methods are based on the Euclidian geometric properties and a concept of influence zone, which is the area such that every point inside this area is the RkNN of query object q and every point outside this area is not the RkNN. Finally, a preliminary version of this work appears in [Lu et al. 2011]. But in this journal article, we first propose a new cost model to theoretically analyze the performance of algorithms dealing with both location proximity and textual similarities, which is not discussed in any previous literature (to our best knowledge). We also propose a new index tree called C2 IUR tree, which considers both location proximity and textual similarity during the construction of the index tree. 4. Baseline Methods
As discussed in Section 3, the similarity metric proposed in Section 2 combines both textual and location information, and therefore the existing methods for RkNN queries cannot be directly employed to handle RSKkNN queries due to the new challenge. One might be tempted to answer an RSKkNN query by separately computing the results for the reverse spatial k nearest neighbors (RSkNN) and the reverse keyword k nearest neighbors (RKkNN), and then select a proper subset from the union of these two results. Besides performance shortcomings, this idea has another serious problem: the result of an RSKkNN query may not even be a subset of the union of the results from the corresponding RSkNN and RKkNN queries. To illustrate, see the example given in Figure 2, assuming k = 1, α = 0.5, we have RSkNN(q) = {p1 }, RKkNN(q) = {p2 }, whereas RSKkNN(q) = {p3 }. This is because q is the nearest neighbor of p1 by spatial distance and the nearest neighbor of p2 by textual similarity only. However, by combing spatial and textual distance, q is neither the nearest neighbor of p1 nor p2 . (In fact, q is the nearest neighbor of p3 .) Therefore, RSKkNN results cannot be directly derived from the union of the results of RSkNN and RKkNN queries. y p2 p3 q p1 x
(a) Spatial Distribution
p1 p2 p3 q
x 1.5 4 2 1
y 1 4 2 1
ear ry ione ortsw vectors stat sp ObjVct1 1 1 ObjVct2 9 9 ObjVct3 4 4 ObjVctQ 9 9
(b) Locations and vectors of points in (a)
Fig. 2. Example for illustrating the relationship of RSkNN, RKkNN and RSKkNN
In the following, we develop two non-trivial baseline algorithms to correctly find all answers for RSKkNN queries. First, for each object o ∈ P , we pre-compute its location proximity and textual similarity, respectively, with each of the other objects to obtain two sorted lists o.Ls and o.Lt . In o.Ls , the objects are sorted in ascending order of their spatial distance to o, and in o.Lt in descending order of their textual similarity to o. The baseline algorithm is outlined in Algorithm 1. It takes as arguments the database P , the two pre-computed lists for each object in P and the RSKkNN query q. For each object o ∈ P , we find its kth similar object o.ST kNN that has the highest score according to the function in Eqn(1). We find o.stkNN by using the threshold algorithm (TA) [Fagin et al. 2003] on the two precomputed lists o.Ls and o.Lt (Line 2). If the spatial-textual similarity between o and its k-th similar object o.stkNN is equal to or larger than the similarity between o and query q, then we prune object o, otherwise, we add o as a result (Line 3-6). Note that this method can also handle dynamic parameters k and α. ACM Transactions on Database Systems, Vol. V, No. N, Article 1, Publication date: January YYYY.
Efficient Algorithms and Cost Models for Reverse Spatial-Keyword k-Nearest Neighbor Search 1:9
For the second baseline, we utilize the available indexes (i.e. IR-trees proposed in [Cong et al. 2009] or [Li et al. 2011]) that combine spatial and textual information to compute the ST kNN object of o. That is, for each object o, we find its top-k most similar objects using the existing spatial-textual kNN query techniques, and if the kth result is less than the similarity between o and query q, then o is added to the result set. Therefore, the only difference between the first and the second baseline algorithms lies in Line 2 (Algorithm 1), where the second baseline use the optimized IR-tree to compute the nearest k spatial-textual neighbors. As shown later, we will experimentally compare these two baseline algorithms to each other and also to our proposed algorithms.. ALGORITHM 1: Baseline (P : Database objects, Two pre-computed lists Ls and Lt for each object o in P , q: query) Output: All objects o, s.t. o∈RSKkN N (q, k, P ). 1: for each object o in P do 2: o.ST kNN ← TA(k, o.Ls , o.Lt ); 3: if SimST (o, o.stkNN ) ≥ SimST (o, q) then 4: Prune object o; 5: else 6: Report object o as a result;
5. A Hybrid Index: IUR-tree
To answer an RSKkNN query efficiently, we propose an effective hybrid index called IUR-tree (Intersection-Union R-tree), which is a combination of textual vectors and R-trees [Guttman 1984]. Each node of an IUR-tree contains both spatial location and textual information. Each leaf node contains entries2 in the form of (ObjP tr, ObjLoc, ObjV ct), where ObjPtr refers to an object in the database; ObjLoc represents the coordinates of the object; and ObjVct is the textual vector of the object. A non-leaf node R of IUR-tree contains entries in the form of (P tr, mbr, IntU niV ct, cnt), where 1) Ptr is the pointer to a child node of R; 2) mbr is the MBR of the child node of R; 3) IntUniVct is the pointer to two textual vectors: an intersection vector and a union vector. Each item/dimension in a textual vector corresponds to a distinct word that appears in the documents contained in the subtree rooted at P tr. The weight of each item in the intersection (resp. union) textual vector is the minimum (resp. maximum) weight of the items in the documents contained in the subtree rooted at P tr. The two vectors are used to compute the similarity approximations (to be presented). Note that the two vectors are not stored inside the nodes of the IUR-tree. The reason is that this guarantees the sizes of all index nodes are the identical and fixed; and 4) cnt is the number of objects (in the leaf nodes) in the subtree rooted at P tr. Figure 3 illustrates the IUR-tree for the objects in Figure 1. The intersection and union textual vectors are presented in Fig. 5. For example, the weights of item camera in the intersection and union vectors (IntU niV ct2) of an entry in node N 3 are 7 and 8, respectively, which are the minimum and maximum weights of the item in the two text vectors ObjV ct7 and ObjV ct8 (shown in Fig.1) in node N 1. The construction of the IUR-tree is presented in Algorithm 2. It uses an insert operation that is adapted from the corresponding insert operation of the R-tree [Guttman 1984]. To update an IUR-tree incrementally, we use the order preserving minimal perfect hashing function (OPMPHF )3 [A.Fox et al. 1991] to organize keywords contained in the subtree of the index node N in the form of (di .p, di .w), i ∈ [0, m], where m is the total number of words contained in the document of N , 2 For
brevity, objects in the dataset and the index nodes are collectively referred as entries. motivation to use this hash function is because of the property of the order preserving. When we lookup a key by reading an OPMPHF-hashed vector, we can stop earlier if the key does not appear in the vector. But other hash functions also work for the purpose of IUR-trees. 3 The
ACM Transactions on Database Systems, Vol. V, No. N, Article 1, Publication date: January YYYY.
1:10
Y. Lu et al. N [0, 0] [11,16] 5
[14,10] [25,22] 4 IntUniVct5
IntUniVct6
N [14,10] [19,15] 2 IntUniVct1
[6, 0] [11,5] 2
IntUniVct3
[0,11] [4,16] 3 IntUniVct4
IntUniVct2 N1
N [14, 15] [14, 15] ObjVct3 p3
N
[18,20] [25,22] 2
[19, 10] [19, 10] ObjVct9 p9
N [25,22] [25,22] ObjVct8 p8
[18,20] [18,20] ObjVct7 p7
N
[11,0] [11,0] ObjVct4 p4
[6, 5] [6, 5] ObjVct5 p5
[3, 12] [3, 12] ObjVct1 p1
[4,16] [4,16] ObjVct2 p2
[0,11] [0,11] ObjVct6 p6
Fig. 3. The IUR-tree of Figure 1
IntUniVct1 IntUniVct2 IntUniVct3 IntUniVct4 IntUniVct5 IntUniVct6
IntVct1 IntVct2 IntVct3 IntVct4 IntVct5 IntVct6
ry ear er era p ione tsw stat spor pan diap cam lapto
ry ear per era top ione rtsw n stat spo pa dia cam lap
0 0 4 1 0 1
1 1 7 8 1 8
0 0 4 1 0 1
1 0 1 0 0 0
1 0 1 0 0 0
1 7 0 0 1 0
1 7 0 0 1 0
UniVct1 UniVct2 UniVct3 UniVct4 UniVct5 UniVct6
1 1 7 8 1 8
4 0 1 8 4 8
4 0 1 8 4 8
4 8 0 4 8 4
4 8 0 4 8 4
Fig. 4. Text vectors for IUR-tree in Figure 2
di .p is an integer (position in the word collection) hashed from word di using OPMPHF , and di .w is the weight of word di . In particular, in Algorithm 2, Function Convert() in Line 1 is to convert a document to a vector in the form of (di .p, di .w). Lines 2v14 use an R-tree based implementation of ChooseLeaf and node-split and -append with text vectors. We modify the standard AdjustT ree method to maintain the text description (Lines 15 and 19): if a pair (di .p, di .w) is inserted to entry E, then the intersection and union vectors of each E’s ancestor should be updated recursively. 6. RSKkNN Query Algorithm
In this section, we develop an efficient algorithm to answer RSKkNN queries. At high-level, the algorithm descends the IUR-tree in the branch and bound manner, progressively computing the upper and lower thresholds for each entry E. Then the algorithm decides whether to prune an entry E, to report all objects in E as results, or to consider objects of E as candidates. In the following, we present a novel approach to compute the lower and upper bounds of similarity, denoted kNNL(E) and kNNU(E), between a node E in IUR-trees and its kth most similar objects in Section 6.1, and Section 6.2 is dedicated to the details of the algorithm. We summarize the symbols used in this section in Table I. 6.1. Computing Lower and Upper Bounds
For each entry E in an IUR-tree, we need compute the lower and upper bounds of similarity between E and its kth most similar object, denoted by kNNL(E) and kNNU(E), respectively. 6.1.1. Similarity Approximations. To efficiently compute kNNL(E) and kNNU(E) during IUR-tree traversal, we make full use of each entry traveled by approximating the similarities among entries, and by defining minimal and maximal similarity functions. We first present the definitions for the spatial distance approximation, which is given in previous works (e.g., [N.Roussopoulos et al. 1995; Achtert et al. 2009]), and then concentrate on the new textual part. ACM Transactions on Database Systems, Vol. V, No. N, Article 1, Publication date: January YYYY.
Efficient Algorithms and Cost Models for Reverse Spatial-Keyword k-Nearest Neighbor Search 1:11 ALGORITHM 2: Insert (MBR, document) 1: T extV ct←Convert(document); //Covert document into text vector in form of (di .p, di .w). 2: N ← ChooseLeaf(MBR); 3: add T extV ct and MBR to node N ; 4: if N needs to be split then 5: {O, P } ← N .split(); 6: if N .isroot() then 7: initialize a new node M ; 8: M .append(O.M BR, O.T extV ct); 9: M .append(P.M BR, P.T extV ct); 10: StoreNode(M ); 11: StoreNode(O); 12: StoreNode(P ); 13: R.RootNode ← M ; 14: else 15: AdjustTree(N.P arentN ode, O, P ); 16: else 17: StoreNode(N ); 18: if ¬N .isroot() then 19: AdjustTree(N.P arentN ode, N , null); Table I. Summary of the notations used E, E ′ kNNL(E) kNNU(E) MinS(E, E ′ ) MaxS(E, E ′ ) MinMaxS(E, E ′ ) MinST(E, E ′ ) TightMinST(E, E ′ ) MaxST(E, E ′ )
Two entries (nodes) in IUR-trees The lower bound of similarity between E and its kth most similar objects The upper bound of similarity between E and its kth most similar objects The minimum spatial distance between the objects in E and E ′ The maximum spatial distance between the objects in E and E ′ The minimal overestimation of the spatial distances between the objects in E and E ′ The lower bound of spatial-textual similarity between the objects in E and E ′ A tight lower bound of spatial-textual similarity between the objects in E and E ′ The upper bound of spatial-textual similarity between the objects in E and E ′
Spatial distance approximation Given two index entries E and E ′ , we define three distance approximation as follows. i) MinS(E,E ′ ) always underestimates the distance between the objects in subtree(E) and subtree(E ′ ): ∀o ∈ subtree(E), ∀o′ ∈ subtree(E ′ ): dist(o,o′ )≥ MinS(E,E ′ ); ii) MaxS(E,E ′ ) always overestimates the distance between the objects in subtree(E) and subtree(E ′ ): ∀o ∈ subtree(E), ∀o′ ∈ subtree(E ′ ): dist(o,o′ ) ≤ MaxS(E,E ′ ); iii) MinMaxS(E,E ′ ) is the minimal distance such that: ∀o ∈ subtree(E), ∃o′ ∈ subtree(E ′ ): dist(o,o′ ) ≤ MinMaxS(E,E ′ ). Intuitively, MinMaxS(E,E ′ ) is the minimal overestimation of the distances between the objects in subtree(E) and subtree(E ′ ).
E MinS(E,E’)
E’
MaxS(E,E’) MinMaxS(E,E’)
Fig. 5. Illustration of spatial approximation
ACM Transactions on Database Systems, Vol. V, No. N, Article 1, Publication date: January YYYY.
1:12
Y. Lu et al.
We assume that the page region of an entry E which is a rectangle is specified by its lower left corner (E.l1 , E.l2 ) and upper right corner (E.r1 , E.r2 ). Furthermore, the center of the page region is denoted by the vector (E.m1 , E.m2 ) with E.mi = (E.li + E.ri )/2. The MinS, MaxS and MinMaxS approximations defined for E and E ′ can be computed as follows. √ ′ 2 MinS(E,E ) = d1 + d22 , where di =pi − p′i (i=1 or 2), and ′ ′ ′ pi = E.ri , pi = E .li if E.ri < E .li (7) p′i = pi = E.li , p′i = E ′ .ri if E.li > E ′ .ri di = 0 otherwise √ MaxS(E,E ′ ) = d21 + d22 , where di = p′i − pi (i=1 or 2), and { pi = E.li , p′i = E ′ .ri if E.mi ≤ E ′ .mi (8) pi = E ′ .li , p′i = E.ri otherwise √ MinMaxS(E,E ′ ) = min (pi − p′i )2 + max {(E.lj − E ′ .rj )2 , (E.rj − E ′ .lj )2 }, where 1≤i≤2
1≤j≤2,j̸=i
{ ′ E .li ′ pi = E ′ .ri
if E.mi 0.
min{x,x′ } max{x,x′ } ,
Given xi , x′i , x′′i , where i ∈ [1, n], such that f dim(xi , x′i ) ≥ f dim(xi , x′′i ) and xi ,x′i , x′′i > 2xi x′i 2xi x′′ i 0, we can prove that x2 +x ′ 2 ≥ x2 +x′′ 2 , then we can derive inequality (12) is true by means of i i i i mathematical induction. Thus extended Jaccard is a similarity preserving function, i.e., if ∀i ∈ [1, n], √ p, p⃗′ )≥EJ(⃗ p, p⃗′′ ). Therefore Claim 2 holds. xi ≤ x′i x′′i , and x′i ≤ x′′i , then EJ(⃗ ∑n
′ i=1 xi xi ∑n x2i +x′i 2 i=1 2
∑n
xi x′′i ≥ ∑ i=1 2 ′′ 2 xi +xi n i=1
n ∑
=⇒ ∑ n i=1
x2i +
(12)
2
n ∑
xi x′i
i=1 n ∑
n ∑
i=1
i=1
x′i 2 −
xi x′i
→ − − → → → =⇒ EJ(− p , p′ ) ≥ EJ(− p , p′′ )
≥ ∑ n i=1
x2i +
xi x′′i
i=1 n ∑
n ∑
i=1
i=1
x′′i 2 −
xi x′′i
Based on Claim 2, we proceed to prove the property of M inST , which is the fusion of M axS and M inT . √ M inT in Eqn(11): For each dimension j, as shown in Figure 6(a), when E.ij · E.uj ≥ ′ √ E .i E.ij j ′ ′ ′ ′ · E .u ′ E .i , then for ∀E.w ∈ [E.ij , E.uj ] and ∀E .w ∈ [E .i ′ j j (Case 1), i.e., E.uj ≤ E .u j , E .uj ], j ′ E .i
′ min{E.w ,E .w }
j . Thus according to Claim 2, the assignments E.wj = E.uj , we have E.ujj ≤ max{E.wjj ,E.w ′ j} ′ ′ E .wj = E .ij can guarantee that M inST (E, E ′ ) is the minimum similarity between two entries E and E ′ , i.e., ∀ o∈subtree(E), ∀o′ ∈subtree(E ′ ), M inT (E, E ′ ) ≤SimT (o, o′ ). And for Case 2, the property of M inST can be similarly proved. For M inST in Eqn(10), since ∀o∈E, ∀o′ ∈E ′ are enclosed in the MBRs of index nodes E and E ′ respectively, the maximum Euclidian distance between E and E ′ M axS(E, E ′ ) is no less than the ′ )−φs ) Euclidian distance between o and o′ , i.e., M axS(E, E ′ ) ≥ dist(o, o′ ), thus α(1 − M axS(E,E ψs −φs ′
)−φs ≤ α(1 − dist(o,o ), where φs , ψs are constants and α∈[0, 1]. And as proved above that ψs −φs ∀o∈E, ∀o′ ∈E ′ , M inT (E, E ′ ) ≤SimT (o, o′ ). Thus Eqn(10) can guarantee that ∀o∈E, ∀o′ ∈E ′ , M inST (E, E ′ ) ≤SimST (o, o′ ), which concludes the proof.
ACM Transactions on Database Systems, Vol. V, No. N, Article 1, Publication date: January YYYY.
1:14
Y. Lu et al. Case1
Case2
E.i r ⋅ E.ur E.i r E '.i r ⋅ E '.ur
E .i j ⋅ E .u j
E .i j ⋅ E .u j
E.u j
E.i j
E '.i j ⋅ E '.u j
E '.i j
E '.u j
E '.i j
(a) for each dimension j in
E.i j
j
E '.i j ⋅ E '.u j E '.u j
E '.i r
M inT (E, E ′ )
Case3
E '.u r
Case4
E.i j E.u j
E.u j E.i j E.u j
E '.u j
E.ur
(b) for the rth dimension in TightMinT(E, E ′ )
Case2
Case1
E '.i
E.u j
E.i j
E '.i j E '.u j
E.i j
E '.u j
E '.i j
E '.i j
E.u j
E '.u j
(c) for each dimension j in M axT (E, E ′ ) Fig. 6. Illustration to the estimation of MinT, TightMinT and MaxT
Lemma 1 suggests that there are at least |E ′ | objects o′ in E ′ s.t. ∀o∈E, SimST (o, o′ ) ≥ M inST (E, E ′ ). Therefore, we can use M inST (E, E ′ ) to estimate the lower bound kNNL (E) that should be greater than M inST (E, E ′ ). We next propose another similarity definition which is larger than M inST (E, E ′ ) and thus may be used as a tighter bound estimation. D EFINITION 6.3 (T ightM inST ). A tight lower bound of spatial-textual similarity between two entries E and E ′ in IUR-tree, denoted as T ightM inST (E, E ′ ), is defined as: { T ightM inST (E, E ′ ) = max
M inM axS(E, E ′ ) − φs M inT (E, E ′ ) − φt ) + (1 − α) , ψs − φs ψt − φt } M axS(E, E ′ ) − φs T ightM inT (E, E ′ ) − φt α(1 − ) + (1 − α) ψs − φs ψt − φt α(1 −
(13)
where, M inM axS(E, E ′ ) [Achtert et al. 2009] is showed in Equation (9). T ightM inT (E, E ′ ) = ′ E.wr × E .w r +
max
1≤r≤n
′ 2 − E.w × E ′ .w + E.wr2 + E .w r r r
n ∑
′ E.wj × E .w j
j=1,j̸=r n ∑
(14)
′ 2 − E.w × E .w ′ (E.wj2 + E .w j j) j
j=1,j̸=r
{
′ ′ ′ E .u if E.ir ∗ E.ur > E .i r r ∗ E .ur ′ E .ir otherwise √ { ′ E.ir if E.ir ∗ E.ur < E .w r; E.wr = E.ur otherwise;
′ E .w r =
(15) (16)
′ and E.wj and E .w j are assigned as Eqn(11).
Intuitively, the particular reason why T ightM inST can provide a tighter lower bound than M inST is that T ightM inST guarantees that there is at least one object o′ ∈ E ′ s.t. ∀o∈E, SimST (o, o′ ) ≥ T ightM inST (E, E ′ ). But M inST can guarantee that ∀o ∈ E, ∀o′ ∈ E ′ , ACM Transactions on Database Systems, Vol. V, No. N, Article 1, Publication date: January YYYY.
Efficient Algorithms and Cost Models for Reverse Spatial-Keyword k-Nearest Neighbor Search 1:15
SimST (o, o′ ) ≥ M inST (E, E ′ ). Therefore, this different property gives us an extra opportunity to carve out a tighter bound. The formal description and proof are as followed. L EMMA 2. T ightM inST (E, E ′ ) has the property that ∃ o′ ∈ E ′ s.t. ∀o∈E, SimST (o, o′ ) ≥ T ightM inST (E, E ′ ). P ROOF. Eqn(13) suggests that T ightM inST is composed of M inM axS, M inT , M axS and T ightM inT , which have the following properties respectively. M inM axS satisfies that ∃o′ ∈ E ′ , s.t. ∀o ∈ E, , dist(o, o′ ) ≤ M inM axS(E, E ′ ). M inT satisfies that ∀o ∈ E, ∀o′ ∈ E, EJ(o, o′ ) ≥ M inT (E, E ′ ). T ightM inT in Eqn(14): As shown the assignment of one dimension r in Figure 6(b), when ′ √ ′ √ min{E.wr ,E .w r} ′ ′ ′ ′ ′ ′ ≤ E .ir · E .u ′ r < E.ir · E.ur , let E .wr =E .ur , then ∃E .wr ∈ [E .ir , E .ur ], max{E.wr ,E .w r} ′ √ min{E.wr ,E .u } r ′ . Then given E .w ′ r > E.ir · E.ur , let E.wr = E.ir so that ∀ E.wr ∈ [E.ir , E.ur ], max{E.wr ,E .u r} ′ min{E.wr ,E .w r} ′ max{E.wr ,E .w r}
′
min{E.ir ,E .wr } ′ ≥ max{E.i , Additionally, the rest dimension weights E.wj and E .w ′ j are r ,E .wr } ′ ′ assigned as Figure 6(a). Therefore, according to Claim 2, there exists an object o ∈E , the rth di′ ′ ′ mension of which is E .u r , so that ∀o∈E, SimT (o, o )≥T ightM inT (E, E ). Finally, to make the approximation accurate, we take the maximum as the final approximation for T ightM inT . T ightM inST (E, E ′ ) in Eqn(13): Since ∃ o′ ∈E ′ , ∀ o ∈E, dist(o, o′ ) ≤ M inM axS(E, E ′ ), moreover, since ∀o′′ ∈E, ∀o∈E, EJ(o, o′′ )≥M inT (E, E ′ ), so for o′ ∈E ′ , it is also true that ′ )−φs )+(1 − EJ(o, o′ ) ≥ M inT (E, E ′ ). Thus ∃o′ ∈E ′ , ∀o∈E, SimST (o, o′ )= α(1- dist(o,o ψs −φs ′
)−φt α) EJ(o,o ≥ α(1- M inM axS(E,E ψt −φt ψs −φs ′
′
)−φs
′
)−φt ) +(1-α) M inTψ(E,E . Similarly, ∃o′ ∈ E ′ , ∀o∈E t −φt ′
)−φs inT (E,E )−φt SimST (o, o′ ) ≥ α(1 − M axS(E,E ) + (1 − α) T ightM ψ . To make the approxiψs −φs t −φt mation accurate, the final approximation of T ightM inST (E, E ′ ) is the maximum one with the guarantee of satisfying the corresponding property.
As suggested from Lemma 2, there is at least one object o′ in E ′ s.t. ∀o∈E, SimST (o, o′ ) ≥ T ightM inST (E, E ′ ). Hence, unlike M inST which can contribute |E| objects, T ightM inST can contribute only one object to be the kN N s of E ′ , but T ightM inST is much tighter than M inST . D EFINITION 6.4 (M axST ). An overestimation of the spatial-textual similarity between two entries E and E ′ in IUR-tree, denoted as M axST (E, E ′ ), is defined as: M inS(E, E ′ ) − φs )+ ψs − φs M axT (E, E ′ ) − φt (1 − α) ψt − φt
M axST (E, E ′ ) = α(1 −
(17)
where M inS(E, E ′ ) is defined in Equation (7); and M axT (E, E ′ ) is: ∑n ′ j=1 E.wj × E .wj ∑ ∑ ∑n n n 2 2 ′ ′ j=1 E.wj + j=1 E .wj − j=1 E.wj × E .wj E.wj E.wj E.wj E.wj
′ ′ = E.ij , E .w j = E .uj ′ ′ = E.uj , E .w j = E .ij ′ = E .wj = E.uj ′ ′ = E .w j = E .uj
′ if E.ij > E .u j ′ if E.uj < E .i j ′ ′ if E .i j ≤ E.uj ≤ E .uj otherwise.
(18)
L EMMA 3. M axST (E, E ′ ) has the property that ∀ o′ ∈E ′ , ∀o∈E, SimST (o, o′ ) ≤ M axST (E, E ′ ). ACM Transactions on Database Systems, Vol. V, No. N, Article 1, Publication date: January YYYY.
1:16
Y. Lu et al.
The proof is similar to that in Lemma 1 and omitted here. C OROLLARY 6.5. There is at most one object o′ in E ′ s.t. ∀o∈E, SimST (o, o′ ) ≤ M axST (E, E ′ ). Note that Lemma 1 ∼ 3 also hold when the two entries E and E ′ in IUR-tree are identical, i.e., E = E′. 6.1.2. Lower and Upper Bound Contribution Lists. We are ready to explore the similarity approximations defined above to identify the lower and upper bounds kN N L (E), kN N U (E) of the most similar k objects for each entry E.
D EFINITION 6.6 (L OWER BOUND CONTRIBUTION LIST). Let T be a set of entries in IUR-trees that do not have ancestor-descendant relationships. Given an entry E∈T , a lower bound contribution list of E, denoted as E.L CL, is a sequence of t (1≤t≤k) triples sorted in descending order of si , where E ′ ∈T , si is M inST (E, E ′ ) or T ightM inST (E, E ′ ), and ′ ′ ′ |E | − 1 if si =M inST (E, E ) and E ̸=E ′ ′ numi = |E | − 2 if si =M inST (E, E ) and E ′ =E 1 otherwise. ∑t such that t is the minimal number fulfilling i=1 numi ≥ k. For si = M inST (E, E ′ ) either when E ′ ̸=E or E ′ =E, the rationale for subtracting one from |E ′ | (|E ′ |-1 when E ′ =E) is due to the potential presence of one object in E ′ with more precise approximation by T ightM inST . Example 6.7. Given k=3, three entries E, E1′ , E2′ in IUR-tree. Suppose the number of objects in E, denoted as |E|, is 3, and |E1′ |=2, |E2′ |=3. Furthermore, M inST (E, E) = 0.85, num = 1; T ightM inST (E, E) = 0.85, num = 1 M inST (E, E1′ ) = 0.55, num = 1; T ightM inST (E, E1′ ) = 0.61, num = 1 M inST (E, E2′ ) = 0.72, num = 2; T ightM inST (E, E2′ ) = 0.82, num = 1 Then we sort the similarity approximations above in descending order obtaining . ⟩ get the lower bound contribution ⟨ Since i=1 numi = 1 + 1 + 2 ≥ k = 3,′ thus we list of E is < 0.85, E, 1 >, < 0.85, E, 1 >, < 0.82, E2 , 2 > . Following the notations in Definition 6.6, we have the following lemma. L EMMA 4. If the t-th element (i.e., E.L CL.st ) is larger than or equal to the maximal similarity between E and q (denoted by M axST (E, q)), no answer exists in subtree(E), the subtree rooted at E, and thus we can safely prune subtree(E). P ROOF. The definition 6.6 for the lower bound contribution list of entry E is composed of M inST (E, E ′ ) and T ightM inST (E, E ′ ). If E ′ ̸=E, then there are at least one object o′ in E ′ such that ∀o ∈ E, T ightM inST (o, o′ ) ≥ M inST (E, E ′ ), and there are |E ′ | − 1 objects o′′ (o′′ ̸= o′ ) such that ∀o ∈ E, SimST (o, o′ ) ≥ M inST (E, E ′ ). While, if E ′ ̸=E, then for each object o ∈ E, there are at least one object o′ (o′ ̸= o) in E ′ such that SimST (o, o′ ) ≥ T ightM inST (E, E ′ ), and there are |E ′ | − 2 objects o′′ (o′′ ̸= o′ &&o′′ ̸= o) such that SimST (o, o′ ) ≥ M inST (E, E ′ ). Thus E.L CL.st obtained from Definition 6.6 satisfies that for all the objects o∈E, there are at least k objects o′ (o′ ̸=o) such that SimST (o, o′ ) ≥ E.L CL.st . If the condition in Lemma 4 holds, i.e., E.L CL.st ≥ M axST (E, q), then for all the objects o∈E, there are at least k distinct objects o′ (o′ ̸=o) such that SimST (o, o′ ) ≥ SimST (o, q). Hence we can safely prune away subtree(E), avoiding the traverse of subtree(E) during query processing. ACM Transactions on Database Systems, Vol. V, No. N, Article 1, Publication date: January YYYY.
Efficient Algorithms and Cost Models for Reverse Spatial-Keyword k-Nearest Neighbor Search 1:17
Thus we let the lower bound kNN L(E) be E.L CL.st . That is we can prune E if kNNL(E) ≥ M axST (E, q). D EFINITION 6.8 (U PPER BOUND CONTRIBUTION LIST). Let T be a set of entries in the IUR-tree that do not have ancestor-descendant relationships. Given an entry E∈T , an upper bound contribution list of E, denoted as E.U CL, is a sequence of t (1≤t≤k) triples sorted in descending order of si , where E ′ ∈T , si is M axST (E, E ′ ) and { ′ |E | if E ′ ̸=E numi = |E ′ | − 1 otherwise. t ∑ such that t is the minimal number fulfilling numi ≥ k. i=1
Example 6.9. Given k=3, three entries E, E1′ , E2′ in IUR-tree. Suppose the objects number in E, denoted as |E|, is 3, and |E1′ |=2, |E2′ |=3. Furthermore, M axST (E, E) = 1, num = 2; M inST (E, E1′ ) = 0.66, num = 2; M inST (E, E2′ ) = 0.88, num = 3 Then we sort the similarity approximations above in descending order obtaining . ∑2 Since i=1 numi = 2 + 2 ≥ ⟩ k = 3, thus we get the upper bound contribution list of E is ⟨ < 1, E, 2 >, < 0.88, E2′ , 3 > . Following the notations in Definition 6.8, we have the following lemma. L EMMA 5. If the t-th element (i.e., E.UCL.st ) is smaller than the minimal similarity between E and q (denoted by M inST (E, q)), then q must be one of the top-k most similar objects for all objects in E, and objects in E are included as results. P ROOF. The definition 6.6 for the upper bound contribution list of entry E is composed of M axST (E, E ′ ). If E ′ ̸= E, then for all the objects o∈E, there are |E ′ | objects o′ ∈E ′ (o′ ̸= o) such that SimST (o, o′ )≤M axST (E, E ′ ), i.e., there is at most one object o′ ∈E ′ (o′ ̸= o) such that SimST (o, o′ )≥M axST (E, E ′ ). While if E ′ = E, then for all the objects o∈E, there are |E ′ | − 1 objects o′′ ∈E ′ such that SimST (o, o′′ )≤M axST (E, E ′ ). Thus E.U CL.st obtained from Definition 6.8 satisfies that for all the objects o∈E, there are at most k objects o′ (o′ ̸=o) such that SimST (o, o′ ) ≥ E.U CL.st . If the condition in Lemma 5 holds, i.e., E.U CL.st ≤ M inST (E, q), then for all the objects o∈E, there are at most k distinct objects o′ (o′ ̸=o) such that SimST (o, o′ ) ≤ SimST (o, q). Thus all objects in E will be reported as part of the answer. Note that the upper bound kNN U(E) is exactly E.UCL.st . That is, as shown in Lemma 5, we can report E to be a result entry if kNNU(E) < M inST (E, q). Intuitively, this is because kNN U(E) is the smallest similarity for objects to be one of kNNs of E. Since MinST(E, q) is greater than kNN U(E), q is the kNN object of E. In other words, all objects in E are RSKkNN of q. Figure 7 illustrates the strategies of using kNN L(E) and kNN U(E) to determine whether the entry E is a result. The similarity approximations in E.LCL (resp. E.UCL) are within the shaded ring “L” (resp. “U ”). Specially, the dashed line in “L” (resp. “U ”) is kNN L(E) (resp. kNN U(E)). Note that the circle that is farther away from E indicates the similarity between object on the circle and entry E is smaller. If q3 is the query object, we can prune E since the similarity M axST (E, q) between E and q3 is within the dashed ring kNN L(E) (i.e., equal to or larger than kNN L(E)). If q1 is the query, we report E as a result entry since the similarity M inST (E, q) between E and q1 ACM Transactions on Database Systems, Vol. V, No. N, Article 1, Publication date: January YYYY.
1:18
Y. Lu et al.
kNNL(E) kNNU(E)
u L
E
q1 q2 q3
query objects Fig. 7. Illustration of pruning and reporting results using kNNL(E) and kNNU(E)
is within the ring kNN U(E). If the query is q2, we cannot determine whether E belongs to results based on kNN L(E) and kNN U(E). Extension to Cosine Similarities. Recall that besides the extended Jaccard, the textual similarity can also be measured by other models such as the cosine similarity (see Equation 5). In order to adapt our algorithm for the cosine similarity, we only need to change the textual similarity approximations of M inT in Eqn(11) and M axT in Eqn. (18). In particular, the minimal cosine textual similarity M inTcos (E, E ′ ) between two entries E and E ′ is given in Eqn(19) and the maximal cosine textual similarity M axTcos (E, E ′ ) is defined to be 1. It is not hard to prove ∀o′ ∈ E ′ , ∀o ∈ E, Cosine(o, o′ ) ≥ M inTcos (E, E ′ ), and ∀o′ ∈ E ′ , ∀o ∈ E, Cosine(o, o′ ) ≤ M axTcos (E, E ′ ). Hence Lemmas 1 and 3 still hold under the cosine similarity. ∑n
′
E.ij × E ′ .ij √∑ n 2 2 ′ j=1 E.uj ∗ j=1 E .uj
M inTcos (E, E ) = √∑ n
j=1
(19)
6.2. Search Algorithm
We proceed to develop an efficient algorithm to answer RSKkNN queries (see Algorithm 3 and 4). At high-level, the algorithm descends the IUR-tree in the branch and bound manner, progressively computing the thresholds kNN L(E) and kNN U(E) for each entry E by inheriting and updating the lower and upper contribution lists. Based on the thresholds, the algorithm then decides whether to prune an entry E, to report all objects in E as results, or to consider child entries of E as candidates. The algorithm uses the following data structures: a max-priority queue U , which stores nodes E associated with the priority M axST (E, q), a candidate object list COL that needs to be checked, a pruned entry list PEL, and a result object list ROL. The algorithm begins with initialization and then enqueues the root of the IUR-tree into U (Line 1–2 in Algorithm 3). When U is not empty (Line 3 in Algorithm 3), we dequeue the entry P from U with the highest priority (Line 4 in Algorithm 3). For each child entry E of P , E first inherits the upper/lower bound lists of P (which is discussed in more details later)(Line 6 in Algorithm 3), based on which, we determine whether E is a result entry (“hit”) or can be pruned (“drop”) by invoking procedure IsHitOrDrop (Line 7 in Algorithm 3). If E can be pruned, E is added to PEL (Line 10-11 in Algorithm 4), and if E is reported as a result entry , E is added to ROL (Line 14-15 in Algorithm 4); Otherwise, we use E to “mutually effect” E ′ ∈ COL∪ROL∪U to update the upper/lower bound contribution lists to mutually tighten their upper/lower bounds (Line 9 in Algorithm 3). Note that entries E ′ are selected in decreasing order of M axST (E, E ′ ) since entries E ′ with higher M axST (E, E ′ ) are more likely to be within the kNN of E (Line 8 in Algorithm 3). If E ′ is pruned or reported as a result entry then remove E ′ from its original data structure U or COL (Line 13–14 in Algorithm 3). If E is determined as a hit or drop, then consider next child entry of P (Line 10 in Algorithm 3). If E still cannot be determined whether to be a result entry after effected ACM Transactions on Database Systems, Vol. V, No. N, Article 1, Publication date: January YYYY.
Efficient Algorithms and Cost Models for Reverse Spatial-Keyword k-Nearest Neighbor Search 1:19 ALGORITHM 3: RSKkNN (R: IUR-tree root, q: query) Output: All objects o, s.t. o∈RSKkN N (q, k, R). 1: Initialize a priority queue U , and lists COL, ROL, PEL; 2: EnQueue(U , R); 3: while U is not empty do 4: P ← DeQueue(U );//Priority of U is M axST (P, q) 5: for each child entry E of P do 6: Inherit(E.CLs, P.CLs); 7: if (IsHitOrDrop(E, q)=false) then 8: for each entry E ′ in COL, ROL, U in decreasing order of M axST (E, E ′ ) do 9: UpdateCL(E,E ′ );//update contribution lists of E. 10: if (IsHitOrDrop(E, q)=true) then break; 11: if E ′ ∈ U ∪COL then 12: UpdateCL(E ′ ,E);//update contribution lists of E ′ using E. 13: if (IsHitOrDrop(E ′ , q)=true) then 14: Remove E ′ from U or COL; 15: if (E is not a hit or drop) then 16: if E is an index node then 17: EnQueue(U , E); 18: else COL.append(E); //a database object 19: FinalVerification(COL, PEL, ROL);
by all the entries in COL, ROL and U , then add E to the corresponding list or queue (Line 15–18 in Algorithm 3). Finally, when the priority queue U is empty, we still need to process objects in the candidate list COL to decide if they are part of answers by invoking Procedure FinalVerification (Line 19 in Algorithm 3). Note that here we adopt a tricky idea called “lazy travel-down” for each entry E ′ in the pruned list PEL to save I/O cost. That is, in Line 8 of Algorithm 3, we do not access the subtree of ∀E ′ ∈PEL to affect entry E that is processed currently until we reach the final verification phase. In this way, as shown in the experimental section, “lazy travel-down” accelerates the query processing by avoiding the scan of many portions of the IUR-tree. Procedure FinalVerification in Algorithm 4: it is to determine if the candidate objects in COL are “hits” or “drops”. The main idea is to check the effect of the entries in PEL on each candidate in COL. Specifically, we update the contribution lists for candidates in COL until we can correctly determine if each candidate object belongs to an answer or not. In particular, Line 2 selects the entry E in PEL which has the lowest level in the IUR-tree. This is because the entries in the lower level often have the tighter bounds than those in the higher level and thus they are more likely to identify whether the candidates are results. Line 4 uses the entry E to update the contribution list of each candidate o in COL and Line 5 checks if o can be removed from the candidate list. Finally, we add children of E into PEL since they may also affect the candidates in COL (Line 8–9). This process continues until COL becomes empty. In particular, Line 6 in Algorithm 3 introduces an efficient technology called Inherit, i.e., a child entry inherits (copies) the contribution lists from its parent entry. Inherit makes use of the parent nodes to avoid computing contribution lists from the scratch, and thus reducing runtime (to be shown in our experimental results). However, inherit will lead to a problem called object conflict: the same object in the contribution lists of a child entry may be counted twice (one from the inheritance of parent entry and the other one from itself after other entries’ affecting), resulting in wrong upper or lower bounds of the child entry. In order to avoid such a problem, Line 18–20 in Algorithm 4 guarantee that there is no object in contribution lists which is double counted, as illustrated in the following example.
ACM Transactions on Database Systems, Vol. V, No. N, Article 1, Publication date: January YYYY.
1:20
Y. Lu et al.
ALGORITHM 4: Procedures in RSKkNN Procedure FinalVerification(COL, PEL, q) 1: while (COL̸=∅) do 2: Let E be an entry in PEL with the lowest level; 3: PEL=PEL-{E}; 4: for each object o in COL in decreasing order of M axST (E, o) do 5: UpdateCL(o,E);//update contribution lists of o. 6: if (IsHitOrDrop(o, q)=true) then 7: COL=COL-{o}; 8: for each child entry E ′ of E do 9: PEL=PEL∪{E ′ }; //access the children of E ′ Procedure IsHitOrDrop(E: entry, q: query) 10: if kNN L (E)≥M axST (E, q) then 11: PEL.append(E); //Lemma 4 12: return true; 13: else 14: if kNN U (E) kNNU (P ) inherited from parent P , then M inST (C, q) > kNNU (C), and thus we can add child entry C as a result safely. Therefore, Claim 3 holds. C LAIM 4. “Lazy travel down” technology used in Algorithm 3 is correct. P ROOF: We need to prove that entries can be safely pruned or be reported to be results without accessing the subtrees of the pruned entries due to “lazy travel down”. That is, in Line 8 of Algorithm 3, we do not need to access the pruned entries to affect entries being processed currently. Obviously it does not influence an entry that is not part of results, since we can prune an entry E as long as we find at least k objects that are more similar than the query object. Meanwhile, entries E can be safely reported as results if it satisfies the condition of M inST (E, q)>kNNU (E) even without accessing the subtrees of the pruned entries by “lazy traveled down”, as according to the algorithm, all the pruned entries must be already used to compute the upper bound kNNU (E) of the entry E or the upper bound kNNU (A) of E’s ancestor entry A. In particular, if the pruned entries are already used to compute the bounds of entry E, then it holds trivially. If the pruned entries are used to compute the bounds of the entry A, it is also correct due to the “inherit” technology. That is, the inherited value kNNU (A) is larger than or equal to kNNU (E). Thus if M inST (E, q) > kNNU (A), then M inST (E, q) > kNNU (E), and then entry E can be safely reported as results. Therefore, Claim 4 holds. Completeness: All objects which can not be safely pruned or reported as results, are appended to the candidate object list COL (Line 19 in Algorithm 3). In the F inalV erif ication procedure, all the candidate objects can be determined whether they are results through traveling down the pruned entries. It is because that even in the worst case, we can access all the objects in the subtree of the pruned entries to determine each candidate object if it is an answer in IsHitOrDrop (Line 6 in Algorithm 4) while M inST and M axST between two database objects are equal. Thus our algorithm is complete, i.e., it can return all the RSKkNN data points. Hence, Theorem 1 is true.
6.3. Performance Analysis
In this subsection, we propose an analytical model to estimate the cost of the RSKkNN queries and theoretically analyze the performance of the RSKkNN algorithm based on the IUR-tree. The number of accessed nodes in the IUR-tree is computed in Theorem 2. Theorem 2. Assume that the locations of N objects are uniformly distributed in 2-dimension space, and the word frequencies in each object follow the Zipf distribution. With high probability, the number of IUR-tree index nodes accessed using the RSKkNN algorithm is O(f logf N ), where f is the fanout of the IUR-tree. To show the superiority of the RSKkNN search algorithm, recall the baseline method that is discussed in Section 4, which computes the top-k spatial-textual nearest neighbor objects using ACM Transactions on Database Systems, Vol. V, No. N, Article 1, Publication date: January YYYY.
Efficient Algorithms and Cost Models for Reverse Spatial-Keyword k-Nearest Neighbor Search 1:23
the √ threshold algorithm [Fagin et al. 2003]. The computational cost of the threshold algorithm is kN [Fagin et al. 2003]. Given that one needs to check whether query object q is one of the top-k√nearest neighbors for each object, the overall computational cost of the baseline method is O(N kN ), which is much higher than that of the RSKkNN algorithm. We proceed to introduce the analytical model and prove Theorem 2 in details in this section. 6.3.1. Analysis Model Settings. Following the assumption in [Theodoridis and Sellis 1996], we assume the locations of N objects are uniformly distributed in 2-dimension space. The word frequencies of objects follow the Zipf distribution. Specifically, we assume that there is a word pool with M distinct words whose frequencies are assumed to follow the Zipf distribution, i.e., the fres quency of the k-th most popular word is ∑M1/k(1/is ) , where k ∈ [1, M ], and s is a parameter chari=1 acterizing the distribution. Then we randomly select m words from the word pool for each object. Our goal is to estimate the expected number DA of the IUR-tree by Algorithms 3 and 4. To facilitate the analysis, suppose that N objects are indexed in an IUR-tree with the height h (the root is assumed to be at level h and leaf-nodes are assumed to be at level 1), and let NNl denote the number of index nodes at level l, and let Pl and Al be the number of index nodes that can be pruned and can be reported as results at level l, respectively. Let f denote the fanout of the IUR-tree. Thus, Rl , which is the number of entries that should be processed at level l is at least:
Rl = NNl − f (Pl+1 + Al+1 )
(20)
Let Xl denote the number of additional entries that are accessed to compute the lower and upper kNN bounds of entries at level l. Therefore, at level l in the IUR-tree, the number of accessed index nodes is: DAl = Rl + Xl
(21)
Thus the total number of node accesses in the IUR-tree can be derived as: h−1 ∑ DA = 1 + (NNl − f (Pl+1 + Al+1 ) + Xl )
(22)
l=1
The height h of an R-tree with the fanout f that stores N data entries is given by Eqn(23) in [Faloutsos et al. 1987]. The number of index nodes at level l is given in Eqn(24). Note that the number of objects in each node at level l is f l . h = 1 + ⌈logf
N ⌉ f
(23)
N (24) fl In the following, we first estimate Pl in Section 6.3.2 (resp. Al in Section 6.3.3), the number of index nodes pruned (resp. reported as results) at level l in the IUR-tree by considering only the spatial information, denoted by PSl and ASl , respectively, and then show how to take into account the textual information in Section 6.3.4. NNl =
6.3.2. Estimation of the number of pruned entries at level l without texts. Figure 9 illustrates the layout of entries and the query q at level l. Let sl denote the side extent of the MBR of an entry at level l and let tl be the distance between the centers of two consecutive MBRs at level l. As mentioned above, f denotes the fanout of the IUR-tree. Subsequently, Equation (25), which describes the relationships among sl+1 , tl and f , are given in [Theodoridis and Sellis 1996]. We then derive the value of sl in Eqn(26). 1
sl+1 = (f 2 − 1)tl + sl and tl = (
fl 1 )2 N
ACM Transactions on Database Systems, Vol. V, No. N, Article 1, Publication date: January YYYY.
(25)
1:24
Y. Lu et al. sl E3,4
E3,3
E3,2
E3,1
E3,2
E3,3
E3,4
E3,3
E2,3
E2,2
E2,1
E2,2
E2,3
E3,3
s l N3,4
N3,3
N3,2
N3,1
N3,2
N3,3
N3,4
N3,3
N2,3
N2,2
N2,1
N2,2
N2,3
N3,3
tl
tl
E3,2
E2,2
E1,2
E1,1
E1,2
E2,2
E3,2
N3,2
N2,2
N1,2
N1,1
N1,2
N2,2
N3,2
E3,1
E2,1
E1,1
q
E1,1
E2,1
E3,1
N3,1
N2,1
N1,1
Eij
N1,1
N2,1
N3,1
E3,2
E2,2
E1,2
E1,1
E1,2
E2,2
E3,2
N3,2
N2,2
N1,2
N1,1
N1,2
N2,2
N3,2
E3,3
E2,3
E2,2
E2,1
E2,2
E2,3
E3,3
N3,3
N2,3
N2,2
N2,1
N2,2
N2,3
N3,3
E3,4
E3,3
E3,2
E3,1
E3,2
E3,3
E3,4
N3,4 N3,3
N3,2
N3,1
N3,2
N3,3
N3,4
(a) Layout of entries Ei,j and query object q, where Ei,j denotes the entries that are at the i-th layer around q and the j-th minimal distance to entry q. Note that Ei,j may refer to multiple entries. For example there are 4 entries denoted by E2,1 , and 8 entries denoted by E2,2 .
(b) Layout of entries Ei,j (in Figure 9(a)) and Ni,j , where Ni,j is an entry that is at the i-th layer around Ei,j and the j-th minimal distance to entry Ei,j . Note that Ni,j refers multiple entries, all of which has the same distance from Ei,j .
Fig. 9. Layout of query q and entries at level l
1 1 (26) )2 N As shown in Figure 9(a), intuitively, entries that are far away from the query object q are more likely to be pruned. The number of pruned entries, PSl , is formally computed in Lemma 6 as follows. sl = tl − (
L EMMA 6. The number PSl of pruned entries at level l in the IUR-tree (by taking] into account [ √ √ √ only spatial information) is : PSl = fNl − (8 2 − 4)r2 + 20 2 ∗ r + 8 2 + 1 , where r = ⌈ ⌉ √ 4k+4 0.25 + 13 − 0.5 . fl P ROOF. Recall that in our algorithm, we can safely prune an entry Ei,j in Figure 9(a) if ∀o ∈ Ei,j , there are at least k objects o′ such that M inS(Ei,j , q) > dist(o, o′ ), where M inS(Ei,j , q) is the minimal spatial distance between entry Ei,j and q. Thus, we need first to estimate a distance, denoted by M axkN N , such that there are at least k objects whose distance to Ei,j is no greater than M axkN N . As shown in Figure 9(b), which gives the layout of the entry Ei,j and the surrounded entries Ni,j , we need to identify the layer r such that there are at least k − (f l − 1) objects in entries Ni,j , i≤r, j≤r, around Ei,j . Subtracting f l − 1 is because that for any object o in Ei,j , there are already |Ei,j | − 1 other objects within Ei,j . We show a table in Figure 10(a), where each cell at row i and column j contains a binary-tuple , where Ai,j is the maximal spatial distance M axS(Ei,j , Ni,j ) between entry Ei,j and Ni,j √; and Bi,j is the number of objects in Ni,j . For example, for the cell < A1,1 , B1,1 >, A1,1 = s2l + (sl + tl )2 is the maximal distance between entries N1,1 and Ei,j , and B1,1 = 4f l is the total number of objects in the 4 entries N1,1 . Note that the number of objects in each entry at level l is f l . Given any three distance values Ai,j , Ai,j+1 and Ai+1,j in three adjacent cells of Figure 10(a), it is easy to prove that Ai,j < Ai,j+1 and Ai,j < Ai+1,j hold. Thus, as shown in Eqn(27), we can get the value of r in Ar,r+1 (i.e., Nr,r+1 ) such that there are at least k − (f l − 1) objects in entries Ni,j , i≤r, j≤r, around Ei,j : ACM Transactions on Database Systems, Vol. V, No. N, Article 1, Publication date: January YYYY.
Efficient Algorithms and Cost Models for Reverse Spatial-Keyword k-Nearest Neighbor Search 1:25
1
2
3
4
< (sl + tl )2 + (sl + tl )2 ,4 f l >
2 1 < sl + (sl + tl ) 2 ,4 f l >
2
< sl + (sl + 2tl )2 ,4 f l >
3
2 2 2 l < sl + (sl + 3tl )2 ,4 f l > < (sl + tl ) + (sl + 3tl ) ,8 f >
2
< (sl + tl )2 + (sl + 2tl )2 ,8 f l >
< (sl + 2tl )2 + (sl + 2tl )2 ,4 f l > < (sl + 2tl )2 + (sl + 3tl )2 ,8 f l > < (sl +3tl )2 + (sl +3tl )2 ,4 f l >
(a) Summary for the maximal distances between the entry Ei,j and entries Ni,j around Ei,j in Figure 9(b) and the numbers of objects in Ni,j . Assume that the entry Ni,j at row i and column j in the table is , where Ai,j is the maximal spatial distance M axS(Ei,j , Ni,j ); and Bi,j is the number of objects in entry Ni,j .
1 1 2 3
2
3
4
1 < (t l - s l ) 2 , 4 > 2
1 1 < (tl - sl )2 + (tl - sl )2 ,4 > 2 2 1 2 1 2 1 2 1 2 1 2 < (2tl - sl ) ,4 > < (tl - sl ) + (2tl - sl ) ,8 > < (2tl - sl ) + (2tl - sl ) ,4 > 2 2 2 2 2
< (3t l -
1 2 sl ) , 4 > 2
1 1 < (tl - sl )2 + (3tl - sl )2 ,8 > 2 2
1 2 1 2 1 1 < (2tl - sl ) 2 + (3tl - sl ) 2 ,8 > < (3tl - sl ) + (3tl - sl ) ,4 > 2 2 2 2
(b) Summary for the minimal distance between entries Ei,j and query q in Figure.9(a) and the number of entries ′ > denote the entry E ′ Ei,j . Let , A′2,2 = (tl − 12 sl )2 + (2tl − 21 sl )2 is the minimal dis′ tance between entries E2,2 and q, and B2,2 = 8 is the number entries denoted by E2,2 , i.e., entries ′ whose minimal distance to q is A2,2 . Given any three distance values A′i,j , A′i,j+1 and A′i+1,j in three adjacent cells in Figure 10(b), it is easy to verify that A′i,j+1 > A′i,j , A′i+1,j > A′i,j and A′⌈√2∗i⌉,1 > A′i,i+1 hold. Further, we can explore the relationship of distance values in Figures 10(a) and (b) as follows. Let Ai,j denote the distance value at row i column j in Figure 10(a), and ACM Transactions on Database Systems, Vol. V, No. N, Article 1, Publication date: January YYYY.
1:26
Y. Lu et al.
let A′i,j denote the distance value in Figure 10(b). We can see A′i+2,j+2 > Ai,j . Therefore, given the distance √ Ar,r+1 in Figure 10(a), then the values Ai,j in Figure 10(b), where (i≥r+2 and j≥r+2) or (i≥⌈ 2(r + 2)⌉ and j < (2tl - sl )2 +(2tl - sl )2 ,4 f l >
3
< (3tl - sl ) 2 ,4 f l >
2 2 l < (tl - sl )2 +(3tl - sl )2 ,8 f l > < (2tl - sl )2 +(3tl - sl )2 ,8 f l > < (3tl - sl ) + (3tl - sl ) ,4 f >
(a) Summary for the minimal distances between the entry Ei,j and entries Ni,j around Ei,j in Figure 9(b) and the number of objects in Ni,j . Assume that the entry Ni,j at row i and column j in the table is , where Ai,j is the minimal spatial distance M inS(Ei,j , Ni,j ); and Bi,j is the number of objects in entry Ni,j .
1
2
3
4
1
1 2 1 2 1 2 1 2 < ( s) l + (tl + sl ) ,4 > < (tl + sl)+ (tl + sl ) ,4 > 2 2 2 2
2
1 1 1 2 1 2 1 1 < (tl + sl)2 + (2tl + sl )2 ,8 > < (2tl + sl)2 + (2tl + sl )2 ,4 > < ( s) l + (2tl + sl ) ,4 > 2 2 2 2 2 2 1 2 1 2 1 1 1 1 1 1 2 2 2 < ( s) < (2tl + sl) + (3tl + sl )2 ,8 > < (3tl + sl)2 + (3tl + sl )2 ,4 > l + (3tl + sl ) ,4 > < (tl + sl)+ (3tl + sl ) ,8 > 2 2 2 2 2 2 2 2
3
(b) Summary for the maximal distances between entries Ei,j and query object q and the number of entries ′ > denote the entry E ′ Ei,j in Figure 9(a). Let A′i,j and A′i+1,j > A′i,j . Furthermore, we can explore the relationship of distance values in Figures 11(a) and (b) as follows: Let Ai,j denote the distance value at row i column j in Figure 11(a), and let A′i,j denote the distance value in Figure 11(b), we have A′i−2,j−2 < Ai,j . Based the observations above, we can derive the following: Given the distance Ap,p+1 (whose value is M inkN N ) in Figure 11(a), then the values Ai,j in Figure 11(b) satisfying (i≤p-2 and j≤p-2) are smaller than A′p,p+1 . Therefore, any entry Ei,j in Figure 11(b) can be reported as a result entry if (i≤p-2 and j≤p-2). Thus we can derive the number of index nodes ASl that can be reported as results: ASl = 1 +
p−3 ∑
(2 ∗ 4 + 8(i − 1)) + 4 + 8(p − 2 − 1) = 4p2 − 12p + 5
i=1
Together with Eqn(29) and Eqn(30), Lemma 7 holds.
ACM Transactions on Database Systems, Vol. V, No. N, Article 1, Publication date: January YYYY.
(30)
1:28
Y. Lu et al.
6.3.4. Estimation for the number of accessed nodes with texts. We now describe how to take into account the textual information. The main idea is to investigate how the textual information can influence the number of pruned and reported index nodes.
L EMMA 8. Considering both spatial and textual information, the number Pl of pruned en1−α
∗ ψs −φs ∗[M axT (E,q)−M inT (E,E ′ )]
tries at level l in the IUR-tree satisfies: Pl ≥ PSl − 8 α ψt −φt , where tl M axT (E, q) is the maximum textual relevance between an entry E at level l and query object q, M inT (E, E ′ ) is the minimum textual relevance between two entries E and E ′ at level l in the IUR-tree, and tl is given in Eqn(25). P ROOF. Recall Line 10 in Algorithm 4. We can prune an entry E if and only if: kNNL(E) ≥ M axST (E, q) M axS(E, E ′ ) − φs M inT (E, E ′ ) − φt ⇒ α(1 − ) + (1 − α) ψs − φs ψt − φt M inS(E, q) − φs M axT (E, q) − φt ≥ α(1 − ) + (1 − α) ψs − φs ψt − φt 1 − α ψ − φs s ∗ ∗ [M axT (E, q) − M inT (E, E ′ )] ⇒ M inS(E, q) ≥ M axS(E, E ′ ) + α ψt − φt
The above formula shows that the number of pruned nodes should be reduced due to the textual values. In particular, consider Figure 10(b) again, since we can prove that the gap between two adjacent cells with respect to the values Ai,j is no less than tl , and there are at most 8 entries in any ′ ≤ 8 ), we can derive the number of pruned entries has been changed cell of Figure 10(b) (i.e., ∀Bi,j as shown in Lemma 8. Hence Lemma holds. L EMMA 9. Considering both spatial and textual information, at level l in the IURtree, the number Al of entries that are reported as results satisfies that: Al ≥ ASl + 1−α
∗ ψs −φs ∗[M inT (E,q)−M axT (E,E ′ )]
4 α ψt −φt , where M inT (E, q) is the minimum textual relevance betl tween an entry E at level l and query object q, M axT (E, E ′ ) is the maximum textual relevance between two entries E and E ′ at level l in the IUR-tree, and tl is given in Eqn(25). P ROOF. Recall Line 14 in Algorithm 4. We report entry E as a result entry if and only if: kNNU(E) < M inST (E, q) M inS(E, E ′ ) − φs M axT (E, E ′ ) − φt ⇒ α(1 − ) + (1 − α) ψs − φs ψt − φt M axS(E, q) − φs M inT (E, q) − φt < α(1 − ) + (1 − α) ψs − φs ψt − φt ψ − φs 1 − α s ∗ ∗ [M inT (E, q) − M axT (E, E ′ )] ⇒ M axS(E, q) < M inS(E, E ′ ) + α ψt − φt ′ Further, there are at least 4 entries in any cell of Figure 11(b) (i.e., ∀Bi,j ≥ 4 ), and thus Al can be derived as that in Lemma 9.
L EMMA 10. Considering spatial and textual information, under a high probability lager than 1 − √21s −1 , the number Rl of the entries that need to be processed at level l in the IUR-tree is: √
1.28(k + 1) + 5.243f Rl ≤ fl
+8f
1−α α
∗
ψs −φs ψt −φt
∗
√
4(k + 1) + 13 + 8.904f f l+1
(2ζ(s)2mf
i+1
ζ(s)2mf
0.137(k + 1) + 1.617 − 1.48f f l+1
2 −2)(2s −1)+ m
i+1 √ s 2 −1
ti+1 ACM Transactions on Database Systems, Vol. V, No. N, Article 1, Publication date: January YYYY.
Efficient Algorithms and Cost Models for Reverse Spatial-Keyword k-Nearest Neighbor Search 1:29 where ζ(s) = lim
M →∞
∑M
s i=1 (1/i ),
which is known as Riemann’s zeta function [Titchmarsh 2005], s is the
parameter in Zipf distribution assumption.
P ROOF. According to Lemmas 6, 7, 8, and 9, and Eqn(20), the number Rl of the entries which needs to be processed at level l is: Rl = NNl − f (Pl+1 + Al+1 ) √ √ 1.28(k + 1) 4(k + 1) 0.137(k + 1) = + 8.904f + 5.243f + 1.617 − 1.48f l l+1 f f + 13 f l+1 ( ) ψs −φs 1−α ′ ′ α ∗ ψt −φt ∗ M axT (E, q) − M inT (E, E ) + M axT (E, E ) − M inT (E, q) +8f tl+1 √ √ 1.28(k + 1) 4(k + 1) 0.137(k + 1) ≤ + 5.243f + 8.904f + 1.617 − 1.48f fl f l+1 + 13 f l+1 ( ) ψs −φs 1−α ′ α ∗ ψt −φt ∗ 2 − M inT (E, E ) − M inT (E, q) +8f (31) tl+1 In the following, we proceed to estimate the values of M inT (E, E ′ ) and M inT (E, q) to compute Rl . Recall the assumption about textual distribution that each object contains m words randomly selected from a word pool with M distinct words following Zipf distribution: the frequency of s the k-th most popular word wk is Pk = ∑M1/k(1/is ) . In our algorithm, we estimate M inT (E, E ′ ) i=1
(resp. M inT (E, q)) by Equation (11). For simplicity, assume that all weights are binary, i.e., 0 or 1. Therefore, the key idea in Equation (11) is to estimate the total number of intersection words for each object between two entries E and E ′ (resp. objects in entry E and query object q). Let Xn be the random variable representing the number of intersection words of all the n objects. Then the probability that there are x common words appearing in the n objects is no less than that of one special case, where the word w1 (which is the most popular word in Zipf distribution) is the only common words for all n objects, and the word w1 appears x times in all the n objects, and the rest m − x words for n − 1 objects are also word w1 , but the remaining m − x words for the last object are all w2 . Therefore, (n−1)(m−x)
P r(Xn = x) ≥ (P1x )n ∗ P1
2sx ∗ P2m−x = ∑M ( i=1 (1/is ))nm ∗ 2sm
Then the expectation E(Xn ) of random variable Xn is: E(Xn ) =
m ∑
m2s − m − 1 m2s − m − 1 x ∗ P r(Xn = x) ≥ ∑M ≥ ζ(s)nm ∗ (2s − 1) ( i=1 (1/is ))nm (2s − 1) x=1
(32)
When n = 2f l , the expectation of the number of intersection words for 2f l objects in entries E l s and E ′ is 2f2f l m ∗ m22s−m−1 , and we can get the expectation E(M inT (E, E ′ )): −1 ζ(s)
E(M inT (E, E ′ )) ≤
1 2s − 1 − m 1 m2s − m − 1 ∗ = . ζ(s)nm ∗ (2s − 1) m ζ(s)2f l m (2s − 1)
ACM Transactions on Database Systems, Vol. V, No. N, Article 1, Publication date: January YYYY.
(33)
1:30
Y. Lu et al.
Similarly, we can derive the expectation of M inT (E, q): E(M inT (E, q)) ≤
1 2s − 1 − m . ζ(s)(f l +1)m (2s − 1)
According to the Markov’s inequality [DeGroot and Schervish 2004], we have: ( l (2ζ(s)2f m − 2)(2s − 1) + √ P r (2 − M inT (E, E ′ ) − M inT (E, q)) ≥ ζ(s)2f l m 2s − 1 2 − E(M inT (E, E ′ ) − E(M inT (E, q)) 1 ≤ =√ s 2 (2ζ(s)2f l m −2)(2s −1)+ m 2 −1 √ ζ(s)
2f l m
(34)
2 m
)
(35)
2s −1
Hence, together with Eqn(31) and Eqn(35) the number Rl of the entries which need to be processed at level l can be derived as in Lemma 10, as desired. In the following, we estimate the additional number of disk accesses Xl . In order to compute the lower and upper kNN bounds of the rest Rl entries at level l, we may need to visit additional entries at level l that are already pruned or reported as results at the upper levels, besides the Rl entries that are visited. According to the RSKkNN search algorithm, given k, to compute the lower (or upper) bound of entry E at layer l, we visit its top-k most similar objects, which are within the l ⌈ k−(ff l −1) + 1⌉ entries around entry E as shown in Figure 10. Thus the additional number of disk accesses Xl = ⌈( k−(ff l −1) + 1)⌉Rl ≤ ( fkl + 1)Rl . Thus, with a probability larger than 1- √21s −1 , the total expected number of disk accesses DAl at l
level l is Xl + Rl = ( fkl + 2)Rl . Therefore, the number (DA) of index nodes accessed in the IUR-tree using the RSKkNN algorithm is:
DA = 1 +
h−1 ∑ l=1
(
k + 2)Rl fl √
f f 1 − Nf √fN √ 1− N 1− N 2 + 28.746f k ≤ 1 + 1.28k(k + 1) 2 + 13.782k f (k + 1) √ f −1 f −1 f f −1 √ f f 1− N √ 1− N + 57.492f logf N +2.56(k + 1) + 27.564 f (k + 1) √ f −1 f −1 √ 2 f 2 N (1 − N ) 1 − α ψs − φs (2ζ(s)2mf − 2)(2s − 1) + m √ √ +8f ∗ ∗ ∗ 2 2mf s α ψt − φt f −1 ζ(s) 2 −1 2
In particular, if s → ∞, then probability 1 −
√ 1 2s −1
→ 1, and ζ(s) → 1 [Titchmarsh 2005]. In
addition, if f ≪N , together with s → ∞, then, with a high probability, DA ≤ 1 + 1.28k k+1 f2 + √ √ √ 2 (k+1) k k k 13.782k f + 28.746k + 2.56 k+1 f + 27.564 k + 1 + 57.492f logf N = O( f 2 + f + k + f logf N ). Further, assuming constant and small values for f and k, the number (DA) of index nodes accessed in the IUR-tree using the RSKkNN algorithm is O(f logf N ), which finally concludes the proof of Theorem 2. Extension to Cosine Similarities. Using the cosine distance defined in Eqn (5) as the textual similarity measurement, we only need to replace the estimations of M inT (E, E ′ ) and M inT (E, q) ACM Transactions on Database Systems, Vol. V, No. N, Article 1, Publication date: January YYYY.
Efficient Algorithms and Cost Models for Reverse Spatial-Keyword k-Nearest Neighbor Search 1:31
with the estimations of M inTcos (E, E ′ ) and M inTcos (E, q), respectively, in the Eqn(31) in Section 6.3.4. Under the same assumption of the textual distribution given in Section 6.3.1, the expectation of M inTcos (E, E ′ ) (resp. M inTcos (E, q)) defined in Eqn(19) is the same as the expectation of M inT (E, E ′ ) (resp. M inT (E, q)) given in Eqn(33) (resp. Eqn(34)). Hence Theorem 2 still holds using cosine as the textual similarity measurement. 7. Refinements for Hybrid Index
Like the R-tree, the IUR-tree is built based on the heuristics of minimizing the area of MBR of nodes. However, the associated texts of the spatial objects in the same MBR can be very different, because the near spatial objects often belong to different specific categories, such as retail, accommodations, restaurants, and tourist attractions. To compute tighter kNN bounds of the entries, we enhance the IUR-tree with text cluster, yielding an index tree called CIUR-tree given in Section 7.1. Then in Section 7.2 we propose a Combined CIUR-tree (called C2 IUR-tree), which aims at combining both location and textual information into account during tree construction, by modifying the similarity functions between enclosing rectangles using textual cluster IDs and locations of objects. We also present two optimization methods to improve the search performance based on CIUR-tree and C2 IUR-tree in Section 7.3 and Section 7.4, respectively. 7.1. Cluster IUR-tree: CIUR-tree
We propose to use text clustering to enhance IUR-tree. In the pre-processing stage, we group all the database objects into clusters C1 , · · · Cn according to their text similarities. We extend each IURtree node by the cluster information to generate a hybrid tree called Cluster IUR-tree(CIUR-tree). The CIUR-tree is built based on the spatial proximity as does the IUR-tee. However, each node of the CIUR-tree includes a new entry ClusterList in the form of (ID:N ), where ID is the cluster id and N is the number of objects of cluster ID in the subtree of the node. The ClusterList on the upper layer CP arent is the superimposing of that on lower layer CChild. That is, CP arent.N = ∑M j=1 CChildj .N , where M is the number of children of the node. Similar to the intersection and union textual vectors in IUR-tree, there are intersection and union cluster vectors at each node in CIUR-tree. For each cluster Ci , CIntV cti and CU niV cti include the minimal and maximal weights of each word in Ci , respectively. For example, suppose all the objects in Fig.1 are clustered into three clusters: C1 ={p1 , p4 , p5 }, C2 ={p2 , p3 , p6 } and C3 ={p7 , p8 , p9 }, the intersection and union text vectors of which are shown in Fig 12(a). The CIUR-tree is shown in Fig 12(b). 7.2. Combined CIUR-tree: C2 IUR-tree
The CIUR tree proposed in the previous section is built on the heuristics of placing nodes that are spatially close in the same MBR. However, the RSKkNN query takes into account both location proximity and text relevancy. In this subsection, we propose the Combined CIUR-tree (called C2 IUR-tree), which combines the information about both location and text during tree construction. Specifically, during the construction of the C2 IUR-tree, we compute the similarity between two entries by both their spatial proximity and text similarity, which is computed using the cluster IDs in the two entries. Let E1 ,...,En be a set of entries. The spatial similarity of a pair of entries, < Ep , Eq >, 1 ≤ p, q ≤ n, is defined as follows: ∆Area(Ep , Eq ) = Area(Epq ) − Area(Ep ) − Area(Eq )
(36)
where Area(Epq ) is the area of the minimum bounding rectangle enclosing Ep and Eq ; Area(Ep ) and Area(Eq ) are the areas of the minimum bounding rectangle enclosing Ep and Eq , respectively. A bigger ∆Area(Ep , Eq ) indicates that the two entries are less similar spatially. Similarly, the similarity of textual description is defined as follows: ACM Transactions on Database Systems, Vol. V, No. N, Article 1, Publication date: January YYYY.
1:32
Y. Lu et al. ry ear er era p ione rtsw stat spo pan diap cam lapto
C1 CIntVct1 4 C2 CIntVct2 1 C3 CIntVct3 0
4 1 0
0 4 0
0 4 0
0 0 4
ry ear er era p ione rtsw stat spo pan diap cam lapto
0 CUniVct1 8 0 CUniVct2 1 4 CUniVct3 1
8 1 1
1 8 1
1 8 1
0 4 8
0 4 8
(a) Intersection and union text vectors of each cluster N7 (C2:1, C3:3) IntUniVct5
[0, 0] [11,16] 5
[14,10] [25,22] 4
(C1:3 , C2:2) IntUniVct6
N3 (C2:1 , C3:1) IntUniVct1
[14,10] [19,15] 2
N6 (C1:2) IntUniVct3
[19, 10] [19, 10] ObjVct9 p9
[18,20] [18,20] ObjVct7 p7
[6, 0] [11,5] 2
(C3:2) IntUniVct2
N1
N5 [14, 15] [14, 15] ObjVct3 p3
[18,20] [25,22] 2
[0,11] [4,16] 3
N2 [25,22] [25,22] ObjVct8 p8
(C1:1 , C2:2) IntUniVct4
N4
[11,0] [11,0] ObjVct4 p4
[6, 5] [6, 5] ObjVct5 p5
[3, 12] [3, 12] ObjVct1 p1
[0,11] [4,16] [0,11] [4,16] ObjVct2 ObjVct6 p2 p6
(b) CIUR-tree Fig. 12. The Cluster IUR-tree of Figure 1
∆Entropy(Ep , Eq ) = Entropy(Epq ) − Entropy(Ep ) − Entropy(Eq )
Entropy(E) = −
n ∑ cnumi i=1
|E|
log
cnumi |E|
(37)
(38)
where cnumi is the number of objects of Cluster i in entry E, and |E| is the number of objects in E. Entropy(Epq ) is the entropy of the cluster IDs vector which combines the two entries Ep and Eq . Larger ∆Entropy(Ep , Eq ) implies that the textual descriptions of two entries are less similar. Finally, we define the similarity of two entries as follows: ) ( ∆Area(Ep , Eq ) + (1 − β) ∆Entropy(Ep , Eq ) Sim(Ep , Eq ) = 1 − β max∆Area max∆Entropy
(39)
where max∆Area is the maximum value of ∆Area(Ep , Eq ) for all the pair entries Ep and Eq , 1 ≤ p, q ≤ n, p ̸= q, which is used for normalization in spatial similarity part; max∆Entropy is the maximum value of ∆Entropy(Ep , Eq ) for all the pair entries Ep and Eq , 1 ≤ p, q ≤ n, p ̸= q, to normalize the textual similarity part. Because ∆Area(Ep , Eq ) and ∆Entropy(Ep , Eq ) can be negative, we use the absolute value to ensure Sim(Ep , Eq ) to be positive and monotonic. Parameter β, 0 ≤ β ≤ 1, is to balance the two similarities. In particular, if β = 1, then Sim(Ep , Eq ) is reduced to the spatial similarity; and if β = 0, Sim(Ep , Eq ) measures only the textual similarity. While the framework of the algorithm for building C2 IUR-tree is similar to that of CIUR-tree, the procedures ChooseLeaf and Split are different and are presented as follows. Given a new object, the function ChooseLeaf (see Algorithm 5) selects a leaf entry to place it. ChooseLeaf travels the tree from the root to a leaf. When it visits an internal node in the tree, it will choose the subtree E with the maximum value of Sim(E, object). Equation 39 can be naturally extended to compute the similarity between an entry and an object. Therefore, the new object will be inserted to the branch which is the most similar to it in terms of the combination of spatial and textual similarity. ACM Transactions on Database Systems, Vol. V, No. N, Article 1, Publication date: January YYYY.
Efficient Algorithms and Cost Models for Reverse Spatial-Keyword k-Nearest Neighbor Search 1:33 ALGORITHM 5: ChooseLeaf (object) 1: N ←root; 2: while N is not leaf do 3: Choose the child entry E of N with max value for Sim(E, object) // defined in Equa. 39; 4: N ←E; 5: Return N ;
ALGORITHM 6: Split (N ) 1: Es1 , Es2 = argmin Sim(Ei , Ej ); // Equation 39 Ei ,Ej ∈N
2: for each entry E in node N , where E ̸= Es1 and E ̸= Es2 do 3: if Sim(E, Es1 )≥ Sim(E, Es2 ) then 4: Classify E as group 1; 5: else 6: Classify E as group 2; 7: split N into group 1 and 2
Fig. 13. The example of C2 IUR-tree
The function Split (see Algorithm 6) is used to split a node N . First we pick two entries Es1 and Es2 in N that have the minimum value of similarity defined in Equation 39, i.e., the two entries have the least similarity from each other. Then for each other entry E in N , if E is closer to Es1 in terms of spatial and textual similarity, E is classified to group 1; otherwise it is in group 2. In this way all entries are split to two groups. Take the objects in Fig 12(b) for example, the C2 IUR-tree is shown in Fig 13. In the CIUR-tree, we group P1 ,P2 and P6 into a single node, because they are close to each other according to spatial distance. In contrast, in the C2 IUR-tree, these objects are partitioned into different nodes; and P1 , P4 and P5 are in the same node since they are similar when both textual and spatial information are considered. 7.3. Outlier Detection and Extraction
To develop an optimized algorithm using cluster information in CIUR-tree and C2 IUR-tree, one way is to change the order of processing entries in Algorithm 3 to give a priority to entries which have “outliers”. This way, we are more likely to quickly tighten the estimation of low/upper bounds ACM Transactions on Database Systems, Vol. V, No. N, Article 1, Publication date: January YYYY.
1:34
Y. Lu et al.
of entries. More precisely, we detect the index node E containing outlier clusters in the following two cases: Case I: Most objects in subtree(E) can be pruned, but there exist very few objects in subtree(E) that cannot be pruned, and are called “outliers”, thus making the whole E non-prunable. More precisely, given a query q, we say one entry E belongs to Case I if 1) M inST (E, q) < kNNL (E), 2) M∑ axST (E, q) > kNNL (E), and 3) there exists a subset of clusters in E, denoted by SI , such that Ci ∈SI Ci .N ≥ λ|E|, where parameter λ is a threshold close to 1, and ∀Ci ∈ SI s.t. α(1 − M inS(E,q)−φs ) ψs −φs
+ (1 − α)M axT (Ci , q) < kNNL (E). The objects that are in E but not in SI are
outliers. Case II: Most objects in subtree(E) can be reported as answers, but there exist very few objects that are not answers and thus the whole E cannot be reported as a result entry. More precisely, given a query q, an entry E belongs to case II if 1) M inST (E, q)kNN U (E), and 3) there exist a subset of clusters in E, denoted by SII , such that Ci ∈SII Ci .N ≥
s µ|E|, where parameter µ is a threshold close to 1, and ∀Ci ∈ SII s.t. α(1 − M axS(E,q)−φ ) + (1 − ψs −φs U α)M inT (Ci , q) > kNN (E). Having identified entries in Case I or Case II, we process (decompose) them immediately and identify if their subtree entries can be pruned or added as results (without enqueue like normal entries). To implement this optimization for RSKkNN queries, the only change is to replace Line 17 in Algorithm 3 with the following pseudocodes. First, we determine whether the index node E is in Case I or II: if not, then add E into the priority queue U ; if yes, then we decompose E by checking whether each subtree entry e of E can be pruned or is a result according to the corresponding relationship between the set Ce of clusters in e and cluster set SI , SII .
Replace Line 17 in Algorithm 3 if (E is in Case I or II) then
for each entry e ∈ subtree(E) if Ce ⊂SI then prune e; //Ce is the set of clusters in e else if Ce ⊂SII then report e as a result entry; else if (e is an index node) then EnQueue(U ,e); else COL.append(e); else EnQueue(U , E); 7.4. Text-entropy Based Optimization
We proceed to propose the second optimization to improve performance. In particular, we use T extEntropy to depict the distribution of text clusters in an entry of CIUR-tree or C2 IUR-tree. Intuitively, the more diverse the clusters are, the larger the T extEntropy of the entry is. The following formula calculates T extEntropy for the leaf and inner nodes recursively. ∑n cnum cnumi i if E is a leaf node; − i=1 |E| log |E| H(E) = ∑M |E.childj | H(E.child ) otherwise. j j=1 |E| where cnumi is the number of objects of Cluster i in entry E, and |E| is the number of objects in E. If E is a leaf node, the T extEntropy describes the distribution of textual cluster in E. If E is an intermediate node, T extEntropy of E is a weighted combination of the T extEntropy of its child entries E.childi . We use T extEntropy as the priority (key) for the max-priority queue U . If an entry is more diverse in its text description, it has a higher priority to be visited first. By doing so, we expect that decomposing entries/nodes with diverse textual description in sub-entries would reduce the ACM Transactions on Database Systems, Vol. V, No. N, Article 1, Publication date: January YYYY.
Efficient Algorithms and Cost Models for Reverse Spatial-Keyword k-Nearest Neighbor Search 1:35
diversity of the entries, and thus would be more likely to enable to quickly tighten the estimation of the lower/upper bounds of similarity between each entry and its kth most similar object through “mutually effect” among entries. In addition, since T extEntropy can be computed offline during the indexing construction, we do not need to access the ClusterLists from disk during the query time. Therefore, T extEntropy based method needs less I/O cost compared to the outlier-detection based optimization A salient feature of the two above optimizations in Section 7.3 and Section 7.4 is that they are orthogonal and can be combined, as implemented in our experiments. 8. Experimental Studies
We conducted a thorough experimental study to evaluate the efficiency and scalability of our methods in answering RSKkNN queries. Implemented algorithms We implemented the proposed algorithms based on the IUR-tree as well as the optimizations based on the CIUR-tree: outlier-detection-extraction optimization (ODECIUR) and text-entropy optimization (TE-CIUR), and the combination of two optimizations (ODETE). We also implemented the search algorithms based on the C2 IUR-tree, namely ODE-C2 IUR, TE-C2 IUR and ODE-TE-C2 IUR. In addition, we implemented the two baseline methods discussed in Section 4: the threshold TA-based method and the IR-tree-based method. Table III. Datasets for the experiments Statistics total # of objects total unique words in dataset average # words per object
GN 1,868,821 222,409 4
CD 1,555,209 21,578 47
Shop 803,155 3933 45
Datasets and Queries The algorithms are evaluated using three datasets: GeographicNames (GN), CaliforniaDBpedia (CD), and ShopBranches (Shop). These datasets differ from each other in terms of data-size, spatial-distribution, word-cardinality and text-size. Our goal in choosing these diverse sources is to understand the effectiveness and efficiency of our algorithms in different environments. The statistics of each dataset are shown in Table III. In particular, the GeographicNames dataset (geonames.usgs.gov) is a real-life dataset from the U.S. Board on geographic names with a large number of words to describe the information about each geographic location. The CaliforniaDBpedia dataset combines a real spatial data at California (www.usgs.gov) and a real collection of document abstracts about California in DBpedia (wiki.dbpedia.org/Downloads351). Finally, the ShopBranches is generated from a real-life data describing 955 shop branches and their products. We enlarge the original data by copying and shifting all objects to their neighborhood region while maintaining the distribution of the locations and textual information of the objects. In this way, the size of the data is scaled by up to more than 800 times. For each dataset, we generated 7 sets of query sets, in each of which the number of keywords is 2, 4, 8, 16, 32, 64 and 128, respectively. Each query set comprises 100 queries, each corresponding to a randomly selected object from the corresponding dataset. We report the average running time of 100 queries for each query set. Note that the tested queries are meaningful in real application scenarios. For example, in ShopBranches data, an RSKkNN query can be used to find shops that will be influenced by a new store outlet. Alternatively, in GeographicNames data, an RSKkNN query can be used to find national parks that will be influenced by a new park with a similar natural landscape. Setup and metrics We implemented all the algorithms with VC++6.0 on a server with an Intel(R) Core(TM)2 Quad CPU Q8200 @2.33GHz and 4GB of RAM. We implemented the algorithms based on both disk-resident and memory-resident data for the proposed index structures, namely IUR-tree, CIUR-tree and C2 IUR-tree. The page size is 4KB and the branch number of each index node is 102. ACM Transactions on Database Systems, Vol. V, No. N, Article 1, Publication date: January YYYY.
1:36
Y. Lu et al.
Both parameters λ and µ in ODE-CIUR are fixed at 0.9 by default. In the CIUR-tree and C2 IUR-tree, we cluster the textual vectors of objects into different number of clusters using the DBSCAN [Ester et al. 1996] clustering algorithm. We compare various algorithms with different experimental settings as follows: parameter k: 1 ∼ 128, default 4 parameter α: 0 ∼ 1, default 0.7 number of query words qw: 1∼128, default 16 number of clusters: 18∼14337, default 187 Space requirement The space usage for the structures used by the algorithms is shown in Table IV. The space usage of the CIUR-tree is slightly larger than that of the IUR-tree, since it needs extra space to store the intersection and union vectors for each cluster and the additional new entry “ClusterList” on each node. In addition, the space requirement of the C2 IUR-tree is also comparable with that of the CIUR-tree. The reason is that the C2 IUR-tree requires the same cluster information as does the CIUR-tree. The difference between the CIUR-tree and the C2 IUR-tree is that constructing the CIUR-tree is based on the heuristic of minimizing the spatial proximities of objects in CIUR-tree nodes; while the C2 IUR-tree is built based on the heuristic of minimizing both spatial and textual similarities of objects enclosed in the C2 IUR-tree node. Thus the objects enclosed in a C2 IUR-tree node and a CIUR-tree node are different. Table IV. Sizes of indexing structures Data GN CD Shop
IUR-tree 264MB 218MB 210MB
CIUR-tree 306MB 237MB 288MB
C2 IUR-tree 302MB 231MB 283MB
8.1. Experiments for search algorithms on IUR-trees and CIUR-trees
In the first set of experiments, we studied the performance and the scalability of different algorithms on IUR-trees and CIUR-trees when varying data sizes. In particular, we generated different datasets ranging from 100K to 1000K by randomly selecting objects from the original GN dataset shown in Table III. As baselines, we implemented two methods described in Section 4, which are based on the threshold algorithm (TA) [Fagin et al. 2003] (called Basline) and the IR-trees [Cong et al. 2009] (called BasedIRTree), respectively. Furthermore, we also studied the performances of algorithms based on the cosine similarity for textual similarity measurement. 8.1.1. Baselines vs. IUR-trees. Fig. 14(a) exhibits the running time of three algorithms based on two baselines and the IUR-tree. Note that the query time is shown in log scale. The IUR-tree clearly outperforms two baselines by orders of magnitude. The gap becomes larger when the size of datasets gets bigger, which empirically verifies the theoretical analysis about the computation complexity of baselines and our algorithms in Section 6.3. In addition, BasedIRtree outperforms Baseline when the size of data is larger than 600K. It is because BasedIRtree uses the IR-tree to find k spatialtextual neighbors and its superiority over the TA algorithm (in Baseline) becomes clear only in the setting of a large data set. Fig. 14(b) shows the performance of various algorithms based on the cosine similarity. Again, the IUR-tree is clearly the winner in this setting and performs significantly better than two baselines. Comparing Figures 14(a) and 14(b), we have some additional insights: the performances of Baseline based on the extended Jaccard and the cosine similarity are similar, whereas the performances of BasedIRtree and IUR-tree based on the cosine similarity perform worse than those based on the extended Jaccard. The reason is that the lower and upper bounds (in Eqn. 19) between two index nodes for the cosine similarity are not as tight as those for the extended Jaccard. In addition, BasedIRtree and IUR-tree rely on the bounds of textual similarity to prune nodes, but Baseline does not use those bounds. ACM Transactions on Database Systems, Vol. V, No. N, Article 1, Publication date: January YYYY.
Efficient Algorithms and Cost Models for Reverse Spatial-Keyword k-Nearest Neighbor Search 1:37
Query time (sec)
100000
1e+007
Baseline BasedIRtree IUR-tree
10000 1000 100 10
1
Baseline BasedIRtree IUR-tree
1e+006 100000 10000 1000 100
1 0.1
10
0.01
1
0 100 200 300 400 500 600 700 800 900 1000
100 200 300 400 500 600 700 800 900 1000
datasize (K)
datasize (K)
datasize (K)
1
(c) Varying data sizes, Query time
0.6
Without delay With delay
1200 1000 800
Query time (sec)
1400
Without inherit With inherit
0.5
0.8
Query time (sec)
# Page accesses
1600
0.4
100 200 300 400 500 600 700 800 900 1000
IUR-tree ODE-CIUR TE-CIUR ODE-TE
1800
0.6
0.2
(a) Varying data sizes (log-scale), Query (b) Varying data sizes (log-scale), Query time, with the extended Jaccard time, with the cosine similarity 2000
IUR-tree ODE-CIUR TE-CIUR ODE-TE
0.8
Query time (sec)
1e+006
Query time (sec)
1e+007
0.6 0.4 0.2
0.4 0.3 0.2 0.1
600 0 100 200 300 400 500 600 700 800 900 1000
0 IUR-tree
ODE-CIUR
datasize (K)
Query time (sec)
IUR-tree
0.2
IUR-tree ODE-CIUR TE-CIUR ODE-TE
0.6 0.4 0.2 0
0.15
2
4
8
16
32
64
k
(g) Varying k, Query time
128
TE-CIUR
ODE-TE
(f) Inherit 0.25
IUR-tree ODE-CIUR TE-CIUR ODE-TE
0.2
0.1
0.05
IUR-tree ODE-CIUR TE-CIUR ODE-TE
0.15 0.1 0.05
0 1
ODE-CIUR
Inherit
(e) Lazy travel-down
query time (sec)
1
ODE-TE
query time (sec)
(d) Varying data sizes, Page access
0.8
TE-CIUR
Lazy travel down
0 0
0.1
0.3
0.5
0.7
0.9
1
2
alpha
(h) Varying α, Query time
4
8
16
32
64
128
# query words
(i) Varying the number of query words, Query time
Fig. 14. Experimental results on the GN dataset
8.1.2. IUR-trees vs. CIUR-trees. In Fig. 14(c) and Fig. 14(d), we observe that the CIUR-treebased algorithms outperform the IUR-tree-based approaches, which indicates that the two optimizations (i.e. Outline Detection and Extraction (ODE) and Text Entropy (TE) optimizations) enhance the filtering power and reduce the number of index nodes visited. Note that the ODE-TE algorithm that combines the two optimization approaches is the fastest algorithm in this experiment and scales well with the size of the data sets. 8.1.3. Effect of “lazy travel-down” and “inherit”. To demonstrate the usefulness of the techniques used in our RSKkNN algorithm: “lazy travel-down” and “inherit” individually, we study the performance when one of the two techniques is turned off. First, Figure 14(e) shows that the “lazy travel-down” approach speeds up all four algorithms by more than 50%. This is because it can avoid visiting some irrelevant entries. Second, Figure 14(f) shows the benefit of inherit technology for all the algorithms. We observe that inherit can significantly improve the performance since it avoids computing contribution lists from the scratch. 8.1.4. Effect of parameters k, α and qw. In this set of experiments, we study how system performance is affected by the following parameters: the number of returned top results k, the combination ratio of the similarity function α and the number of words in queries qw. The results are reported in Figures 14(g)∼ 14(i). Figures 14(g) shows the runtime w.r.t. k. We fix α=0.7 and qw=16, and vary k from 1 to 9. The results show that the runtime and required I/O of our algorithms increase slightly as k grows. ACM Transactions on Database Systems, Vol. V, No. N, Article 1, Publication date: January YYYY.
1:38
Y. Lu et al. 0.6
0.6
ODE-CIUR
0.8
ODE-CIUR
0.3 0.2 0.1
query time (sec)
0.4
0.4 0.3 0.2 0.1
0 0.8
0.85
0.9
0.95
0.99
0.8
0.85
0.9
0.95
0.3 0.2
0.99
18
62
187
0.4
0.25 0.2 0.15 0.1
1940
5274 14337
(c) Effect of textual cluster number 2000
ODE-TE C2IUR-tree ODE-C2IUR TE-C2IUR ODE-TE-C2IUR
# Page accesses
0.5
IUR-tree ODE-CIUR TE-CIUR ODE-TE
714
Cluster number
(b) Effect of µ for ODE-CIUR
Query time (sec)
Query time (sec)
0.3
0.4
mu
(a) Effect of λ for ODE-CIUR 0.4
0.5
0 0.75
lambda
0.35
0.6
0.1
0 0.75
ODE-CIUR TE-CIUR
0.7
0.5
Query time (sec)
query time (sec)
0.5
0.3 0.2 0.1
1500
ODE-TE C2IUR-tree ODE-C2IUR TE-C2IUR ODE-TE-C2IUR
1000
500
0.05 0
0 1
2
4
8
16
32
64
128
0 100 200 300 400 500 600 700 800 900 1000
100 200 300 400 500 600 700 800 900 1000
datasize (K)
datasize (K)
k
(d) Memory resident
8000
C2IUR-tree
7000
0.5
0.25 0.2 0.15 0.1
# Page accesses
Query time (sec)
0.3
0.6
ODE-TE C2IUR-tree ODE-C2IUR TE-C2IUR ODE-TE-C2IUR
query time (sec)
0.4 0.35
(e) Varying data size for C2IUR-tree, (f) Varying data size for C2IUR-tree, Query time Page accesses
0.4 0.3 0.2 0.1
0.05 0 2
4
8
16
32
64
k
(g) Varying k for C2IUR-tree
128
IUR-tree ODE-CIUR TE-CIUR ODE-TE
5000 4000 3000 2000 1000
0 1
6000
0 18
62
187
714
1940
5274 14337
cluster number
0
30
60
90
120
cache size (MB)
(h) Varying cluster number for C2IUR- (i) Speedup vs cache size, Page accesses tree Fig. 15. Experimental results on the GN dataset
To evaluate the impact of α, we vary α from 0 to 1, thus adjusting the importance between textual similarity and spatial proximity. Figure 14(h) shows that our algorithm is insensitive to α. At α=1, i.e., text documents are totally ignored, the runtime is obviously shorter, as expected. Figures 14(i) shows the results when we vary the number of query words qw. We can see that the algorithms run faster as we increase qw from 2 to 32. This is because more query words may improve the pruning power by decreasing the average textual similarity between query words and data points. 8.1.5. Effect of parameters λ and µ for ODE-CIUR. This experiment is to study the effects of parameters λ and µ for ODE-CIUR. As shown in Fig. 15(a), with the increase of λ, the runtime first decreases and then increases. The interplay between λ and the running time can be illustrated as follows. Smaller λ means that the condition of Case I (described in Section 7.3) is easier to be satisfied and thus more entries are identified as Case I, which will lead to unnecessary accesses of entries. However, if the value of λ is too large (e.g., 0.99), the condition of Case I is too strict to be satisfied and thus the benefit of the optimization is marginal. Intuitively, there is a sweet spot between the two extremes. In our experiments, we found the best spot to be λ=0.9. As shown in Fig. 15(b), the effect of parameter µ is similar to that of the parameter λ. When µ is around 0.9, the performance is the best. 8.1.6. Effect of cluster number. As shown in Fig. 15(c), the performance of both ODE-CIUR and TE-CIUR is insensitive to the number of clusters, and they achieve the best performance when the ACM Transactions on Database Systems, Vol. V, No. N, Article 1, Publication date: January YYYY.
Efficient Algorithms and Cost Models for Reverse Spatial-Keyword k-Nearest Neighbor Search 1:39
number of cluster is around 200-1000. We can see that the runtime decreases as the number of clusters changes from 18 to 187, but increases as the number changes from 1,940 to 14,337. This is because the time needed for processing clusters counteracts the time saved by the text cluster enhancement. 8.1.7. Memory-resident implementation. This experiment is to evaluate the performance of the algorithms on memory-resident indexes. Since the size of the two ranking lists in the baseline method is too big to fit in memory, we evaluate the performance of the other four algorithms on the GN dataset when the indexes are in memory. As shown in Fig. 15(d), when varying the parameter k, ODE-TE outperforms the other algorithms, which is consistent with the results reported on diskresident indexes. 8.1.8. Effect of cache. This experiment is to evaluate the impact of the cache strategy on our algorithms. We used the well-known LRU cache method [Johnson and Shasha 1994], and varied the cache size from 0 to 120MB, where 120MB corresponds to about 20% of IUR-tree. As shown in Fig. 15(i) on the GN dataset, the cache method improves the I/O performance of all the algorithms. This is expected since caches save the I/O cost by reducing page accesses. Note that the cache strategy does not change the trend in the performance of different methods. That is the ODE-TE CIUR-tree, which combines two optimization strategies, is still the best of all the five algorithms. 8.2. Experiments for search algorithms on C2 IUR-tree 8.2.1. Performance of different algorithms and scalability. In this set of experiments, we evaluate the performance and the scalability of various algorithms on the C2 IUR-tree. As shown in Figures 15(e) and 15(f), all the search algorithms based on the C2 IUR-tree (including the C2 IUR, ODE-C2 IUR, TE-C2 IUR and ODE-TE-C2 IUR) outperform the ODE-TE algorithm which is the fastest among the search algorithms based on the CIUR-tree and its optimizations (ODE-CIUR, TE-CIUR and ODE-TE). Therefore, all the search algorithms based on the C2 IUR-tree are superior to the algorithms on the CIUR-tree and its optimizations. In addition, Figures 15(e) and 15(f) show that the optimization algorithms “Outlier Detection and Extraction” and “ Textual Entropy”, are also applicable to the C2 IUR-tree to prune the irrelevant objects and improve the performance. Moreover, we observe that the ODE-TE-C2 IUR algorithm that combines the two optimization approaches based on the C2 IUR-tree is the fastest among all the algorithms in our experiments. 8.2.2. Effect of parameter k. This experiment is to evaluate the impact of parameter k on the performance of the search algorithms on the C2 IUR-tree. As shown in Figure 15(g), by varying parameter k from 1 to 128, the runtime of our algorithms increase slightly with the increase of k. 8.2.3. Effect of cluster number. As discussed in Section 7.2, we use textual clusters to compute the textual entropy in the construction of C2 IUR-trees. In this set of experiments, we evaluated the effect of the number of clusters on the performance of the C2 IUR-tree. Note that this experiment is different from the one evaluating the effect of the number of clusters on the search optimizations based on the CIUR-tree in Figure 15(c) in Section 8.1.6. Figure 15(h) demonstrates that the query time tends to decline with the increase of the number of clusters. The reason is that with a larger number of clusters, the textual entropy would become more precise to represent the textual information in an index node, thus improving the efficiency of the algorithms. 8.3. Experiments on other datasets
All the above experimental results are reported on the GN dataset. We also conducted extensive sets of experiments on the other two datasets Shop and CD, and part of the experimental results are shown in Figures 16(a)-16(f). We can see that the trends of both sets of experimental results are consistent with those of the GN dataset. Therefore, they demonstrate the effectiveness and efficiency of our algorithms under different datasets with various data-sizes, spatial-distributions, word-cardinalities and text-sizes. ACM Transactions on Database Systems, Vol. V, No. N, Article 1, Publication date: January YYYY.
1:40
Y. Lu et al.
To summarize, our experimental results show that the proposed hybrid indexes and search algorithms outperform the baseline method, and the two optimizations with text-entropy and outlinedetection based on CIUR-tree and C2 IUR-tree can further improve the performance of the RSKkNN query.
query time (sec)
100000 10000
1e+008
Baseline IUR-tree ODE-CIUR TE-CIUR ODE-TE
1e+007
1000 100 10 1
1
Baseline IUR-tree ODE-CIUR TE-CIUR ODE-TE
0.8
query time (sec)
1e+006
page accesses
1e+007
1e+006 100000 10000
IUR-tree ODE-CIUR TE-CIUR ODE-TE
0.6 0.4 0.2
0.1 0.01
1000
0
100 200 300 400 500 600 700 800 9001000
100 200 300 400 500 600 700 800 9001000
datasize(K)
datasize(K)
1
100000
10000
5000
10000
1e+007
Baseline IUR-tree ODE-CIUR TE-CIUR ODE-TE
1000 100 10 1
8
16
32
64
128
(c) Varying k, CD, Query time
# Page accesses
1e+006
Query time (sec)
# page accesses
15000
1e+007
IUR-tree ODE-CIUR TE-CIUR ODE-TE
4
k
(a) Varying data sizes, CD, Query time (b) Varying data sizes, CD, Page access 20000
2
1e+006
Baseline IUR-tree ODE-CIUR TE-CIUR ODE-TE
100000
10000
0.1 0
0.01 1
2
4
8
16
32
64
128
k
(d) Varying k, CD, Page access
1000 100 200 300 400 500 600 700 800 900 1000
100 200 300 400 500 600 700 800 900 1000
datasize (K)
datasize (K)
(e) Varying data sizes, Shop, Query time (f) Varying data sizes, Shop, Page access
Fig. 16. Experimental results on CD and Shop datasets
9. Conclusions and Future Work
In this paper we introduced and addressed a new problem called RSKkNN queries, which is an extension of RkNN queries where the search criteria is based on the fusion of spatial information and textual description. This extension renders the existing solutions to answer RkNN queries inapplicable to RSKkNN queries. Thus, we presented the IUR-tree and its two optimizations CIUR-tree and C2 IUR-tree to represent and index the hybrid information and proposed the RSKkNN algorithm, which quickly computes contribution lists, and adjusts the thresholds to prune unrelated points and identify true hits as early as possible. We also provided a new cost model to theoretically analyze the performance of our algorithms. Finally, we conducted extensive experiments to verify the scalability and the performances of our proposed algorithms and optimizations. As for the future work, this article opens a number of promising directions. First, we plan to extend our algorithms to the bichromatic version of RSKkNN queries, considering the textual relevance for documents belonging to two different types of objects. Second, we intend to consider other variants of RSKkNN queries, such as the skyline RSKkNN queries. Finally, we would like to develop algorithms for the scenarios where the spatial objects are moving, uncertain objects or objects that are constrained to a road network. REFERENCES ¨ ¨ ACHTERT, E., B OHM , C., K R OGER , P., AND K UNATH , P. 2006. Efficient reverse k-nearest neighbor search in arbitrary metric spaces. In SIGMOD. 515–526. ¨ ¨ ACHTERT, E., K RIEGEL , H.-P., K R OGER , P., R ENZ , M., AND Z UFLE , A. 2009. Reverse k-nearest neighbor search in dynamic and general metric databases. In EDBT. 886–897. A.F OX , E., C HEN , Q. F., M.DAOUD , A., AND S.H EATH , L. 1991. Order-preserving minimal perfect hash functions and information retrieval. In TOIS. 281–308.
ACM Transactions on Database Systems, Vol. V, No. N, Article 1, Publication date: January YYYY.
Efficient Algorithms and Cost Models for Reverse Spatial-Keyword k-Nearest Neighbor Search 1:41 ¨ B ERCHTOLD , S., B OHM , C., K EIM , D., AND K RIEGEL , H. 1997. A cost model for nearest neighbour search in highdimensional data space. In Proceedings 16th ACM Conference on Principles of Database Systems(PODS). 78–86. B OHM , C. AND K RIEGEL , H. 2001. A cost model and index architecture for the similarity join. In Proceedings 17th IEEE International Conference on Data Engineering (ICDE). 411–420. B ORIAH , S., C HANDOLA , V., AND K UMAR , V. 2008. Similarity measures for categorical data: A comparative evaluation. In SDM. 243–254. C AO , X., C ONG , G., AND J ENSEN , C. S. 2010. Retrieving top-k prestige-based relevant spatial web objects. PVLDB 3, 1, 373–384. C HEEMA , M. A., L IN , X., Z HANG , W., AND Z HANG , Y. 2011. Influence zone: Efficiently processing reverse k nearest neighbors queries. In ICDE. 577–588. C HEEMA , M. A., L IN , X., Z HANG , W., AND Z HANG , Y. 2012. Efficiently processing snapshot and continuous reverse k nearest neighbors queries. In Proceedings of the VLDB Journal. C HEEMA , M. A., L IN , X., Z HANG , Y., 0011, W. W., AND Z HANG , W. 2009. Lazy updates: An efficient technique to continuously monitoring reverse knn. PVLDB 2, 1, 1138–1149. C ONG , G., S.J ENSEN , C., AND W U , D. 2009. Efficient retrieval of the top-k most relevant spatial web objects. In PVLDB. 337–348. C ORRAL , A., M ANOLOPOULOS , Y., T HEODORIDIS , Y., AND VASSILAKOPOULOS , M. 2006. Cost models for distance joins queries using r-trees. In Data & Knowledge Engineering. 1–36. D E G ROOT, M. H. AND S CHERVISH , M. J. 2004. Probability and statistics. In Pearson Education (US). E MRICH , T., K RIEGEL , H.-P., K ROGER , P., R ENZ , M., X U , N., AND Z UFLE , A. 2010. Reverse k-nearest neighbor monitoring on mobile objects. In GIS. 494–497. E STER , M., K RIEGEL , H.-P., S ANDER , J., AND X U , X. 1996. A density-based algorithm for discovering clusters in large spatial databases with noise. In KDD. 226–231. FAGIN , R., L OTEM , A., AND NAOR , M. 2003. Optimal aggregation algorithms for middleware. In J.Comput. Syst. Sci. 614–656. FALOUTSOS , C. AND K AMEL , I. 1994. Beyond uniformity and independence: Analysis of r-trees using the concept of fractal dimension. In Proceeding of the 13th ACM SIGACT-SIGMODE-SIGART Symposium on Principles of Database Systems. 4–13. FALOUTSOS , C., S ELLIS , T. K., AND ROUSSOPOULOS , N. 1987. Analysis of object oriented spatial access methods. In SIGMOD Conference. 426–439. G UTTMAN , A. 1984. R-trees: a dynamic index structure for spatial searching. In SIGMOD. 47–57. H AVELIWALA , T. H., G IONIS , A., K LEIN , D., AND I NDYK , P. 2002. Evaluating strategies for similarity search on the web. In Proceedings of the 11th international conference on World Wide Web. WWW ’02. 432–442. H UANG , A. 2008. Similarity measures for text document clustering. In In New Zealand Computer Science Research Student Conference. 49–56. H UANG , Y., J ING , N., AND E.A.RUNDENSTEINER. 1997. A cost model for estimating the performance of spatial joins using r-trees. In Proceedings 9th International Conference on Scientific and Statistical Database Management (SSDBM). 30– 38. I.D.F ELIPE, V.H RISTIDIS, AND N.R ISHE. 2008. Keyword search on spatial databases. In ICDE. 656–665. J OHNSON , T. AND S HASHA , D. 1994. 2q: A low overhead high performance buffer management replacement algorithm. In VLDB. 439–450. K AMEL , I. AND FALOUTSOS , C. 1993. On packing r-trees. In ICDE. 490–499. K ANG , J. M., M OKBEL , M. F., S HEKHAR , S., X IA , T., AND Z HANG , D. 2007. Continuous evaluation of monochromatic and bichromatic reverse nearest neighbors. In ICDE. 806–815. K HODAEI , A., S HAHABI , C., AND L I , C. 2012. Skif-p: a point-based indexing and ranking of web documents for spatialkeyword search. Geoinformatica 16, 3, 563–596. KORN , F. AND M UTHUKRISHNAN , S. 2000. Influenced sets based on reverse nearest neighbor queries. In SIGMOD. 201– 212. KORN , F., PAGEL , B., AND FALOUTSOS , C. 2001. On the ’dimensionlity curse’ and the ’self-similarity blessing’. In IEEE Transactions on Knowledge and Data Engineering. 96–111. K ULLBACK , S. AND L EIBLER , R. A. 1951. On information and sufficiency. The Annals of Mathematical Statistics 22, 1, 79–86. L EE , M. D. AND W ELSH , M. 2005. An empirical evaluation of models of text document similarity. In In CogSci2005. 1254–1259. L I , Z., L EE , K. C. K., Z HENG , B., L EE , W.-C., L EE , D. L., AND WANG , X. 2011. Ir-tree: An efficient index for geographic document search. IEEE Trans. Knowl. Data Eng. 23, 4, 585–599.
ACM Transactions on Database Systems, Vol. V, No. N, Article 1, Publication date: January YYYY.
1:42
Y. Lu et al.
L IN , K.-I., N OLEN , M., AND YANG , C. 2003. Applying bulk insertion techniques for dynamic reverse nearest neighbor problems. In IDEAS. 290–297. L U , J., L U , Y., AND C ONG , G. 2011. Reverse spatial and textual k nearest neighbor search. In SIGMOD Conference. 349–360. N.ROUSSOPOULOS, S.K ELLEY, AND F.V INCENT. 1995. Nearest neighbor queries. In SIGMOD. 71–79. PAGEL , B., S IX , H.-W., T OBEN , H., AND W IDMAYER , P. 1993. Towards an analysis of range query performance in spatial data structures. In Proceeding of the 12th ACM SIGACT-SIGMODE-SIGART Symposium on Principles of Database Systems. 214–221. PAPADOPOULOS , A. AND M ANOLOPOULOS , Y. 1997. Performance of nearest neighbour queries in r-trees. In Proceeding of the 6th International Conference on Database Theory. 394–408. S ALTENIS , S., J ENSEN , C. S., L EUTENEGGER , S. T., AND L OPEZ , M. A. 2000. Indexing the positions of continuously moving objects. In Proceedings of the ACM SIGMOD Conference. 331–342. S ALTON. 1988. Term-weighting approaches in automatic text retrieval. In Information Processing and Management. 513– 523. S INGH , A., F ERHATOSMANOGLU , H., AND T OSUN , A. S. 2003. High dimensional reverse nearest neighbor queries. In CIKM. 91–98. S TANOI , I., AGRAWAL , D., AND A BBADI , A. E. 2000. Reverse nearest neighbor queries for dynamic databases. In ACM SIGMOD Workshop on Research Issues in Data Mining and Knowledge Discovery. 44–53. S TANOI , I., R IEDEWALD , M., AGRAWAL , D., AND A BBADI , A. 2001. Discovery of influence sets in frequently updated databases. In VLDB. 99–108. S TREHL , A., S TREHL , E., G HOSH , J., AND M OONEY, R. 2000. Impact of similarity measures on web-page clustering. In In Workshop on Artificial Intelligence for Web Search (AAAI 2000). AAAI, 58–64. TAN , P.-N., S TEINBACH , M., AND K UMAR , V. 2005. Introduction to Data Mining. Addison-Wesley. TAO , Y. AND PAPADIAS , D. 2003. Spatial queries in dynamic environments. In ACM Transactions on Database Systems (TODS). Vol. 28. TAO , Y., PAPADIAS , D., AND L IAN , X. 2004. Reverse knn search in arbitrary dimensionality. In VLDB. 744–755. TAO , Y., Z HANG , J., PAPADIAS , D., AND M AMOULIS , N. 2004. An efficient cost model for optimization of nearest neighbour search in low and medium dimensional spaces. In IEEE Transactions on Knowledge and Data Engineering. 1169– 1184. T HEODORIDIS , Y. AND S ELLIS , T. 1996. A model for the prediction of r-tree performance. In PODS. 161–171. T HEODORIDIS , Y., S TEFANAKIS , E., AND S ELLIS , T. 2000. Efficient cost models for spatial queries using r-trees. In IEEE Transactions on Knowledge and Data Engineering. 19–32. T ITCHMARSH , E. C. 2005. The theory of the riemann zeta-function. In Oxford University Press. VAID , S., J ONES , C. B., J OHO , H., AND S ANDERSON , M. 2005. Spatio-textual indexing for geographical search on the web. In SSTD. 218–235. ˚ , K. 2010. Reverse top-k queries. In ICDE. 365–376. V LACHOU , A., D OULKERIDIS , C., KOTIDIS , Y., AND N ØRV AG W U , W., YANG , F., C HAN , C. Y., AND TAN , K.-L. 2008a. Continuous reverse k-nearest-neighbor monitoring. In MDM. Beijing, 132–139. W U , W., YANG , F., C HAN , C.-Y., AND TAN , K.-L. 2008b. Finch:evaluating reverse k-nearest-neighbor queries on location data. In PVLDB. 1056–1067. Z HANG , D., C HEE , Y. M., M ONDAL , A., T UNG , A. K. H., AND K ITSUREGAWA , M. 2009. Keyword search in spatial databases: Towards searching by document. In ICDE. 688–699. Z HOU , Y., X IE , X., WANG , C., G ONG , Y., AND M A , W.-Y. 2005. Hybrid index structures for location-based web search. In Proceedings of the 14th ACM international conference on Information and knowledge management. CIKM ’05. ACM, New York, NY, USA, 155–162. Received June 2012; revised June 2013; accepted January 2014
ACM Transactions on Database Systems, Vol. V, No. N, Article 1, Publication date: January YYYY.