Holguín-Veras, Sánchez, González-Calderón, Sarmiento, and Thorson
1
TIME-DEPENDENT EFFECTS ON PARAMETERS OF FREIGHT DEMAND MODELS: AN EMPIRICAL INVESTIGATION José Holguín-Veras1, Iván Sánchez2, Carlos González-Calderón3, Iván Sarmiento4, Ellen Thorson5
ABSTRACT This paper conducts an empirical investigation of the temporal stability of parameters of freight demand models in the short-medium term using seven national freight origin-destination samples collected in Colombia during the years 1999 to 2005. The paper considers freight generation, freight distribution, and empty trip models. To identify time-dependent effects, models were estimated using a panel formulation with time-dependent parameters and fixed time effects, and compared with the corresponding crosssectional models. The results indicate the presence of statistically significant time-dependent effects on all freight generation models (production and attraction), freight distribution models (both based on loaded vehicle trips and commodity flows), and empty trips models. The literature review conducted indicates that this article is, if not the first, one of the few publications studying the temporal stability of parameters. The results show a remarkably consistent pattern in that the components of freight demand that could change faster (i.e., freight production and attraction) are the ones that exhibit the largest rates of parameter change. As shown, the rates of change for these models are 18.29% and 26.37% respectively. In contrast, the freight distribution models of loaded trips were found to change less rapidly (10.50% and 1.94% depending on the impedance function); while the tonnage distribution model only exhibited fixed time effects. The model that changes least rapidly is the empty trip model, with a rate of change of 0.83%.
1
William H. Hart Professor, Department of Civil and Environmental Engineering. Director of the Center for Infrastructure, Transportation, and the Environment. Rensselaer Polytechnic Institute. 110 8th Street, Room JEC 4030, Troy, NY 12180 USA. Phone: 518-276-6221. Fax: 518-276-4833. E-mail:
[email protected] 2 Ph.D. Student Department of Civil and Environmental Engineering, Rensselaer Polytechnic Institute 110 8th Street, Room JEC 4037, Troy, NY 12180 USA. Phone: 518-276-3121. Fax: 518-276-4833. E-mail:
[email protected] 3 Assistant Professor Universidad de Antioquia. Medellin, Colombia. Ph.D. Student Department of Civil and Environmental Engineering, Rensselaer Polytechnic Institute 110 8th Street, Room JEC 4037, Troy, NY 12180 USA. Phone: 518-276-3121. Fax: 518-276-4833. E-mail:
[email protected] 4 Associate Professor Escuela Ingeniería Civil, Universidad Nacional de Colombia Sede Medellín. Calle 65 N° 78-28 Bloque M1-223. Medellín, Colombia. Phone: (57-4) 4255162. Fax: (57-4) 4255152. E-mail:
[email protected] 5 Senior Research Fellow, University Transportation Research Center, The City College of New York, Marshak Hall Suite 910A 138th Street & Convent Avenue, New York, NY 10031, USA. Phone: 212 650-8144. Fax: 212 650-8374. E-mail:
[email protected]
Holguín-Veras, Sánchez, González-Calderón, Sarmiento, and Thorson
I.
2
INTRODUCTION
Analytical transportation planning relies on the use of demand and supply (network) models to predict future conditions and the impact of different projects and programs on the transportation system. In most cases, the models used in these activities are estimated using cross-sectional data from a calibration (base) year. Once the models have been successfully calibrated, their independent variables are forecasted for different scenarios, and used as an input to freight demand models to estimate future demand. In the overwhelming number of cases, (temporal) parameter stability is implicitly invoked when it is assumed that the models’ parameters do not change over time. This assumption is important because evidence of it improves the chances of developing models able to produce accurate forecasts (1, 2). The practical reasons for assuming parameter stability are obvious as, more often than not, there are no data to study how the parameters evolve over time. This is not to say that there are no concerns about this assumption, as there are many indications that it is problematic. First, should the economic conditions lead to changes in the structure of the freight flows, the parameters of the models will also be affected. Second, the ever changing nature of the world economy means that the economic linkages between different economic sectors that determine freight activity are constantly being created, transformed, and eliminated. In this context, emerging industry sectors are likely to lead to freight flows not necessarily captured in previous data collection efforts. For instance, the globalization of the world economy led to major increases in the volumes and the distances at which freight is transported. As a result, it is unlikely that freight models calibrated with data collected in the 1980s could have captured, and much less predicted, the freight flow patterns produced by globalization. Third, there is the role played by political and social drivers. Events such as the collapse of the Soviet Union profoundly altered the European patterns of commerce. Fourth, societal trends, such as the increasing level of awareness of environmental issues, are inducing companies to change their distribution and delivery patterns, out of a desire to be perceived as responsible corporate citizens. In many instances, companies have implemented changes in their distribution patterns that, though more sustainable in the long term, are more costly. As in the previous case, the net effect is to change the geographical patterns of freight flows and their relation to transportation costs, which impact the parameters of freight demand models. All of this implies that the assumption of temporal parameter stability, at the heart of transportation demand modeling, is on shaky grounds. However, not much research has been reported in the literature concerning parameter stability, and even less in freight demand. The literature review only found a handful of papers mostly focusing on transferability issues (1, 3, 4). This review suggests that this paper, if not the first, is one of the few publications that has systematically studied the temporal stability of parameters of transportation demand models. The main objective of this paper is to contribute to the study of parameter stability of freight demand models via the systematic analysis of seven national freight origin-destination (OD) matrices collected by the Colombia’s Ministry of Transportation during the 1999 to 2005 period. Since the efforts made to obtain older OD data were not successful, the emphasis of the paper is on short-medium term changes as this is what is permitted by the data available. In the future, once additional data sets become available, it would be possible to re-examine the analyses made here with a longer term perspective. The main focus of the analysis is on the various aspects concerning freight demand at the aggregate level: generation, distribution, and empty trips. The paper has seven sections in addition to this introduction. Section 2 provides a brief description of the data used in the paper. Section 3 describes the overall approach used. Sections 4, 5 and 6 discuss the parameter stability of freight generation, distribution, and empty trip models. Section 7 discusses overall results. Section 8 summarizes the key findings.
Holguín-Veras, Sánchez, González-Calderón, Sarmiento, and Thorson
II.
3
DESCRIPTIONS OF THE DATA
The Freight Origin–Destination Survey (FODS) is a data collection program initiated by Colombia’s Ministry of Transportation in the 1990s. One of the FODS’ unique features is that it is conducted in the same way year after year, which makes it ideal for studies like this in which data comparability is a must. The FODS takes place at about 70 survey stations, where interviewers collect data about origins and destinations, commodity type, vehicles used, container type, among others. It provides a comprehensive picture of highway based freight flows in Colombia (70% of the tonnage transported). The FODS is a sizable program with more than 130,000 surveys every year collected during five consecutive days in a representative week of the year, between 6:00 AM and 6:00 PM. The population includes all trucks with a capacity larger than or equal to two metric tons that pass the screenlines during the survey period, including international shipments and all commodities transported by truck. To avoid double counting a ticket is given to drivers who have been interviewed so that they do are not interviewed at another survey station. At the finest level of geographic detail, the survey data are geocoded at the municipal level, which leads to OD matrices with 1,100x1,100 cells. The analyses in this paper are based on an aggregation to 36 transportation analysis zones (political departments in Colombia) because in this format the coverage is more complete (electronic versions of the original files at a finer level of detail were only found for four years). The zoning system used includes 32 internal zones (departments) and four external zones (Ecuador, Venezuela, Peru, and Panama). TABLE 1 shows a summary for Colombian freight transportation statistics (2004) that includes the breakdown by industry sector and the truck capacity by truck type. The table shows that the manufacturing sector is the one that moves the largest amount of cargo (about 55% of the total). The table also shows the load factors by weight that, as shown, depend on the vehicle type. The observed values range from 50% for four axle trucks to about 66% for 3S3 semi-trailers.
TABLE 1 Summary Statistics for FODS 2004 (metric tons)
Holguín-Veras, Sánchez, González-Calderón, Sarmiento, and Thorson
III.
4
OVERALL APPROACH
The approach used in the paper relies on econometric modeling because doing so enables statistical testing of the significance of time-dependent effects. In doing this, panel models with time-dependent parameters and fixed effects are used to assess how parameters change over time, and to detect the presence of time effects not captured by the other parameters. This approach can yield a base parameter (b), a time dependent parameter (t) that modifies the base one, and a set of parameters (t), that quantify the fixed time effects for the different years. The ratio t /b is the yearly rate of change produced by the timedependent parameter. In all cases, the first year was used as the base case. For comparative purposes, cross sectional models are also shown. It is appropriate to acknowledge that the emphasis on econometric modeling comes at the expense of model sophistication. For instance, the paper uses a simple gravity model instead of the more advanced doubly constrained version because the former allows for statistical testing of time-dependency on the parameters, while the latter does not. The models’ simplicity is also due to the lack of data concerning explanatory variables as the original data files—particularly for the older data—are no longer available. For that reason, the vast majority of the models are estimated with aggregate data, e.g., population, that could be obtained from national statistics. In cases, where two different formulations lead to different results more weight will be given to the one with the highest explanatory power—measured by the F and R2 statistics— which is assumed to be the better model.
IV.
FREIGHT GENERATION
Freight generation is concerned with the estimation of the amount of freight produced and attracted by either individual establishments or zones. As in all other aspects of freight demand models, the amount of publications discussing freight generation is small. This is a complex topic because it is determined by the operational procedures of the establishment that generates the freight (e.g., storage capacity, inventory costs). Adding to the complexity, freight could be measured in multiple ways (e.g., weight, vehicle-trips, deliveries), and studied at the zonal or the establishment level. This paper focuses on zone level models, which is typical of national freight demand modeling projects. The analyses use department level estimates of Gross Domestic Product (GDP) and population as the independent variables to explain freight production and attraction. Although other independent variables could be used, focusing on these two is important because they are frequently used to explain freight demand. The GDP and population were obtained from the Colombia’s Department of National Statistics (6).
4.1
Freight Production
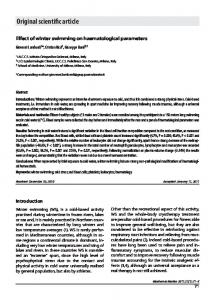
The data used to study the relationship between freight production and GDP span over seven years (19992005). There are good reasons to use GDP, as freight flows are the physical representation of the trade patterns captured in these indicators. To start, it is convenient to take a look at the relationship between the total tons produced by different zones and their GDP. FIGURE 1 shows the results for 1999 and 2005. The
5
Holguín-Veras, Sánchez, González-Calderón, Sarmiento, and Thorson
figure shows that in general, both GDP and freight production track each other fairly well and that, over time more cargo is being transported for the same level of GDP.
FIGURE 1 Tons Produced vs. GDP (1999 and 2005) The linear model is:
FP ,t b 1 t't GDPt t t b GDPt t t (GDPt ) t t t
(1)
t
Where: FP,t is the freight production function in tons; GDPt is the Gross Domestic Product of each department in millions of Colombian pesos (one million Colombian pesos = US$530) at year t, b is the freight production per unit GDP for the base year, t b t' is the parameter that measures the impact of time on the production of freight; t are the binary variables representing the different years; and the parameters t represent the fixed time effects on freight production of year t. The second model is a power function (equation 2), in which the exponent is the elasticity of production with respect to GDP. The results are shown in TABLE 2.
ln( FP ,t ) ( b t t ) ln GDPt t t
(2)
t
TABLE 2 Freight Production Models As shown in TABLE 2, the parameters are not stable over time. The panel models (Part A) have time-dependent coefficients and/or fixed time effects. However, while the linear model did not find timedependent parameters, the power model did, which highlights the role of model specification. It is important to mention that the parameters of the fixed effect binaries consistently increase over time (in absolute value), signaling the increasing importance of the time effects. This suggests that, as time passes, the forecasting error increases. In general terms, panel and cross-sectional models produce consistent results. It is worthy to mention the relative magnitude of the time-dependent parameter t with respect to the base parameter b for the power model. This indicates that, for every year that passes, the amount of freight produced by a unit of GDP increases by 18% (though some of this increase is counterbalanced by the fixed effect parameters). This may be related to the use of 1999 as the base year of the models because this was a year of economic crisis, when GDP decreased by 4.3%, which led to structural changes in the Colombian economy and was followed by a continued increase of the GDP in the following years. This helps to explain the lack of stability of the parameters as they span over years of crisis and then economic expansion (7).
4.2
Attraction Models
In this subsection the relation between total tons attracted by the different zones and the corresponding population (P) is studied. The data are shown in FIGURE 2 for 1999 and 2005. As in the case of freight production, the data show that the amount of freight attracted by the population centers has increased over time. For instance, while the city of Bogota attracted about 13 million tons in 1999, it attracted more than 20 million tons in 2005.
FIGURE 2 Tons attracted vs. Population (1999 and 2005)
6
Holguín-Veras, Sánchez, González-Calderón, Sarmiento, and Thorson
The linear and non-linear models are shown by equation (3) and (4) respectively, and the results are summarized in TABLE 3:
FA,t b Pt t t ( Pt ) t t
(3)
t
ln( FA,t ) ( b t t ) ln( Pt ) t t
(4)
t
TABLE 3 Results for Freight Attraction The results shown in TABLE 3 indicate time dependent effects (with either time-dependent parameters or fixed time effects). As in the production case, the absolute value of the fixed time effects increase over time indicating a growing divergence between each year and the average trend. In both cases, the parameters of the panel models are in good agreement with the cross-sectional models. The analyses in this section clearly indicate that, regardless of the formulation, the parameters of freight attraction and production are not temporally stable. The statistical models that express the parameter values as a function of time indicate that, in almost all cases, the parameters are time-dependent, and have fixed time effects. In essence, these results indicate that, over time, more freight is being produced and attracted by a unit of GDP and population, respectively. The ratio of t / b of the power model is equal to 0.26 indicating the unit consumption of cargo per individual is consistently increasing over time (as in the previous case, fixed effect parameters reduce the net effect of this increase). This, yet again, may indicate major changes in economic patterns and an increasingly consumer oriented society. Some important economic and political factors might explain this structural change. As a result of the failure of the Colombian government to negotiate with the guerrillas in 2000, the voters elected a new government that succeeded in securing control of highways, improving security, and ending kidnappings and truck burnings. The improved sense of security translated into a boost to consumer confidence and economic activity (7), which are likely to have impacted freight generation patterns.
V.
FREIGHT DISTRIBUTION
These models focus on the estimation of freight distribution patterns. This is probably one of the processes in which freight demand modeling is the weakest. The bulk of freight demand modeling applications relies on the use of distribution models originally designed for passenger demand modeling. The main focus of these models, e.g., gravity, is on modeling the flows between and origin i and a destination j as a function of the zonal attributes of i and j and the travel impedance. This is acceptable in passenger transportation as, in most cases, the frequency of long trip chains is small and the assumption may be considered appropriate. However, in freight transportation—where long tours are the norm—this assumption could be problematic. In Denver, for instance, the number of stops per tour is 5.6 (8). As a result, the physical origins and destinations of the individual trips tend not to match the production and consumption relations. When this happens, the assumption made by most distribution models, i.e., that the individual trips could be explained by the attributes of i and j, breaks down and the use of traditional distribution models is in question. This is likely to be the case of urban freight. However, there are cases in which the mismatch between production-consumption (PC) and origin-destinations (OD) is less of an issue.
7
Holguín-Veras, Sánchez, González-Calderón, Sarmiento, and Thorson
One such case is in intercity freight transportation in developing countries like Colombia where the number of long tours is much less than in urban freight. This leads to a situation in which using trip-based distribution models is a reasonable decision. In this section, a set of simple gravity models (GM) are estimated for both commodity flows (metric tons), and loaded trips (vehicle trips). Although within the GM family there are other better alternatives (e.g., singly and doubly constrained GMs), the simple GM is used because it could be readily estimated with standard statistical techniques that support significance testing of its parameters. The mathematical form of the model is shown in equation (5). The models were estimated for six years (20002005). Distance was used as the impedance variable because costs were not available for all years. The models in this section only for the loaded trips in the network, as the corresponding empty trips are analyzed in Section VI.
Tij ,t t Oi ,t D j ,t f (cij ,t )
(5)
Where: Tij,t = Tonnage/Loaded trips from i to j at time t Oi,t= Tonnage/Loaded trips from origin i at time t Dj,t= Tonnage/Loaded trips to destination j at time t
t= constant to be determined empirically at time t cij,t= cost from zone i to zone j at time t f(cij,t)= impedance function at time t The impedance functions used in the paper are:
f (cij ,t ) e
( b t t )*cij ,t ( b t t )
f (cij ,t ) cij ,t
(exponential)
(6)
(power)
(7)
The linearized versions of the simple GM with exponential and power functions are shown below:
ln(Tij ,t ) ln(Oi ,t ) ln( D j ,t ) ' b,t (cij ,t ) t t (cij ,t ) t t
(8)
ln(Tij ,t ) ln(Oi ,t ) ln( D j ,t ) ' b,t ln(cij ,t ) t t ln(cij ,t ) t t
(9)
t
t
The parameter t for the binary variables representing each year are the fixed time effect on the freight sent from i to j of year t; while the parameter t represents the impact of time on the base parameter of the impedance function b. TABLE 4 shows the results for both impedance functions.
TABLE 4 Results for Freight Distribution The results shown in TABLE 4 also indicate that the simple GM has a low explanatory power though its explanatory variables have high statistical significance. This is an indication that the model left out other relevant explanatory variables, which is to be expected given its simplistic structure. In spite of
8
Holguín-Veras, Sánchez, González-Calderón, Sarmiento, and Thorson
this limitation, conclusions could be reached concerning the statistical significance of the variables in the model. However, the results are mixed. In the case of the simple GM estimated for vehicle-trips, both the exponential and power function versions identify time-dependent effects as the time dependent component of the parameter is statistically significant (though no fixed time effects were detected). In contrast, the model based on tonnage did not detect any evidence of time-dependent parameters but found fixed time effects. The rate of change of the parameters depends on the impedance function: 10.5% for the exponential and 1.97% for the power function. These numbers are smaller than the ones estimated for the freight production and attraction models, which indicates that freight distribution (measured in loaded trips) does not change as rapidly as freight generation. It is not entirely unexpected that the commodity flows and vehicle trips models lead to different results, as they measured different things. The commodity flows are an expression of the demand generated by the production and consumption patterns over the geography of an economy. As a result, the commodity flow patterns are expected to exhibit a lot of inertia. Vehicle-trips, on the other hand, are an expression of the vehicular supply and of how the freight industry organizes itself to transport the demand. In contrast to the commodity flows, freight carriers could change operations relatively quickly (e.g., by consolidating cargo, changing vehicle types, re-routing). This may explain why the vehicle-trip models exhibit more significant time dependent effects than the ones based on commodity flows. As in other cases, there is a relatively good match between panel and cross-sectional models.
VI.
EMPTY TRIPS
One of the unique and most frequently overlooked aspects of freight transportation are the empty trips that it generates, which are very important for modeling purposes. According to the last issue of the Vehicle and Inventory Use Survey (9), empty travel account for: 56% of the miles traveled by straight truck not pulling a trailer; 58% of the miles traveled by straight truck pulling a trailer, and 33% of the miles traveled by truck tractor (power-unit) pulling trailer(s). As a percentage of the trips made, empty travel typically accounts for about 20% of truck traffic in urban areas (10), and about 30% in intercity freight (11). More significant from the modeling point of view is that empty trip flows do not follow the pattern of loaded trips as the empty trips tend to run counter to the commodity flows. As a result, trying to compensate for the empty trips by expanding the matrices of loaded trips, or not accounting for the empties, leads to major errors in the estimation of directional traffic (12). The only way to properly account for empty traffic is to use complementary models (11-15) that estimate the flows of empties from the commodity flow matrix using of simplifying assumptions of tour behavior. These models have been successfully used in models in Sweden, Denmark, Colombia, New York State, among others. The general formulation is shown below (11). The Noortman and Van Es’ (NVE) model corresponds to equal to zero in equation (10):
E zij
mij aij
p
m ji a ji
xhi P h j P h E / j h j
(10)
Where: aij= average payload (tons/trip) for trips from i to j
p = probability of a zero order trip chain
γ = parameter to be determined empirically
mij = commodity flow between i and j
9
Holguín-Veras, Sánchez, González-Calderón, Sarmiento, and Thorson
xhi = mhi/a = number of loaded trips from h to i
P h j = probability that a vehicle that came from h to i chooses j as the next destination Ph E / j = probability that a vehicle following the tour h-i-j does not get cargo to j
P h j P h E / j = probability that a vehicle traveling in h-i-j goes empty to j P h j is a function of the attractiveness of zone j as a destination. A number of different formulations could be obtained depending on the assumption made, though the paper only considers the NVE model (=0) that, in its basic form, is equal to:
E zij
mij aij
p
m ji a ji
xij px ji xij yij
(11)
Where: yij are the empty trips from i to j Thus, since the empty trips are equal to:
yij px ji
(12)
the model with time dependent parameter and fixed time effects becomes:
yij ,t b x ji ,t t tx ji ,t t t
(13)
t
The analyses focus on the stability of parameters like the percentage of empty trips in the network, and the parameters of empty trip models. TABLE 11 shows that, during the period 2000-2004, the percentage of empty trips did not vary very much, and then dropped in 2005.
TABLE 5 Results for Empty Trip (NVE) Model As shown in the table, the time dependent coefficient is significant though its value is relatively small. This indicates that the number of empty trips is slightly decreasing from year to year, which may reflect the drop in empty trips observed for 2005. The rate of change of the parameter is quite small (about 0.83%). Again, there is a good match between panel and cross-sectional models.
VII.
OVERALL RESULTS AND DISCUSSION
In order to gain insight into the relative importance of the time dependent effects identified in this research, the authors put together a summary table (
10
Holguín-Veras, Sánchez, González-Calderón, Sarmiento, and Thorson
TABLE 9 Results for Freight Attraction A) Panel model for freight attraction Linear model (Parameter), Variable Paramet-value ter value (β b), Population, ln(Pop) 1.937 19.842 (β t ), Population*t, t*ln(Pop)
0.270
7.403
(α1 ), 2000
-4.089
-6.320
(α2 ), 2001
-7.542
-7.128
(α3 ), 2002
-11.402
-7.479
(α4 ), 2003
-14.799
-7.367
(α5 ), 2004
-18.627
-7.447
(α6 ), 2005
-22.118
-7.378 Adj. R²=0.979 F=1579.4 1
Time dependent ?
0.086
Power model Paramet-value ter value 1.024 42.501
Yes
7.679
Adj. R²=0.905 F=1021.4 3
Yes
B) Cross sectional models for freight attraction Linear model Year Paramet-value Adj. R² ter b
Power model F
Parameter b
t-value
Adj. R²
F
1999
2.0948
11.78
0.92
138.80
1.0167
66.02
0.96
15,270.55
2000
1.9332
14.83
0.94
220.00
1.0253
141.11
0.96
18,499.24
2001
2.6450
14.56
0.94
212.10
1.0442
133.34
0.96
16,798.12
2002
2.0898
13.45
0.94
181.00
1.0331
101.70
0.96
9,064.24
2003
2.4910
12.04
0.90
145.10
1.0299
79.84
0.96
9,232.67
2004 2005
2.9191 3.4782
14.04 11.36
0.90 0.92
197.20 129.00
1.0499 1.0670
114.10 117.34
0.96 0.96
12,148.76 12,857.68
11
Holguín-Veras, Sánchez, González-Calderón, Sarmiento, and Thorson
TABLE 10 Results for Freight Distribution A) Panel models for freight distribution in tons (Parameter), Variable (β 0 ), Intercept
Exponential function Parameter t-value value -17.7260 -307.96
Power function Parameter t-value value -13.4457 -34.15
(β b), Dist, ln(Dist)
-0.0018
-27.03
-0.8724
-13.17
(α1 ), 2001
-0.2438
-3.56
-0.2445
-3.62
(α2 ), 2003
-0.3234
-4.58
-0.3301
-4.74
(α3 ), 2004
-0.4053
-5.79
-0.4082
-5.92
(α4 ), 2005
-0.6473
-0.6448
Time dependent ?
YES
-9.05 Adj. R²=0.160 F=163.72
-9.13 Adj. R²=0.141 F=134.89
YES
B) Panel models for freight distribution in loaded trips Exponential Function Parameter t-value value -15.231130 -352.060
Power Function Parameter t-value value -10.518240 -51.210
(β b) Dist, ln(Dist)
-0.001590
-21.080
-0.916097
-27.890
(β t ), t*Dist, t*ln(Dist)
-0.000167
-0.017806
Time dependent ?
YES
-9.180 Adj. R²=0.203 F=547.76
-9.230 Adj. R²=0.186 F=472.30
(Parameter), Variable (β 0 ), Intercept
YES
C) Cross sectional models for simple gravity model Year
Tons
Loaded trips
2000
Exponential (c) -0.00171
Power (b) -0.869
Exponential (c) -0.00178
Power (b) -0.922
2001
-0.00181
-0.851
-0.00178
-0.859
2002
-0.00158
-0.729
-0.00176
-0.837
2003
-0.00212
-0.984
-0.00229
-1.070
2004
-0.00185
-0.877
-0.00198
-0.936
2005
-0.00194
-0.926
-0.00243
-1.148
12
Holguín-Veras, Sánchez, González-Calderón, Sarmiento, and Thorson
TABLE 11 Results for Empty Trip (NVE) Model A) Panel model
B) Cross sectional model
Linear Model (Parameter), Variable Parameter t-value value (β b), Xij 0.407 70.522
Year
p
Adjusted R²
Percent of empty trips
2000
0.434
0.766
28.5%
(βt ), t*Xji
-0.003
-2.112
2001
0.355
0.632
28.4%
0.395
0.711
27.3%
Yes
Adjusted R²=0.711 F=9574.35
2002
Time dependent ?
2003
0.444
0.723
30.0%
2004
0.421
0.722
29.6%
2005
0.369
0.728
26.4%
Holguín-Veras, Sánchez, González-Calderón, Sarmiento, and Thorson
13
TABLE 12) with the chief results. The table shows the coefficient of determination (R2) as an indication of the model’s explanatory power, the rate of change of the parameter of key independent variable (t /b), and a qualitative indication of the presence and trend of fixed time effects. The results have been sorted in descending order of the rate of change.
TABLE 6 Freight Models Parameter Stability The results show a remarkably consistent pattern in that the components of freight demand that could change faster (i.e., freight production and attraction) are the ones that exhibit the largest rates of parameter change. As shown, the rates of change for freight production and attraction are 18.29% and 26.37% respectively. This indicates that more freight is being generated as a function of the corresponding independent variables. It should be mentioned that some of the effect of the time-dependent parameter is counterbalanced by the fixed effect parameters (which are increasingly negative). The results for freight distribution models are more nuanced as the picture is slightly more complex. The freight model based on loaded trips exhibit a rate of change (10.50%) that is much larger than the one for the freight distribution model based on tonnage (0%), which indicates a shortening of trip lengths as time passes. The distribution model based on tonnage, though not finding a time dependent parameter, did identify fixed time effects. In essence, the conclusion seems to be that the loaded trips have exhibited a more profound change than the commodity flow matrices. This seems to be conceptually correct as the commodity distribution matrix reflects the production and consumption patterns, which do not change very rapidly. For instance, it is very difficult for an area of the country that has never played a large role in agricultural production to emerge as an agricultural powerhouse that successfully exports its products to other parts of the country. The loaded trip distribution matrix, on the other hand, is influenced by the logistical decisions that freight carriers made concerning types of vehicles used, routing patterns and the like. These decisions could change the patterns captured by the loaded trips distribution matrix.
14
Holguín-Veras, Sánchez, González-Calderón, Sarmiento, and Thorson
TABLE 9 Results for Freight Attraction A) Panel model for freight attraction Linear model (Parameter), Variable Paramet-value ter value (β b), Population, ln(Pop) 1.937 19.842 (β t ), Population*t, t*ln(Pop)
0.270
7.403
(α1 ), 2000
-4.089
-6.320
(α2 ), 2001
-7.542
-7.128
(α3 ), 2002
-11.402
-7.479
(α4 ), 2003
-14.799
-7.367
(α5 ), 2004
-18.627
-7.447
(α6 ), 2005
-22.118
-7.378 Adj. R²=0.979 F=1579.4 1
Time dependent ?
0.086
Power model Paramet-value ter value 1.024 42.501
Yes
7.679
Adj. R²=0.905 F=1021.4 3
Yes
B) Cross sectional models for freight attraction Linear model Year Paramet-value Adj. R² ter b
Power model F
Parameter b
t-value
Adj. R²
F
1999
2.0948
11.78
0.92
138.80
1.0167
66.02
0.96
15,270.55
2000
1.9332
14.83
0.94
220.00
1.0253
141.11
0.96
18,499.24
2001
2.6450
14.56
0.94
212.10
1.0442
133.34
0.96
16,798.12
2002
2.0898
13.45
0.94
181.00
1.0331
101.70
0.96
9,064.24
2003
2.4910
12.04
0.90
145.10
1.0299
79.84
0.96
9,232.67
2004 2005
2.9191 3.4782
14.04 11.36
0.90 0.92
197.20 129.00
1.0499 1.0670
114.10 117.34
0.96 0.96
12,148.76 12,857.68
15
Holguín-Veras, Sánchez, González-Calderón, Sarmiento, and Thorson
TABLE 10 Results for Freight Distribution A) Panel models for freight distribution in tons (Parameter), Variable (β 0 ), Intercept
Exponential function Parameter t-value value -17.7260 -307.96
Power function Parameter t-value value -13.4457 -34.15
(β b), Dist, ln(Dist)
-0.0018
-27.03
-0.8724
-13.17
(α1 ), 2001
-0.2438
-3.56
-0.2445
-3.62
(α2 ), 2003
-0.3234
-4.58
-0.3301
-4.74
(α3 ), 2004
-0.4053
-5.79
-0.4082
-5.92
(α4 ), 2005
-0.6473
-0.6448
Time dependent ?
YES
-9.05 Adj. R²=0.160 F=163.72
-9.13 Adj. R²=0.141 F=134.89
YES
B) Panel models for freight distribution in loaded trips Exponential Function Parameter t-value value -15.231130 -352.060
Power Function Parameter t-value value -10.518240 -51.210
(β b) Dist, ln(Dist)
-0.001590
-21.080
-0.916097
-27.890
(β t ), t*Dist, t*ln(Dist)
-0.000167
-0.017806
Time dependent ?
YES
-9.180 Adj. R²=0.203 F=547.76
-9.230 Adj. R²=0.186 F=472.30
(Parameter), Variable (β 0 ), Intercept
YES
C) Cross sectional models for simple gravity model Year
Tons
Loaded trips
2000
Exponential (c) -0.00171
Power (b) -0.869
Exponential (c) -0.00178
Power (b) -0.922
2001
-0.00181
-0.851
-0.00178
-0.859
2002
-0.00158
-0.729
-0.00176
-0.837
2003
-0.00212
-0.984
-0.00229
-1.070
2004
-0.00185
-0.877
-0.00198
-0.936
2005
-0.00194
-0.926
-0.00243
-1.148
16
Holguín-Veras, Sánchez, González-Calderón, Sarmiento, and Thorson
TABLE 11 Results for Empty Trip (NVE) Model A) Panel model
B) Cross sectional model
Linear Model (Parameter), Variable Parameter t-value value (β b), Xij 0.407 70.522
Year
p
Adjusted R²
Percent of empty trips
2000
0.434
0.766
28.5%
(βt ), t*Xji
-0.003
-2.112
2001
0.355
0.632
28.4%
0.395
0.711
27.3%
Yes
Adjusted R²=0.711 F=9574.35
2002
Time dependent ?
2003
0.444
0.723
30.0%
2004
0.421
0.722
29.6%
2005
0.369
0.728
26.4%
Holguín-Veras, Sánchez, González-Calderón, Sarmiento, and Thorson
17
TABLE 12 shows that the most stable parameters are those for the empty trip model, with a rate of change of 0.83%. This to a great extent reflects the stability of the percent of empty trips in the area, as previous research has shown that the parameter of the Noortman and van Es’ model is linked to the percent of empty trips (11).
VIII.
CONCLUSIONS
This paper conducted an empirical investigation of the temporal stability of parameters of freight demand models (freight generation, freight distribution, and empty trip models) in the short-medium term using a panel formulation with time-dependent parameters and fixed time effects. The results indicate the presence of statistically significant time-dependent effects on freight generation (production and attraction), freight distribution, and empty trip models. The results indicate that the amount of cargo produced by a unit of GDP, and the amount of cargo attracted by a unit of population have increased overtime. This seems to indicate a lowering of the unit value of the cargo transported in Colombia, and an increase in the amount of goods consumed by the citizenry. This it to be expected as the years 1999-2000 were crisis years for the Colombian economy that were followed by a large economic rebound. The estimation of distribution models indicate that the models based on loaded trips exhibit larger time-dependent effects, than the ones estimated using tonnage. This could reflect the fact that it is easier to change loaded trip patterns—which are the outcome of logistic decisions—than to change the patterns of the tonnage distribution matrix, as this reflects the geography of production and consumption. The empty trip models were found to have the mildest time-dependent effects of all models considered. In all cases, the panel and cross-sectional models match well. The results show a remarkably consistent pattern in that the components of freight demand that could change faster (i.e., freight production and attraction) are the ones that exhibit the largest rates of parameter change. As shown, the rates of change for these models are 18.29% and 26.37% respectively. In contrast, the freight distribution models of loaded trips were found to change less rapidly (10.50% and 1.97% depending on the impedance function); while the tonnage distribution model only exhibited fixed time effects. The model that changes less rapidly is the empty trip model, with a rate of change of 0.83%. This research has provided evidence concerning the assumption of temporal parameter stability. The results have troubling practical implications as they conclusively point to time-dependent effects that cannot be captured by cross-sectional models, and that require the use of more sophisticated (and data consuming) panel models. On the bright side, the research shows that some of the time-dependent effects could be indeed be captured by the panel models; and that the magnitude of the time-dependent parameter changes conforms to expectations of which models would change faster. These results could open the door to either the use of more complete formulations based on panels, or to sensitivity analyses to increase the robustness of the analyses made. It is clear, however, that these contributions are only scratching the surface of an exceedingly complex and crucially important problem.
Holguín-Veras, Sánchez, González-Calderón, Sarmiento, and Thorson
18
IX.
REFERENCES
1.
Gunn, H., M. Ben-Akiva, and M. Bradley, Test of the Scaling Approach to Transfering Disaggregate Travel Demand Models. Transportation Research Record, 1985(1037): p. 2130. Ortúzar, J.D. and L.G. Willumsen, Modelling Transport. 3rd. ed. 2001, New York: John Wiley and Sons. Tretvik, T. and S. Widlert, The stability of parameter estimates in household-based structured logit models for travel-to-work decisions, in Travel behavior research: Updating the state of play. 1998. p. 457-472. McCarthy, P., Further evidence on the temporal stability of disaggregate travel demand models. Transport Research Part B: Methodological, 1982. 16B(4): p. 263-278. Universidad Nacional de Colombia Sede Medellin, Universidad del Norte, and Universidad Pedagogica Tecnologia de Colombia, Desarrollar y poner en funcionamiento modelos de demanda y oferta de transporte, que permitan proponer opciones en materia de infraestructura, para aumentar la competitividad de los productos Colombianos. 2008, Ministry of Transport. Departamento Administrativo Nacional de Estadistica (DANE), Population and GDP data by regions for Colombia. 2009. Kalmanovitz, S., Recesión y recuperación de la economía colombiana. Nueva sociedad, 2004(192): p. 98. Holguín-Veras, J. and G. Patil, Observed Trip Chain Behavior of Commercial Vehicles. Transportation Research Record, 2005. 1906: p. 74-80. U.S. Census Bureau, Vehicle Inventory and Use Survey. 2004. Strauss-Wieder, A., K. Kang, and M. Yokei. The Truck Commodity Survey in the New York-New Jersey Metropolitan Area. in Good Transportation in Urban Areas, Proceedings of the 5th Conference. 1989. Santa Barbara, CA. Holguín-Veras, J. and E. Thorson, Modeling Commercial Vehicle Empty Trips with a First Order Trip Chain Model. Transportation Research Part B: Methodological, 2003. 37(2): p. 129-148. Holguín-Veras, J. and E. Thorson, Practical implications of Modeling Commercial Vehicle Empty Trips. Transportation Research Record: Journal of the Transportation Research Board, 2003. 1833: p. 87-94. Holguín-Veras, J., E. Thorson, and J.C. Zorrilla, Commercial Vehicle Empty Trip Models with Variable Zero Order Empty Trip Probabilities. Networks and Spatial Economics, 2008. Hautzinger, H. The Prediction of Interregional Goods Vehicle Flows: Some Modeling Concepts. in Ninth International Symposium on Transportation and Traffic Flow Theory. 1984: VNU Science Press. Noortman, H.J. and J. van Es, Traffic Model. Manuscript for the Dutch Freight Transport Model. 1978.
2. 3.
4. 5.
6. 7. 8. 9. 10.
11.
12.
13.
14.
15.
Holguín-Veras, Sánchez, González-Calderón, Sarmiento, and Thorson
19
Holguín-Veras, Sánchez, González-Calderón, Sarmiento, and Thorson
LIST OF TABLES
TABLE 1 Summary Statistics for FODS 2004 (metric tons) TABLE 2 Freight Production Models TABLE 3 Results for Freight Attraction TABLE 4 Results for Freight Distribution TABLE 5 Results for Empty Trip (NVE) Model TABLE 6 Freight Models Parameter Stability
20
21
Holguín-Veras, Sánchez, González-Calderón, Sarmiento, and Thorson
TABLE 7 Summary Statistics for FODS 2004 (metric tons) A) Breakdown by industry group Sector Tons Agricultural 25,303,572 Manufacturing 63,535,369 Mining 22,359,719 Livestock 4,634,638 Other 1,764,043 Total 117,597,341 B) Trucking Capacity vs. Demand Truck Capacity (Tons) configuration 2 tons<