The ESMO algorithm for multiobjective structural optimization applications under seismic loading can be stated as follows: 1. Selection step: selection of si, (i = 1, ...
12 Multiobjective Optimization of Space Structures under Static and Seismic Loading Conditions Nikos D. Lagaros, Manolis Papadrakakis, and Vagelis Plevris
Summary. This chapter presents a evolution strategies approach for multiobjective design optimization of structural problems such as space frames and multi-layered space trusses under static and seismic loading conditions. A rigorous approach and a simplified one with respect to the loading condition are implemented for finding optimal design of a structure under multiple objectives.
12.1 Introduction In single-objective optimization problems the optimal solution is usually clearly defined, this does not hold in real-world problems having multiple and conflicting objectives. Instead of a single optimal solution, there is rather a set of alternative solutions, generally denoted as the set of Pareto-optimal solutions. These solutions are optimal in the wider sense that no other solution in the search space is superior to them when all objectives are considered. In the absence of preference information, none of the corresponding tradeoffs can be said to be better than the others. On the other hand, the search space can be too large and too complex, which, the usual case of real-world problems, to be solved by the conventional deterministic optimizers. Thus, efficient optimization strategies are required that are able to deal with the multiple objectives and the complexity of the search space. Evolutionary Algorithms (EAs) have several characteristics that are desirable for this kind of problems and most frequently outperform the deterministic optimizers. The application of EA in multiobjective optimization problems has received considerable attention in the last five years due to the difficulty of conventional optimization techniques, such as the gradient-based optimizers, to be extended to multi-objective optimization problems. For dealing with the multi-objective optimization problems there are some typical methods, such as linear weighting method, distance function method and constraint method. In treating such a problem using gradient based optimizers, we have to combine them with the typical methods. On the other hand, the structure of the EA
274
Lagaros et al.
optimizers have been recognized to be more appropriate to multiobjective optimization problems since early in their development [1]. EA optimizers employ multiple individuals that can search for multiple solutions in parallel. Using some modifications on the operators used by the EA optimizers the search process can be driven to a family of solutions representing the set of Pareto-optimal solutions. Structural sizing optimization at its early stages of development was mainly single-objective. The aim was to minimize the weight of the structure under certain restrictions imposed by design codes. Although some work has been published in the past dealing with multi-objective optimization [27] this was restricted to simple academic examples. Optimization of largescale structures, such as sizing optimization of multi-storey 3D frames and trusses is a computationally intensive task. The optimization problem becomes more intensive when dynamic loading is involved [8]. The feasible design space in structural optimization problems under dynamic constraints is often disconnected or disjoint [9, 10] which causes difficulties for many conventional optimizers. Due to the uncertain nature of the seismic loading, structural designs are often based on design response spectra of the region and on some simplified assumptions of the structural behavior under earthquakes. In the case of a direct consideration of the seismic loading the optimization of structural systems requires the solution of the dynamic equations of motion which can be orders of magnitude more computationally intensive than the case of static loading. In this work, both the rigorous approach and the simplified one with respect to the loading condition are implemented and their efficiency is compared in the framework of finding the optimum design of a structure under multiple objectives. In the context of the rigorous approach a number of artificial accelerograms are produced from the design response spectrum of the region for elastic structural response, which constitutes the multiple loading conditions under which the structures are optimally designed. The elastic design response spectrum can be seen as an envelope of response spectra, for a specific damping ratio, of different earthquakes most likely to occur in the region. This approach is compared with the approximate one based on simplifications adopted by the seismic codes. The Pareto sets obtained for a characteristic problem indicate the difference of the two Pareto sets obtained by the rigorous approach and the simplified one.
12.2 Single-objective Structural Optimization In sizing optimization problems the aim is to minimize a single-objective function, usually the weight of the structure, under certain behavioral constraints on stress and displacements. The design variables are most frequently chosen to be dimensions of the cross-sectional areas of the members of the structure. Due to fabrication limitations the design variables are not
12 Multi-Objective Structural Optimization under Seismic Loading
275
continuous but discrete since cross-sections belong to a certain set. A discrete structural optimization problem can be formulated in the following form: min f (s) subject to gj (s) ≤ 0 j = 1, . . . , k si ∈ Rd , i = 1, . . . , n
(12.1)
where Rd is a given set of discrete values and the design variables si (i = 1, . . . , n) can take values only from this set. In the optimal design of 3D frames and trusses the constraints are the member stresses and nodal displacements or inter-storey drifts. For rigid frames with I-shapes, the stress constraints, under allowable stress design requirements specified by Eurocode 3 [11] are expressed by the nondimensional ratio q of the following formulas q= and q=
fy fa fz + by + bz ≤ 1.0 σa σb σb
if
fy fz fa + by + bz ≤ 1.0 0.60 × σy σb σb
fa ≤ 0.15 σa if
fa > 0.15 σa
(12.2)
(12.3)
where fa is the computed compressive axial stress, fby , fbz are the computed bending stresses for y and z axis, respectively. σa is the allowable compressive axial stress, σby , σbz are the allowable bending stresses for y and z axis, respectively, and σy is the yield stress of the steel. The allowable inter-storey drift is limited to 1.5% of the height of each storey. Space truss structures usually have the topology of single or multi-layered flat or curved grids that can be easily constructed in practice. Most frequently the constraints are the member stresses, nodal displacements, or frequencies. The stress constraints can be written as |σ| ≤ |σa |, where σ is the maximum axial stress in each element group for all loading cases, σa = 0.60 × σy is the allowable axial stress and σy is the yield stress. Similarly, the displacement constraints can be written as |d| ≤ da , where da is the limiting value of the displacement at a certain node, or the maximum nodal displacement. Euler buckling occurs in truss structures when the magnitude of a member’s compressive stress is greater than a critical stress that, for the first buckling mode of a pin-connected member, is equal to Pb 1 π 2 EI (12.4) σb = =− A A L2 where Pb is the computed compressive axial force, I is the moment of inertia, L is the member length. Thus, the compressive stress should be less (in absolute values) than the critical Euler buckling stress |σ| ≤ |σb |. The values of the constraint functions are normalized in order to improve the performance of the optimization procedure as: σ/σa ≤ 1 for tension member σa = 0.60 × σy ,
2 σ/σb ≤ 1 for compression member σb = E π/(l/r) and d/da ≤ 1.
276
Lagaros et al.
The sizing optimization methodology with EA proceeds using the following steps: (1) At the outset of the optimization the geometry, the boundaries and the loads of the structure under investigation have to be defined. (2) The design variables, which may or may not be independent to each other, are also properly selected. Furthermore, the constraints are also defined in this stage in order to formulate the optimization problem as in (12.1). (3) A finite element analysis is then carried out and the displacements and stresses are evaluated. (4) The design variables are being optimized using the selection, crossover and mutation operators. If the convergence criteria for the optimization algorithm are satisfied, then the optimum solution has been found and the process is terminated, else the optimizer updates the design variable values and the whole process is repeated from Step (3).
12.3 Multiobjective Structural Optimization In practical applications of structural optimization of 3D frames and trusses the weight rarely gives a representative measure of the performance of the structure. In fact, several conflicting and incommensurable criteria usually exist in real-life design problems that have to be dealt simultaneously. This situation forces the engineer to look for a good compromise design between the conflicting requirements. These kinds of problems are called optimization problems with many objectives. The consideration of multiobjective optimization in its present sense originated towards the end of the last century when Pareto presented the optimality concept in economic problems with several competing criteria [12]. The first applications in the field of structural optimization with multiple objectives appeared at the end of the seventies [2-7]. Since then, although many techniques have been developed in order to deal with multiobjective optimization problems and a number of structural optimization problems have been dealt with multiobjectives, the corresponding applications were confined to mathematical functions or Pareto-structural optimization problems under only static loading conditions [13-21]. 12.3.1 Criteria and Conflict Any engineer who looks for the optimum design of a structure is faced with the question of which criteria are suitable for measuring the economy, the performance, the strength and the serviceability of a structure. Any quantity that, when changed, has a direct influence on the economy and/or the performance, the strength and the serviceability of the structure, can be considered as a criterion. On the other hand, those quantities that must only satisfy some imposed requirements are not criteria but they can be treated as constraints. Most of the commonly used design quantities have a criterion nature rather than a constraint nature because in the engineer’s mind these
12 Multi-Objective Structural Optimization under Seismic Loading
277
should take the minimum or maximum possible values. Most of the structural optimization problems are treated with a single objective, usually the weight of the structure, subjected to some strength constraints. These constraints are set as equality or inequality constraints using some upper and lower limits. Some times there is a difficulty in selecting these limits and these parameters are treated as criteria. One important basic property in the multi-criterion formulation is the conflict that may or may not exist between the criteria. Only those quantities that are competing should be treated as independent criteria whereas the others can be combined into a single criterion to represent the whole group. The concept of the conflict has deserved only a little attention in the literature while on the contrary the solution procedures have been studied to a great extent. According to the latter presentation the local conflict between two criteria can be defined as follows: The functions fi and fj are called locally collinear with no conflict at point s if there is c > 0 such that ∇fi (s) = c∇fj (s). Otherwise, the functions are called locally conflicting at s. According to the previous definition any two criteria are locally conflicting at a point of the design space if their maximum improvement is achieved in different directions. The global conflict between two criteria can be defined as follows: The functions fi and fj are called globally conflicting in the feasible region � of the design space when the two optimization problems mins∈ fi (s) and mins∈ fj (s) have different optimal solutions. 12.3.2 Formulation of a Multiple Objective Optimization Problem In formulating an optimization problem the choice of the design variables, criteria and constraints certainly represents the most important decision made by the engineer. The designs, which will be considered here, are fixed at this very early stage. In general the mathematical formulation of a multiobjective problem includes a set of n design variables, a set of m objective and a set of k constraint functions and can be defined as follows: [f1 (s), . . . , fm (s)]T mins∈ subject to gj (s) ≤ 0 j = 1, . . . , k si ∈ Rd , i = 1, . . . , n
(12.5)
where the vector s = [s1 , . . . , sn ]T represents a design variable vector and � is the feasible set in design space Rn . It is defined as the set of design variables that satisfy the constraint functions g(s) in the form: � = {s ∈ Rn |gj (s) ≤ 0} .
(12.6)
Usually there exists no unique point which would give an optimum for all m criteria simultaneously. Thus the common optimality concept used in scalar optimization must be replaced by a new one, the so-called Pareto optimum: A design vector s∗ ∈ � is Pareto optimal for the problem of Equation 12.5 if
278
Lagaros et al.
and only if there exists no other design vector s ∈ � such that fi (s) ≤ fi (s∗ ) for i = 1, . . . , m with fj (s) < fj (s∗ ) for at least one objective j. According to the above definition the design vector s∗ is considered as a Pareto-optimal solution if there is no other feasible design vector that improves at least one objective without worsening any other objective. The solution of optimization problems with multiple objectives is the set of the Pareto-optimal solutions. The problem of Equation 12.5 can be regarded, as being solved after the set of Pareto-optimal solutions has been determined. In practical applications, however, it is necessary to classify this set because the engineer wants a unique final solution. Thus a compromise should be made among the Pareto-optimal solutions. 12.3.3 Solving the Multiobjective Optimization Problem Typical methods for generating the Pareto-optimal set combine the objectives into a single, parameterized objective function by analogy to the decision making search step. However, the parameters of this function are not set by the decision making but systematically varied by the optimizer. Basically, this procedure is independent of the underlying optimization algorithm. Three previously used methods [ 4-7] are briefly discussed and are compared in this study in terms of computational time and efficiency with the proposed modified ES for treating multiobjective optimization problems. Linear Weighting Method The first method, called the linear weighting method, combines all the objectives into a single scalar parameterized objective function by using weighting coefficients. If wi , i = 1, . . . , m are the weighting coefficients, the problem of Equation 12.5 can be written as follows: min s∈
m �
wi fi (s)
(12.7)
i=1
with no loss of generality the following normalization of the weighting coefficients is employed: m � wi = 1 . (12.8) i=1
By varying these weights it is now possible to generate the set of Paretooptimal solutions for Equation 12.5. The weighting coefficients correspond to the preference of the engineer for each criteria. Every combination of those weighting coefficients correspond to a single Pareto-optimal solution, thus, performing a set of optimization processes using different weighting coefficients it is possible to generate the full set of Pareto-optimal solutions.
12 Multi-Objective Structural Optimization under Seismic Loading
279
In real-world problems there is not a common unit for the objectives leading to differences of some orders of magnitude between the values of the objectives. It is therefore suggested that the objectives should be normalized according to the following expression: fi (s) − fi,min f˜i (s) = fi,max − fi,min
(12.9)
where the normalized objectives f˜i (s) ∈ [0, 1], i = 1, . . . , m, use the same design space with the non-normalized ones, while fi,min and fi,max are the minimum and maximum values of the objective function i. Distance Function Method The distance methods are based on the minimization of the distance between the set of the objective function values and some chosen reference points belonging to the criterion space. Whereas criterion space is defined as the set of the objective function values that correspond to design vectors of the feasible domain. The resulting scalar problem is: min dp (s) s∈
(12.10)
where the distance function can be written as follows: dp (s) =
m #�
� �p $1/p wi fi (s) − zi
(12.11)
i=1
where p is an integer number. This technique has been widely used in structural optimization. The reference point z id ∈ Rm that is selected by the engineer is also called ideal or utopian point. A reference point that is frequently used is the following: �T � z id = fi,min , . . . , fm,min
(12.12)
where fi,min is the optimum solution of the single-objective optimization problem where the ith objective function is treated as the unique objective. The normalization function Equation 12.8 for the weighting factors wi is also used. In the case that p = ∞ Equation 12.10 is transformed to the minimax problem: � � min max wi fi (s) , i = 1, . . . , m . (12.13) s∈
i
In the case of p = 1 the formulation of the distance method is equivalent to the linear method when the reference point used is the zero zˆ = 0, while the case of p = 2 the method is called the weighted quadratic method.
280
Lagaros et al.
Constraint Method According to this method the original multi-criterion problem is replaced by a scalar problem where one criterion fk is chosen as the objective function and all the other criteria are removed into the constraints. By introducing parameters εi into these new constraints an additional feasible set is obtained: �k (εi ) = {s ∈ Rn |fi (s) ≤ εi , i = 1, . . . , m with i �= k} .
(12.14)
¯ k = � ∩ �k the parameterized If the resulting feasible set is denoted by � scalar problem can be expressed as: min fk (s) .
¯k s∈
(12.15)
The constraint method gives the opportunity to obtain the full domain of optimum solutions, in the horizontal or vertical direction using one criterion as the objective function and the other as the constraint. Modified Evolution Strategies for Multiobjective Optimization The three above-mentioned methods are the typical ones. The typical methods have been used in the past combined with mathematical programming optimization algorithms where one design point was examined at each optimization step as an optimum design candidate. In order to locate the set of pareto-optimal solutions a family of optimization runs have to be executed. On the other hand evolutionary algorithms instead of a single design point, they work simultaneously with a population of design points, which is a population of optimum design candidates, in the space of design variables. This characteristic has been proved very useful since it is easy to implement these methods in a parallel computing environment. Due to this characteristic, evolutionary algorithms have a great potential in finding multiple optima, in a single optimization run, which is very useful in Pareto optimization problems. Since the early 1990s many researchers have suggested the use of evolutionary algorithms in multiobjective optimization problems [22-26] an overview of all these methods can be found in Fonseca and Fleming [1] and Zitzler [27]. In our study the method of Evolution Strategies (ES) is used, and some changes have to been made in the random operators that are usually used in order to implement ES in multiobjective optimization problems and guide the convergence to a population that represent the set of Pareto-optimal solutions. The idea in those changes is (1) the selection of the parent population at each generation has to be changed in order to guide the search procedure towards the set of pareto optimum solutions, and (2) to prevent convergence to a single design point, and preserve diversity in the population in every generation step. The first demand can be fulfilled if the selection of the individual is chosen for reproduction potentially a different objective [22]. A random selection
12 Multi-Objective Structural Optimization under Seismic Loading
281
of the objective is implemented in this study. While in order to preserve diversity in the population and fulfill the second requirement, fitness sharing is implemented [28]. The idea behind sharing is to degrade those individuals that are represented in the higher percentage of the population. The modified objectives after sharing are the following: fi (s) � � h sh d(s, h)
fi� (s) = �
where the sharing function used in the current study is as follows: � � �a � � 1 − d(s,h) if d(s, h) < σshare σ share sh d(s, h) = 0 otherwise
(12.16)
(12.17)
The distance function used is in the objective space: d(s, h) = �f (s) − f (h)� .
(12.18)
12.4 Structural Design under Seismic Loading The equations of equilibrium for a finite element system in motion for the ith design vector, can be written in the usual form: ut + C(si )u˙ t + K(si )ut = Rt M (si )¨
(12.19)
where M (si ), C(si ) and K(si ) are the mass, damping and stiffness matrices for the ith design vector si ; Rt is the external load vector, while ut , u˙ t and u ¨t are the displacement, velocity, and acceleration vectors of the finite element assemblage, respectively. The solution methods of direct integration of equations of motion and of response spectrum modal analysis, which is based on the mode superposition approach, will be considered in the following paragraphs. The Newmark integration scheme is adopted in the present study to perform the direct time integration of the equations of motion where the equilibrium Equation 12.19 is considered at time t + ∆t M (si )¨ ut+∆t + C(si )u˙ t+∆t + K(si )ut+∆t = Rt+∆t
(12.20)
and the variation of velocity and displacement are given by ut + δ u ¨t+∆t ]∆t u˙ t+∆t = u˙ t + [(1 − δ)¨
(12.21)
1 ut + α¨ ut+∆t = ut + u˙ t ∆t + [( − α)¨ ut+∆t ]∆t2 (12.22) 2 where α and δ are parameters that can be determined to obtain integration accuracy and stability. Solving for u ¨t+∆t in terms of ut+∆t from Equation
282
Lagaros et al.
12.22 and then substituting for u ¨t+∆t in (12.21) we obtain equations for u ¨t+∆t and u˙ t+∆t each in terms of the unknown displacements ut+∆t only. These two relations for u ¨t+∆t and u˙ t+∆t are substituted into Equation 12.20 to solve for ut+∆t . As a result of this substitution the following well-known equilibrium equation is obtained at each ∆t eff . Keff (si )ut+∆t = Rt+∆t
(12.23)
12.4.1 Creation of Artificial Accelerograms The selection of the proper external loading Rt for design purposes is not an easy task due to the uncertainties involved in the seismic loading. For this reason a rigorous treatment of the seismic loading is to assume that the structure is subjected to a set of artificial earthquakes that are more likely to occur in the region where the structure is located. These seismic excitations are produced as a series of artificial accelerograms compatible with the elastic design response spectrum of the region. In this work the implementation published by Taylor [29] for the generation of statistically independent artificial acceleration time histories is adopted. This method is based on the fact that any periodic function can be expanded into a series of sinusoidal waves: � x(t) = Ak sin(ωk t + ϕk ) (12.24) k
where Ak is the amplitude, ωk is the cyclic frequency and φk is the phase angle of the kth contributing sinusoid. By fixing an array of amplitudes and then generating different arrays of phase angles, different motions can be generated which are similar in general appearance but different in the ’details’. The computer uses a random number generator subroutine to produce strings of phase angles with a uniform distribution in the range between 0 and 2π. The amplitudes Ak are related to the spectral density function in the following way: A2 G(ωk )∆ω = k (12.25) 2 where G(ωk )∆ω may be interpreted as the contribution to the total power of the motion from the sinusoid with frequency ωk . The power of the motion produced by Equation 12.24 does not vary with time. To simulate the transient character of real earthquakes, the steady-state motion is multiplied by a deterministic envelope function I(t): � Z(t) = I(t) Ak sin(ωk t + ϕk ) . (12.26) k
The resulting motion is stationary in frequency content with peak acceleration close to the target peak acceleration. In this study a trapezoidal
12 Multi-Objective Structural Optimization under Seismic Loading
283
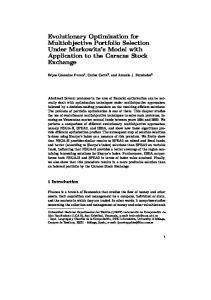
intensity envelope function is adopted. The generated peak acceleration is artificially modified to match the target peak acceleration, which corresponds to the chosen elastic design response spectrum. An iterative procedure is implemented to smooth the calculated spectrum and improve the matching [29]. Five artificial uncorrelated accelerograms, produced by the previously discussed procedure and shown in Figure 12.1, have been used as the input seismic excitation for the numerical tests. The elastic design response spectrum considered in the current study is depicted in Figure 12.2 for damping ratio ξ = 2.5%. The corresponding response spectrum of the first artificial accelerogram is also depicted in Figure 12.2.
Figure 12.1. The five artificial accelerograms
12.4.2 Response Spectrum Modal Analysis The response spectrum modal analysis is based on a simplification of the mode superposition approach with the aim to avoid time history analyses which are required by both the direct integration and mode superposition approaches. In the case of the response spectrum modal analysis, Equation 12.19 is modified according to the modal superposition approach, for the ith design vector, in the following form:
284
Lagaros et al.
Figure 12.2. Elastic design response spectrum of the region and response spectrum of the first artificial accelerogram (ξ = 2.5%).
¯ i )u˙ t + K(s ¯ i )ut = R ¯t ¯ (si )¨ ut + C(s M
(12.27)
¯ (si ) = ΦT Mi Φi M i
(12.28)
¯ i ) = ΦTi Ci Φi C(s
(12.29)
¯ i ) = ΦT Ki Φi K(s i
(12.30)
¯ t = ΦT Rt R i
(12.31)
where
are the generalized values of the corresponding matrices and the loading vector, while Φi is an eigenmode shape matrix to be defined later. For simplicity M (si ), C(si ), K(si ) are denoted by Mi , Ci , Ki , respectively. These matrices correspond to the design, which is defined by the ith vector of the design parameters, also called the design vector. According to the modal superposition approach the system of N simultaneous differential equations, is transformed to a set of N independent normal-coordinate equations. In the response spectrum modal analysis a number of different formulas have been proposed to obtain reasonable estimates of the maximum response based on the spectral values without performing time history analyses for a considerable number of transformed dynamic equations. The simplest and most popular of these is the square root of the sum of the squares (SRSS) of the modal responses. According to this estimate the maximum total displacement is approximated by % umax = u21,max + · · · + u2N,max (12.32)
12 Multi-Objective Structural Optimization under Seismic Loading
285
where uj,max corresponds to the maximum displacement calculated from the jth transformed dynamic equations over the complete time period. The use of Equation 12.32 permits this type of “dynamic” analysis by knowing only the maximum modal coordinates uj,max . The following steps summarize the response spectrum modal analysis adopted in this study and by a number of seismic codes around the world: 1. Calculate a number m� < N of eigenfrequencies and the corresponding eigenmode shape matrices, which are classified in the following order � � j j (ωi1 , . . . , ωim ), Φi = [φ1i , . . . , φm i ], respectively, where ωi , φi are the jth eigenfrequency-eigenmode corresponding to the ith design vector. m� is a user specified number, based on experience or on previous test analyses, which has to satisfy the requirement of Step 6. 2. Calculate the generalized masses, according to the following equation: T
m ¯ ji = φji Mi φji .
(12.33)
3. Calculate the coefficients Lji , according to the following equation: T
Lji = φji Mi r
(12.34)
where r is the influence vector, which represents the displacements of the masses resulting from static application of a unit, ground displacement. 4. Calculate the modal participation factor Γij , according to the following equation: Lj Γij = ij . (12.35) m ¯i 5. Calculate the effective modal mass for each design vector and for each eigenmode, by the following equation: mjeff,i =
Lji
2
m ¯ ji
.
(12.36)
6. Calculate a number m < m� of the important eigenmodes. According to Eurocode the minimum number of the eigenmodes that has to be taken into consideration is defined by the following assumption: The sum of the effective eigenmasses must not be less than 90% of the total vibrating mass mtot of the system, so the first m eigenmodes that satisfy the equation m �
mjeff,i ≥ 0.90mtot
(12.37)
j=1
are taken into consideration. 7. Calculate the values of the spectral acceleration Rd (Tj ) that correspond to each eigenperiod Tj of the important modes.
286
Lagaros et al.
8. Calculate the modal displacements according to equation (SD)j =
Rd (Tj ) × Tj2 Rd (Tj ) = . ωj2 4π 2
(12.38)
9. Calculate the modal displacements: uj,max = Γij × φji × (SD)j .
(12.39)
10. The total maximum displacement is calculated by superimposing the maximum modal displacements according to Equation 12.32.
12.5 Solution of the Optimization Problem The optimization problem is solved with evolution strategies. Evolution strategies were proposed for parameter optimization problems in the 1970s by Rechenberg [30] and Schwefel [31]. Similar to genetic algorithms, ES imitate biological evolution in nature and have three characteristics that make them different from other conventional optimization algorithms: (1) in place of the usual deterministic operators, they use randomized operators: mutation, selection as well as recombination; (2) instead of a single design point, they work simultaneously with a population of design points in the space of variables; (3) they can handle continuous, discrete, and mixed optimization problems. The second characteristic allows for a natural implementation of ES on parallel computing environments. The ES were initially applied for continuous optimization problems, but recently they have also been implemented in discrete and mixed optimization problems. 12.5.1 ES for Discrete Optimization Problems The multi-membered ES adopted in the current study, based on the discrete formulation, use three operators: recombination, mutation, and selection operators that can be included in the algorithm as follows: Step 1 (recombination and mutation) The population of µ parents at gth generation produces λ offsprings. The genotype of any descendant differs only slightly from that of its parents. For every offspring vector a temporary parent vector s˜ = [˜ s1 , . . . , s˜n ]T is first built by means of recombination. For discrete problems the following recombination cases can be used: ⎧ sα,i or sb,i randomly ⎪ ⎪ ⎪ ⎪ ⎨ sm,i or sb,i randomly s˜i = sbj,i (12.40) ⎪ ⎪ s or s randomly ⎪ α,i bj,i ⎪ ⎩ sm,i or sbj,i randomly
12 Multi-Objective Structural Optimization under Seismic Loading
287
where s˜i is the ith component of the temporary parent vector s˜, sα,i and sb,i are the ith components of the vectors sa and sb which are two parent vectors randomly chosen from the population. The vector sm is not randomly chosen but is the best of the µ parent vectors in the current generation. In case C of (12.40), s˜i = sbj,i means that the ith component of s˜ is chosen randomly from the ith components of all µ parent vectors. From the temporary parent s˜ an offspring can be created following the mutation operator. (g) Let as consider the temporary parent sp of the generation g that produces (g) an offspring so through the mutation operator as follows: so(g) = sp(g) + z (g) (g)
(12.41)
(g)
where z (g) = [z1 , . . . , zn ]T is a random vector. The mutation operator in the continuous version of ES produces a normally distributed random change vector z (g) . Each component of this vector has a small standard deviation value σi and zero mean value. As a result of this there is a possibility that all components of a parent vector may be changed, but usually the changes are small. In the discrete version of ES the random vector z (g) is properly generated in order to force the offspring vector to move to another set of discrete values. The fact that the difference between any two adjacent values can be relatively large is against the requirement that the variance σi2 should be small. For this reason it is suggested that not all the components of a parent vector, but only a few of them (e.g. k), should be randomly changed in every generation. This means that n − k components of the randomly changed vector z (g) will have a zero value. In other words, the terms of vector z (g) are derived from � (κ + 1)δsi for k randomly chosen components (g) (12.42) zi = 0 for n − k other components where δsi is the difference between two adjacent values in the discrete set and κ is a random integer number, which follows the Poisson distribution p(κ) =
(γ)κ −γ e γ!
(12.43)
where γ is the standard deviation as well as the mean value of the random (g) number κ. This shows how the random change zi is controlled by the parameter γ. The choice of k depends on the size of the problem and it is usually taken as 1/5 of the total number of design variables. The k components are selected using uniform random distribution in every generation according to Equation 12.42. Step 2 (selection) There are two different types of the multi-membered ES:
288
Lagaros et al.
• (µ + λ)-ES: The best µ individuals are selected from a temporary population of (µ+λ) individuals to form the parents of the next generation. • (µ, λ)-ES: The µ individuals produce λ offsprings (µ ≤ λ) and the selection process defines a new population of µ individuals from the set of λ offsprings only. In order to implement ES in Pareto optimization problems the selection operator is based on randomly chosen objectives. For discrete optimization the procedure terminates when the following termination criteria is satisfied: when the ratio µb /µ has reached a given value εd (=0.5 to 0.8) where µb is the number of the parent vectors in the current generation with the best objective function value. 12.5.2 ES in Multiobjective Structural Optimization Problems The application of EAs in multiobjective optimization problems has received a lot of attention in the last five years [21-28]due to the difficulty of conventional optimization techniques, such as gradient based methods, to be extended to multiobjective optimization problems. EAs, however, have been recognized to be more appropriate to multiobjective optimization problems since early in their development [1]. Multiple individuals can search for multiple solutions in parallel, taking advantage of any similarities available in the family of possible solutions to the problem. In the first implementation where the typical methods are used, the optimization procedure, in order to generate a set of Pareto-optimal solutions, initiates with a set of parent design vectors needed by the ES optimizer and a set of weighting coefficients for the combination of all objectives into a single scalar parameterized objective function. These weighting coefficients are not set by the engineer but are being systematically varied by the optimizer after a Pareto-optimal solution has been achieved. There is an outer loop which systematically varies the parameters of the parameterized objective function, and is called the decision making loop. The inner loop is the classical ES process, starting with a set of parent vectors. If any of these parent vectors gives an infeasible design then this parent vector is modified until it becomes feasible. Subsequently, the offsprings are generated and checked if they are in the feasible region. The number of parents and offsprings involved affects the computational efficiency of the multi-membered ES discussed in this work. It has been observed that values of µ and λ equal to the number of the design variables produce better results. The ES algorithm when combined with the typical methods for multiobjective structural optimization applications under seismic loading can be stated as follows: Outer loop - Decision making loop Set the parameters wi of the parameterized objective function Inner loop - ES loop
12 Multi-Objective Structural Optimization under Seismic Loading
289
1. Selection step: selection of si , (i = 1, 2 . . . , µ) parent vectors of the design variables 2. Analysis step: solve M (si )¨ u + C(si )u˙ + K(si )u = Rt , (i = 1, . . . , µ) 3. Evaluation of parameterized objective function 4. Constraints check: all parent vectors become feasible 5. Offspring generation: generate sj , (j = 1, . . . , λ) offspring vectors of the design variables 6. Analysis step: solve M (sj )¨ u + C(sj )u˙ + K(sj )u = Rt , (j = 1, . . . , λ) 7. Evaluation of the parameterized objective function 8. Constraints check: if satisfied continue, else change sj and go to step 5 9. Selection step: selection of the next generation parents according to (µ+λ) or (µ, λ) selection schemes 10. Convergence check: If satisfied stop, else go to step 5 End of Inner loop End of Outer loop In the second implementation the special characteristic of the EA optimizers are used. The ESMO algorithm for multiobjective structural optimization applications under seismic loading can be stated as follows: 1. Selection step: selection of si , (i = 1, 2 . . . , µ) parent vectors of the design variables 2. Analysis step: solve M (si )¨ u + C(si )u˙ + K(si )u = Rt , (i = 1, . . . , µ) 3. Evaluation of parameterized objective function 4. Constraints check: all parent vectors become feasible 5. Offspring generation: generate sj , (j = 1, . . . , λ) offspring vectors of the design variables 6. Analysis step: solve M (sj )¨ u + C(sj )u˙ + K(sj )u = Rt , (j = 1, . . . , λ) 7. Evaluation of the parameterized objective function 8. Constraints check: if satisfied continue, else change sj and go to step 5 9. Selection step: random selection of the potential objective for each individual and selection of the next generation parents according to (µ+λ) or (µ, λ) selection scheme 10. Fitness sharing 11. Convergence check: If satisfied stop, else go to step 5
12.6 Numerical Results Three benchmark test examples, one six-storey space frame and one multilayered space truss, are investigated. The following abbreviations are used in this section: DTI refers to the Newmark Direct time Integration Method; RSMA refers to the Response Spectrum Modal Analysis; LWM refers to the Linear Weighting Method; DFM refers to the Distance Function Method; CM
290
Lagaros et al.
refers to the Constraint Method and ESMO refers to the proposed Evolution Strategies for treating Multiobjective Optimization problems.
Figure 12.3. I-shape cross section.
12.6.1 Six-storey Space Frame The modulus of elasticity is 200 GPa and the yield stress is σy = 250 MPa. The cross section of each member is assumed to be an I-shape and for each member two design variables are considered, as shown in Figure 12.3. The objective functions considered for the problems are the weight of the structure, the maximum displacement and the first eigen period. The first two objective functions have to be minimized while the third one has to be maximized. The constraints are imposed on the inter-storey drifts and on the maximum nondimensional ratio q of Equations 12.2 and 12.3 for each element group under a combination of axial force and bending moments. The values of allowable axial and bending stresses are Fa = 150 MPa and Fb = 165 MPa, respectively, whereas the maximum allowable inter-storey drift is limited to 4.5 cm which corresponds to 1.5% of the height of each storey. The test example was run on a Silicon Graphics Power Challenge computer. The space frame consists of 63 elements with 180 degrees of freedom as shown in Figure 12.4. The beams have length L1 = 7.32m and the columns L2 = 3.66m. The structure is loaded with a 19.16 kPa gravity load on all floor levels and a static lateral load of 109 kN applied at each node in the front elevation along the z direction. The element members are divided into 5 groups, each one having two design variables resulting in ten total design variables. The Pareto-optimal set of solutions was first computed with the LWM. The performance of this method for the case of seeking the simultaneous minimization of weight and maximum displacement is depicted in Figures 12.5 and 12.6 for both static and seismic loading conditions. In Figures 12.5 and 12.6 the performance of the DFM and ESMO methods are also presented.
12 Multi-Objective Structural Optimization under Seismic Loading
291
Figure 12.4. Six-storey space frame.
Figure 12.5. Six-storey frame: Linear (p = 1), Distance method and ESMO (both static and seismic loading conditions) using LVM.
For the case of the DFM the zero (0) point was considered as the utopian point, while three different schemes of the DFM were also examined, p = 1: equivalent to the LWM, p = 2: called quadratic LWM and p = 8: equivalent to the p = ∞. The case when the weight and the first eigenperiod are considered as the objectives of the problem is depicted in Figure 12.9. The CM is implemented with the following variations: (1) The weight as the only criterion and the maximum displacement or the first eigenperiod as constraint; and (2) the maximum displacement or the first eigenperiod
292
Lagaros et al.
Figure 12.6. Six-storey frame: Linear (p = 1), Distance method and ESMO (both static and seismic loading conditions)using LVM.
Figure 12.7. Six-storey frame: Linear (p = 1) and Constraint method (both static and seismic loading conditions) using CM.
12 Multi-Objective Structural Optimization under Seismic Loading
293
as the only criterion and the weight as constraint. In Figures 12.7 and 12.8 we can see the performance of the CM, for the simultaneous minimization of weight and maximum displacement. These sets of Pareto optimal solutions are produced for the following cases: (1) different upper limits for the maximum displacement, and (2) different upper limits of the weight of the structure. In Figure 12.10 we can see the performance of the CM, for the simultaneous minimization of weight and the first eigenperiod and for the cases: (1) with different upper limits for the first eigenperiod, and (2) for different upper limits of the weight of the structure.
Figure 12.8. Six-storey frame: Linear (p = 1) and Constraint method (both static and seismic loading conditions)using CM.
It can also be seen from Figures 12.6 and 12.8 that the Pareto optimal solutions achieved by the direct time integration approach under the multiple loading conditions of the five artificial accelerograms given in Figures 12.6 and 12.8 is less than the corresponding design given by the response spectrum modal analysis. In figures 12.5, 12.6 and in 12.9, 12.10 we can see that there is little difference in the performance of the typical methods and the ESMO method, while as can be seen from Table 12.1 there is a difference in the computing time.
294
Lagaros et al.
Figure 12.9. Six-storey frame: Linear (p = 1), Distance method and ESMO method.
Figure 12.10. Six-storey frame: Linear (p = 1), Constraint method and ESMO method
12 Multi-Objective Structural Optimization under Seismic Loading
295
Table 12.1. Example 1 - Time required by classical and EA methods for dealing with multiobjectives for dynamic loading conditions. Method p = 1 DTI ESMO DTI p = 1 RSMA ESMO RSMA
Time (sec) Generations FE analyses 254,112 35,788 109,803 15,171
372 28 411 31
2,609 367 2,901 401
12.6.2 Multi-layered Space Truss The optimum design with multiple objectives of a long span aircraft hangar is investigated. The objective functions considered for the problems are the weight of the structure and the maximum deflection, both of which are to be minimized. The members of the space truss were grouped as follows: Group 1: Longitudinal members of the top and bottom flanges. Group 2: Cross girders of the top and bottom flanges. Group 3: Bracing diagonals connecting top and bottom flanges to top and bottom chords of the space frame. Group 4: Top and bottom chords of the space frame. Group 5: Diagonal bracing members connecting top and bottom chords of space frame to middle chords. Group 6: Middle chords of the space frame. The hangar comprises 3,614 nodes (10,638 d.o.f.) and 12,974 members. Members of group 1 to 3 are to be selected from the structural sections listed in Table 12.2 and members of groups 4 to 6 from the tube sizes given in Table 12.3. Taking advantage of the symmetry of the structure, the formulation of the problem was made only for one half of the hangar which results in a model with 5,269 d.o.f. (see Figure 12.11). A constraint of 750 mm on the maximum deflection was imposed in addition to the stress constraints. The performance of the LWM for the case of the simultaneous minimization of weight and maximum displacement is depicted in Figure 12.12. In Figure 12.12 the DFM with p = 1, 2 and 8 and ESMO methods are also presented. For this test example two cases are considered: (1) The weight as the only criterion and the maximum displacement as constraint; and (2) The maximum displacement as the only criterion and the weight as constraint. Figure 12.13 depicts the performance of the CM, for the simultaneous minimization of weight and maximum displacement. These sets of Pareto-optimal solutions, are produced for different upper limits for the maximum displacement and for different upper limits of the weight of the structure. In Figures 12.12 and 12.13 we can see that there is little difference in the performance of the typical methods and the ESMO method, while as can be seen from Table 12.4 there is significant difference in the computing time.
296
Lagaros et al.
Figure 12.11. Multi-layered space truss.
Figure 12.12. Multi-layered space truss: Linear, Distance and ESMO method.
12 Multi-Objective Structural Optimization under Seismic Loading Table 12.2. Properties of the structural members (Database 1). Area (mm2 )
Section number
Type
1 2 3 4 5 6 7 8 9 10 11 12 13 14 15 16 17 18 19 20 21 22 23 24 25 26 27
ISMC 100 2 x ISMC 75 2 x ISMC 100 2 x ISMC 125 2 x ISMC 150 2 x ISMC 175 2 x ISMC 200 2 x ISMC 225 2 x ISMC 250 2 x ISMC 300 2 x ISMC 350 2 x ISMC 400 2 x ISMC 400 with 2 x 8mm thick MS Plates 2 x ISMC 400 with 2 x 12mm thick MS Plates 2 x ISMC 400 with 2 x 16mm thick MS Plates 2 x ISMC 400 with 2 x 25mm thick MS Plates 4 x ISMC 400 4 x ISMC 400 with 2 x 8mm thick MS Plates 4 x ISMC 400 with 2 x 16mm thick MS Plates 4 x ISMC 400 with 2 x 20mm thick MS Plates 4 x ISMC 400 with 2 x 25mm thick MS Plates 4 x ISMC 400 with 2 x 32mm thick MS Plates 4 x ISMC 400 with 4 x 20mm thick MS Plates 4 x ISMC 400 with 4 x 25mm thick MS Plates 4 x ISMC 400 with 4 x 32mm thick MS Plates 4 x ISMC 400 with 4 x 40mm thick MS Plates 4 x ISMC 400 with 4 x 50mm thick MS Plates
1170 1740 2340 3238 4176 4878 5642 6802 7734 9128 10732 12585 14986 16186 17386 20086 25172 30772 36372 39172 42672 47572 51172 57672 66772 77172 90172
Table 12.3. Properties of the structural members (Database 2). Section number Outer diameter Thickness Area (mm2 ) 1 2 3 4 5 6 7 8 9 10
60.30 76.10 88.90 114.30 139.70 152.40 165.10 193.70 219.10 273.00
3.25 4.50 4.85 5.40 5.40 5.40 5.40 5.90 5.90 5.90
582.73 1012.63 1281.16 1848.19 2279.26 2494.80 2710.34 3482.35 3953.34 4952.80
297
298
Lagaros et al.
Figure 12.13. Multi-layered space truss: Linear, Distance and ESMO method. Table 12.4. Example 2 – Time required by classical and EA methods for dealing with multi-objectives Method Time (sec) Generations FE analyses p=1 ESMO
7.917 2.119
195 28
1.163 312
12.7 Conclusions Evolution strategies can be considered as an efficient tool for multiobjective design optimization of structural problems such as space frames and multilayered space trusses under static and seismic loading conditions. The LWM and CM methods compared to the ESMO method appear to be robust and reliable for treating multiobjective structural optimization problems giving almost identical results. A generalization of the LWM for p > 1 called the CM is also examined in this study. The results obtained by the DFM were somewhat different than those taken by the other two methods, while for large values of p it produces either too close or disperse points in the Pareto sets. In terms of computational efficiency it appears that all three typical methods considered require similar computational effort, with approximately the same number of generation steps. On the other hand the ESMO method requires one order of magnitude less computing time than the typical methods.
12 Multi-Objective Structural Optimization under Seismic Loading
299
The presented results indicate that it is possible to achieve an optimal design under seismic loading. Both design methodologies based on a number of artificially generated earthquakes and the response spectrum modal analysis adopted by the seismic codes have been implemented and compared. The more rigorous dynamic approach based on time history analyses gives more economic designs than the approximate response spectrum modal analysis, at the expense of requiring more computational effort.
References 1. Fonseca, CM, and Fleming, PJ, An Overview of Evolutionary Algorithms in Multiobjective Optimization, Evolutionary Computations, 1995; 3: 1-16. 2. Stadler, W, Natural Structural Shapes of Shallow Arches, Journal of Applied Mechanics, 1977; 44: 291-298. 3. Leitmann, G, Some Problems of Scalar and Vector-valued Optimization in Linear Viscoelasticity, Journal of Optimization Theory and Applications, 1977; 23: 93-99. 4. Stadler, W, Natural Structural Shapes (The Static Case), Quarterly Journal of Mechanics and Applied Mathematics, 1978; 31: 169-217. 5. Gerasimov, EN, and Repko, VN, Multi-criteria Optimization, Soviet Applied Mechanics, 1978; 14: 1179-1184. 6. Koski, J, Truss Optimization with Vector Criterion, Publication No. 6, Tampere University of Technology, 1979. 7. Cohon, JL, Multi-objective Programming and Planning, New York, Academic Press, 1978. 8. Papadrakakis, M, Lagaros, ND, and Plevris, V, Optimum Design of Space Frames Under Seismic Loading, International Journal of Structural Stability and Dynamics, 2001; 1: 105-124. 9. Cassis, JH, Optimum Design of Structures Subjected to Dynamic Loads, PhD Thesis, University of California, Los Angeles, 1974. 10. Johnson, EH, Disjoint Design Spaces in Optimization of Harmonically Excited Structures, AIAA Journal, 1976; 14: 259-261. 11. Eurocode 3, Design of Steel Structures, Part1.1: General Rules for Buildings, CEN, ENV 1993-1-1/1992. 12. Pareto, V, Cours d’economique Politique, vol. 1&2, Lausanne, Rouge, 1897. 13. Adali, S, Pareto Optimal Design of Beams Subjected to Support Motion, Computers and Structures, 1983; 16: 297-303. 14. Baier, H, Structural Optimization in Industrial Environment, In H Eschenauer and N Olhoff (eds.) Optimization Methods in Structural Design, Proceedings of the Euromech-Colloquium 164, University of Siegen, Bibliographisches Institut A6, Zurich, pp. 140-145, 1983. 15. Diaz, A, Sensitivity Information in Multiobjective Optimization, Engineering Optimization, 1987; 12:281-297. 16. Hajela, P, and Shih, CJ, Multi-objective Optimum Design in Mixed Integer and Discrete Design Variable Problems, AIAA Journal, 1990; 28: 670-675. 17. Rozvany, GIN Structural Design via Optimality Criteria, Dordecht, Kluwer, 1989.
300
Lagaros et al.
18. Goicoechea, A, Hansen DR, and Duckstein L, Multi-objective Decision Analysis with Engineering and Business Applications, New York, Wiley, 1982. 19. Koski, J, Bicriterion Optimum Design Method for Elastic Trusses, Acta Polytechnica Scandinavica, Mechanical engineering series No 86, Dissertation, Helsinki, 1984. 20. Sandgren, E, Multicriteria Design Optimization by Goal Programming, In H Adeli (ed.) Advances in Design Optimization, Chapman & Hall, pp. 225-265, 1994. 21. Kamal, CS, and Adeli, H, Fuzzy Discrete Multicriteria Cost Optimization of Steel Structures, Journal of Structural Engineering, 2000; 126: 1339-1347. 22. Schaffer, JD. Multiple Objective Optimization with Vector Evaluated Genetic Algorithms, PhD thesis, Vanderbilt University, 1984. 23. Fonseca, CM, and Fleming, PJ, Genetic Algorithms for Multiobjective Optimization: Formulation, Discussion and Generalization, In S Forrest S (ed.) Proceedings of the 5th International Conference on Genetic Algorithms, San Mateo, California, Morgan Kaufmann, pp. 416-423, 1993. 24. Horn, J, Nafpliotis, N, and Goldberg, DE, A Niched Pareto Genetic Algorithm for Multiobjective Optimization, In Proceedings of the 1st IEEE Conference on Evolutionary Computation, IEEE World Congress on Evolutionary Computation, Volume 1, Piscataway, NJ, pp. 82-87, 1994. 25. Deb, K, and Goldberg, DE, An Investigation of Niche and Species Formation in Genetic Function Optimization, In JD Schaffer (ed.) Proceedings of the 3rd International Conference on Genetic Algorithms, San Mateo, California, Morgan Kaufmann, pp. 42-50, 1989. 26. Hajela, P, and Lin, CY, Genetic Search Strategies in Multicriterion Optimal Design, Structural Optimization, 1992; 4: 99-107. 27. Zitzler, E, Evolutionary Algorithms for Multiobjective Optimization: Methods and Applications, PhD thesis, Swiss Federal Institute of Technology Zurich, Computer Engineering and Networks Laboratory, 1999. 28. Goldberg, DE, and Richardson, J, Genetic Algorithms with Sharing for Multimodal Function Optimization, In JJ Grefenstette (ed) Genetic Algorithms and Their Applications, Proceedings of the 2nd International Conference on Genetic Algorithms, Hillsdale, NJ, Lawrence Erlbaum, pp. 41-49, 1987. 29. Taylor, CA, EQSIM, A Program for Generating Spectrum Compatible Earthquake Ground Acceleration Time Histories, Reference Manual, Bristol Earthquake Engineering Data Acquisition and Processing System, December, 1989. 30. Rechenberg, I, Evolution Strategy: Optimization of Technical Systems According to the Principles of Biological Evolution, Stuttgart, FrommannHolzboog, 1973. 31. Schwefel, HP, Numerical Optimization for Computer Models, Chi Chester, UK, Wiley & Sons, 1981.