1985, Steuer 1986, Tabucanon 1988, Yu 1985, Ze- .... bined function is Pareto optimal (Steuer 1986). ... is to divide the each objective function by its maximum.
Proceedings of the 2002 Winter Simulation Conference E. Yücesan, C.-H. Chen, J. L. Snowdon, and J. M. Charnes, eds.
SIMULATION BASED MULTIOBJECTIVE SCHEDULE OPTIMIZATION IN SEMICONDUCTOR MANUFACTURING
Amit K. Gupta Appa Iyer Sivakumar School of Mechanical and Production Engineering Nanyang Technological University Nanyang Avenue 639798, SINGAPORE
cation and wafer sort are usually known as the front-end and the IC assembly and testing are known as the back-end. As these back-end equipment are very highly capital intensive in nature, their effective utilization is very crucial for the factory performance. Also, the efficient scheduling of these test operations play an important role in the on-time delivery of the products and thus on the customer satisfaction.
ABSTRACT In semiconductor manufacturing, it requires more than one objective such as cycle time, machine utilization and due date accuracy to be kept in focus simultaneously, while developing an effective scheduling. In this paper, a near optimal solution, which is not inferior to any other feasible solutions in terms of all objectives, is generated with a combination of the analytically optimal and simulation based scheduling approach. First, the job shop scheduling problem is modeled using the discrete event simulation approach and the problem is divided in to simulation clock based lot selection sub-problems. Then, at each decision instant in simulated time, a Pareto optimal lot is selected using the various techniques to deal with multiobjective optimization such as weighted aggregation approach, global criterion method, minimum deviation method, and compromise programming. An illustration shows how these techniques work effectively in solving the multiobjective scheduling problem using discrete event simulation. 1
Wafer fabrication
Wafer sort
Pack and Ship Final test
Assembly cycle
Figure 1: IC Manufacturing Process Flow The focus of this paper is on the optimization of multiobjective scheduling of these test operations based on discrete event simulation. The paper is organized as follows: Section 2 describes the simulation based scheduling and its applications; Section 3 formulates the scheduling problem in semiconductor back-end, using discrete event simulation; Section 4 briefs about Pareto optimal solution in multiobjective optimization; Section 5 describes various approaches, with their merits and limitations, to deal with multiobjective optimization; Section 6 formulates the multiple objectives in semiconductor manufacturing; Section 7 describes this application by an illustrative example of a typical situation; Section 8 discusses the impact of the proposed techniques; and Section 9 concludes the paper with future work.
INTRODUCTION
In semiconductor industry, the primary challenge is to maximize the throughput of the facility while responding rapidly to customer demands through low cycle times. This is also important in order to face the response of a highly dynamic market characterized by rapidly changing demands and product mixes with sometimes very brief product life cycles. The need for higher utilization is created by the capital-intensive nature of the constraint equipments such as testers. Therefore the effective scheduling of the semiconductor back-end is one of the key aspects in achieving these improvements. There are four main stages in a typical IC manufacturing process: wafer fabrication, wafer sort, assembly cycle and final test. The flow between these processing stages is illustrated in Figure 1. Among these stages, the wafer fabri-
2
SIMULATION BASED SCHEDULING
In recent developments, simulation is not just a tool to mimic the real-world system for analyzing it, but it has become a popular technique for developing production schedules and dispatch lists in manufacturing environments
1862
Gupta and Sivakumar work, the shop floor scheduling system was integrated with the fab MES and a number of other data sources including an integrated machine standards database, preventive maintenance scheduling and a Kanban stage calculation worksheet. Also, the simulation was used to verify Sony production rules and determine the most effective Kanban strategy for the fab.
(Mazziotti and Horne 1997, Morito and Lee 1997, Sivakumar 1999). An important aspect of simulation-based scheduling is that it uses actual customer orders and WIP information, and not arrival/demand data estimated from statistical distributions. Thus, keeping update with the real information, simulation offers the advantage of developing a feasible and accurate schedule in shorter computation times compared to some of the other techniques (Kiran 1998, Mazziotti and Horne 1997), even for the job shop scheduling problems which are considered as NP-hard (Pinedo, 1995). Davis (1998) and Sivakumar (2001) report the application of online simulation in complex manufacturing scheduling. In online simulation, one of the major advantage is that the simulator mimics the behavior of the actual system in an intuitive manner that enables the users to understand the logic of manufacturing systems (Hopp and Spearman, 1996). Further, the simulation based scheduling also serve as a tool for handling exceptions in the production plan, such as machine break-down, hot lots, etc., by generating the “what now” scenarios. However, the simulation based scheduling differs from the typical simulation studies in scope of application, approach of modeling, conduct of experimentation and analysis of output as reported by Koh et al. (1996). Table 1 describes the summary of differences between the typical simulation studies and the simulation based scheduling of a shop.
3
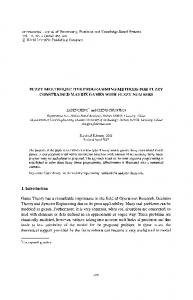
The scheduling problem in semiconductor manufacturing is considered as one of the complex job shop scheduling problems, which are generally formulated by conventional approaches like Branch and Bound method, Lagrangian relaxation approach or other optimization methods using Tabu search, Simulated annealing, Genetic algorithm etc (Kiran 1998, Pinedo 1995). But, these conventional search and optimization methods are generally intensive in computation time as even the simple manufacturing scheduling problems are NP-hard. The complexity of scheduling problem increases more in semiconductor manufacturing because of 1) the presence of different types of work-centers, 2) very large and changing varieties of the products, 3) sequence dependent set-up times, 4) re-entrant process flow, 5) dynamic nature of the problem, and 6) contradicting multiple objective functions, etc. In modeling the scheduling problem of semiconductor manufacturing, the use of discrete event simulation method helps in overcoming many of the limitations of the conventional approaches (Sivakumar 2001). The most distinguished advantage of this method is that it avoids even formulating an NP-hard optimization problem and thus provides the optimum solution at that instant within a limited time. The operations are simulated on jobs using defined resources in discrete time. Figure 2 illustrates this concept (Sivakumar 2001).
Table 1: Summary of Differences Typical simulation Simulation based studies scheduling Scope Model Experiment
Output
Design and analysis. Stochastic model (random processes). Extensive multiple runs for statistical variance according to the design of experiment. Statistical estimates of effects of various factors.
PROBLEM FORMULATION
Operational planning. Deterministic flexible model. Fewer shorter runs, experimenting different scheduling rules (or strategies).
Running lots @ 8:00 PM
Operational plan with system performance parameters.
Machine Machine 3
The application of simulation based scheduling at a semiconductor wafer fabrication of AMD Inc., using real time dispatch (RTD) tool from AutoSimulation Inc. has been reported by Rippenhagen and Krishnaswamy (1998). They implemented the combination of Hunger Ratio and Critical Ratio as dispatching rules, in prior which were analyzed in an off-line mode using simulation modeling. Rules deemed beneficial via simulation were then transferred to the Manufacturing Execution Systems (MES) for controlling the order of processing, in order to avoid the starvation of possibly reoccurring bottleneck equipment. Another similar type of application at Sony semiconductor wafer fabrication, using AutoSched package from AutoSimulation Inc. is reported by Watt (1998). In this
m
New job arrivals Job 34567 Op. step 1 Job 18 Op step 4
Machine 2
Preventive maintenance
Unload
Unload
Setup
Load
Job 169 step 2 Setup bc
Process engineering development (PE) Selection of optimal job at this simulated instance k : Problem is decomposed that it is no longer NP hard
Job 15, operation step 3
Machine 1
Scheduling process
Time now
20:00
21:00 Simulated Time
22:00
Simulated Time k
23:00
00:00
Figure 2: Simulation Based Scheduling For example, in simulation, each machine selects its activity and operation in future time and as a result, all jobs available at that instance can be considered and all activities such as PM and sequence dependant setups can be scheduled. In this formulation, machine m at simulated
1863
Gupta and Sivakumar exist any x ∈ S such that f j ( x) ≤ f j ( x*) for all j and f j ( x) < f j ( x*) for at least one j. Suppose that there are two objective functions, ƒ¹(x), and ƒ²(x), where x ∈ X . A single objective problem can be formulated as Z ∆( f 1 ( x), f 2 ( x)) . We can calculate Z¹,
time k has access to all the work in process (WIP) expected to be in the queue at time k, including those that would have arrived after the start of the simulation. Thus, the overall NP-hard scheduling problem gets reduced to the selection of a suitable lot on machine m at simulation instant k, which no longer remains a NP-hard problem. In other words, the issue of NP-hardness gets resolved when the overall scheduling problem is decomposed in to the sub-problems of lot selection for each local work center at each decision instance, using the deterministic discrete event simulation method. At every decision instant in simulated time, the resources, jobs (lots), and supporting information are considered by taking a snap shot of the shop floor and support systems prior to each scheduling run (Sivakumar 2001). The near term scheduling is achieved by considering the system progress in a deterministic manner up to the next stochastic event or the elapse of a predetermined time. In this paper, our focus is on the selection of a suitable lot on machine m at decision instant k in simulation clock, keeping the interest on the demand of multiple contradicting objectives. 4
where Z¹∆ (ƒ¹(x¹), ƒ²(x¹)), for a point x
1
∈ X , and the
value of Z¹ can be plotted on the Cartesian coordinates as shown in Figure 3. Suppose our goal is to minimize both ƒ¹ and ƒ². Point Z¹ resulting from x¹ is certainly not the choice as point Z² is better than point Z¹ in terms of both ƒ¹ and ƒ².
ƒ¹
.
Z¹
.
Z² • Zº
ƒ²
PARETO OPTIMAL SOLUTION
Figure 3: Pareto Optimization The subject of multiobjective optimization is widely researched and published (Goicoechea et al. 1982, Sawaragi et al. 1985, Steuer 1986, Tabucanon 1988, Yu 1985, Zeleny 1982). A multiobjective optimization problem can be denoted as:
Pareto Optimal or efficient solutions are defined as the boundary line of solutions that are better solutions than the others in the operating region. An operating solution x 0 ∈ X is a Pareto optimal or efficient solution if no other operating point x ∈ X exists such that f ( x ) ≤ f ( x 0 ) and this implies that we will not find another operating solution xª such that f 1 ( x a ) ≤ f 1 ( x 0 ) and f 2 ( x a ) ≤ f 2 ( x 0 ) . In this example, point Zº can be considered as a Pareto optimal point since there are no solution in the shaded area. In general, real life problems have more than two objective functions, usually with tradeoff between these. The primary objective of our research is therefore to identify solutions that are always on the Pareto optimal boundary and use various approaches on conflicting objectives to locate the desired solutions at every job selection event in simulated horizon.
Min f ( x)∆( f 1 ( x), f 2 ( x),...., f P ( x)), for x ∈ X , where each f j(x), j =1…P, is a scalar objective function. An optimal solution in the classic sense is one which attains the minimum value of all the objectives simultaneously. The solution x* is optimal to the problem defined if and only if x* ∈ S and
f j ( x*) ≤ f j ( x) for all j and for all x ∈ S ,
5
where S is the feasible region. In general, there may not be an particular optimal solution to a multiobjective problem, as one objective function gains only at the deterioration of the other objectives, due to their conflicting nature. In other words, optimality is an illusion when the objectives are conflicting. Therefore, one must be satisfied with obtaining the Pareto optimal solutions. A Pareto optimal solution is one in which no decrease can be obtained in any of the objectives without causing a simultaneous increase in at least one of the other objectives. A Pareto optimal solution is also called as efficient, non-dominated, or noninferior solution (Tabucanon 1988). The solution x* is efficient to the problem defined if and only if there does not
APPROACHES FOR MULTIOBJECTIVE OPTIMIZATION
The multiobjective optimization problems are generally solved by combining the multiple objectives into one scalar objective, whose solution is a Pareto optimal point for the original MOP (Multiobjective Optimization Problem). Most of these combinations are either in a linear fashion or in form of the distance derivatives (Goicoechea et al. 1982, Gupta and Sivakumar 2002, Tabucanon 1988, Yu 1985, Zeleny 1982). Some of the prominent techniques in this relation are Weighted Aggregation, Global Criteria, Minimum Deviation, and Compromise Programming, which are described in the following sections.
1864
Gupta and Sivakumar that a uniform spread of weight parameters rarely produces a uniform spread of points on the Pareto set. Often, all the points found are clustered in certain parts of the Pareto set with no solution in the interesting “middle part” of the set, thereby providing little insight into the shape of the tradeoff curve. The second drawback is that non-convex parts of the Pareto set cannot be obtained by minimizing convex combinations of the objectives, though the existence of a non-convex part in a Pareto boundary is a very rarely occurring phenomenon.
5.1 Weighted Aggregation Method A standard technique in multiobjective optimization is to minimize a positively weighted convex sum of the objectives. It is easy to prove that the minimizer of this combined function is Pareto optimal (Steuer 1986). But, the problem is up to the user to choose appropriate weights. Until recently, considerations of computational expense forced users to restrict themselves to performing only one such minimization, considering just one set of weights chosen with care. Newer, more ambitious approaches aim to minimize convex sums of the objectives for various settings of the convex weights, therefore generating various points in the Pareto set. Though computationally more expensive, this approach gives an idea of the shape of the Pareto surface and provides the user with more information about the trade-off among the various objectives. In this, weighted aggregation approach, different objectives are weighted and summed up to one single objective. The problem then becomes as:
5.2 Global Criterion Method In this method, a global objective function is formed as the sum of derivations of the values of the individual objective functions from their respective singular objective optimum values as a ratio to that of the singular optima. Thus, from the original P objective functions, a single function is formulated and the problem becomes tantamount to solving a single objective optimization (Tabucanon 1988). The modified problem is:
P
Min.F = ∑ w j f j ( x),
r
f j ( x*) − f j ( x) Min.F = ∑ , f j ( x*) j =1 P
j =1
where wj are non-negative weights with ∑wj= 1. By varying these weights, the whole Pareto surface can be found out as each Pareto optimal solution point on a convex surface correspond to a set of wj. This method is the simplest possible approach to solve the multi objective problem, but from application point of view, the user may be having only an intuition of the importance of one objective over the other, without having any knowledge of an exact set of weights for their various objectives, as it is very tough to establish a relationship between these weights and the real outcome in terms of objective functions values. To deal with this complexity, the researchers came up with the idea of finding a Pareto boundary by assigning varying weights to the objectives. Here, the difficulty is that the user has the full set of Pareto optimal points, defining a Pareto boundary, but out of this whole set which one to choose for application. Another problem is that of dimensional inconsistency among various objectives. So, often it is observed that due to the different units of the objectives, one objective functional value seem to be becoming dominant in the overall weighted aggregation of objective functions, even in various combinations of the weights. As a result, this approach becomes misleading, always deciding in favor of a particular objective, unless normalization is performed. One of the simple normalization technique to overcome this problem is to divide the each objective function by its maximum value and using the weighted ratio sum. However, this method suffers from two more serious drawbacks (Das and Dennis 1997). First, the relationship between the vector of weights and the Pareto curve is such
where ƒ j(x*) is optimum value of singular objective function j at its optima point x*, ƒ j(x) is the function value itself, and r is an integer valued exponent that serves to reflect the importance of the objectives. Since, the individual terms in the global objective function are expressed in ratios that are necessarily dimensionless, there is no need to worry regarding the problem of dimensional consistency among various objective functions. In addition, explicit information on the relative importance of the objectives is also not necessary to know. However, the value of exponent r has to be defined by the user, which is generally set as greater than or equal to two in order to give more and more weight to the largest of deviations from the theoretical ideal solution (Tabucanon 1988). One positive thing about it is that as the value of r increases beyond a particular value, the solution set becomes consistent with further increase in the value of r. Therefore, the selection of r does not remain a complex problem in this case. One difficulty with this method arises when the individual optimum of an objective is very small or close to zero. In such case, this objective becomes dominant over all other objective functions as in the overall minimizing function, the deviation from this particular objective function is divided by a quantity approaching to zero, making the corresponding term extremely large. Then, the overall minimizing function would try to make this term as minimum as possible by making the deviation very small and thus resulting in the favor of this single particular objective function.
1865
Gupta and Sivakumar sirable value of ƒ j(x). The minimum deviation problem is therefore formulated as:
5.3 Minimum Deviation Method This method is also applicable when the Pareto optimal values of the objectives are known but their relative importance is not known. It aims at finding the best compromise solution, which minimizes the sum of individual objective’s fractional deviation. The fractional deviation of an objective refers to a ratio between the deviation of a value of that objective from its individual solution and its maximum deviation. The maximum deviation of an objective is obtained from the difference between its individual optimal solution and its least desirable solution, which corresponds to the individual optimal solution of one of the other objectives (Tabucanon 1988, Steuer 1986).
P f j ( x*) − f j ( x) Min.F = ∑ j j o j =1 f ( x*) − f ( x )
This formulation is justified by giving various reasons. Firstly, the objectives may be different in units of measurement. The fractional conversion will help in eliminating the effect of the dimension differences in computation. Secondly, in the event of any significant difference in magnitude of the objective function, the total deviation in absolute terms will be dominated by the objective which has a greater magnitude. The fractional term will help by normalizing the magnitude of each objective. Lastly, it helps to avoid the difficulty when the individual optimum of an objective is very small or close to zero.
5.3.1 Developing A Payoff Table For each objective function, its optimal value is first determined and values of other objective functions are calculated corresponding to this individual optimum. After computing it for all the objectives, a payoff table is formed as shown in Table 2. Column j correspond to the solution vector xj*, which optimizes the jth objective, f j (x) . f ij is
5.4 Compromise Programming The concept of compromise programming is similar to other distance based techniques (Goicoechea et al. 1982, Tabucanon 1988, Zeleny 1982). The method of compromise programming identifies solutions which are closest to the ideal solution (described in section 5.3.1) as determined by some measure of distance. The solutions identified as being closest to the ideal solution are called compromise solutions and constitute the compromise set. In compromise programming , the point of interest is the comparison of distances of different efficient points ( f j ( x ), j = 1,2,..., P ) from the ideal solution which is the point of reference. Since the objectives may be of different dimensions, so the distance measure needs to be corrected to make the individual objectives mutually commensurable. It is therefore necessary to use relative rather than absolute deviations. The individual relative deviations can be raised to any power (r=1,2,…,∞) before these are summed, and also the weights wj (0