2D Image Registration in CT Images using Radial Image Descriptors F. Graf1 , H.-P. Kriegel1 , M. Schubert1 , S. P¨olsterl1 , and Alexander Cavallaro2 1
Institut f¨ ur Informatik, Ludwig-Maximilians-Universit¨ at M¨ unchen Oettingenstr. 67, D-80538 M¨ unchen, Germany [graf,kriegel,schubert]@dbs.ifi.lmu.de,
[email protected] 2 Radiologisches Institut, Universt¨ atsklinikum Erlangen Friedrich-Alexander-Universit¨ at Erlangen-N¨ urnberg, Maximiliansplatz 1 D-91054 Erlangen, Germany
[email protected]
Abstract. Registering CT scans in a body atlas is an important technique for aligning and comparing different CT scans. It is also required for navigating automatically to certain regions of a scan or if sub volumes should be identified automatically. Common solutions to this problem employ landmark detectors and interpolation techniques. However, these solutions are often not applicable if the query scan is very small or consists only of a single slice. Therefore, the research community proposed methods being independent from landmark detectors which are using imaging techniques to register the slices in a generalized height scale. In this paper, we propose an improved prediction method for registering single slices. Our solution is based on specialized image descriptors and instance-based learning. The experimental evaluation shows that the new method improves accuracy and stability of comparable registration methods by using only a a single CT slice is required for the registration.
Keywords: Computer Tomography, Similarity Search, Retrieval, Localization
1
Introduction
CT scans play an important role in the field of medical imaging. Even though CT scans often comprise the complete thorax or even the complete body of a patient, the clinician often only requires a small sub volume of a scan. For example, if a body region should be compared between two scans for a differential diagnosis. In the state of the art work flow both volume scans (each up to more than 1 GB) have to be loaded completely from the clinical PACS (Picture Archiving and Communication System) over the network before they can be aligned manually by the clinician. If instead the clinician could load just the relevant part of a scan from the PACS, this would reduce loading time and also the time needed for navigating through the scans and aligning the positions. In this paper, we want to address this problem and apply a radial image descriptor [2] for the identification of similar body regions. In the above use
II
case, the clinician then only needs to load the relevant sub volume. Also he would not have to navigate through the complete scan as this task could be sped up by the similarity search using the radial descriptor. The key contribution of this paper is the application of a radial image descriptor for the identification of similar body regions. The descriptor is independent from any landmark detectors and provides a smaller prediction error as well as an improved stability of the similarity search compared to the reference algorithm [4] that deals with the same problem. Also the descriptor outperforms the algorithm proposed in [5] which requires volumes as query objects. Finally, the descriptor is more robust in body regions where the reference algorithm shows large errors. The rest of this paper is organized as follows: We describe related work in Sec. 2, then the process of the feature extraction is described in Sec. 3. In Sec. 4 the localization is described. The evaluation is shown in Sec. 5. The paper ends with a conclusion and an outlook on future work (Sec. 6).
2
Related Work
The localization problem could be solved by using the meta data of the DICOM header of a CT image. However, the available information is often error-prone. Gueld et al [6] report that several entries in the DICOM header are often imprecise or even completely wrong. To find a more appropriate solution to the problem, the research community proposed some methods for registering slices to a general atlas with standardized height. The authors of [3] propose to predict the body region from a topogram based on landmarks with invariant positions. A similar approach is proposed in [7] where the mapping is based on a look-up table using 8 landmarks which are detected in various fashions. Seifert et al [9] propose a method to detect up to 19 invariant slices and single point landmarks in full body scans by using PBT and HAAR features. Nevertheless, applying this method requires the availability of a sufficient part of the landmarks and the corresponding landmark detectors. Recently the authors of [4] published a new method using a single slice of a CT scan for registration by using a multirepresented feature descriptor (MR-Descriptor). Feulner et al [5] deal with a similar localization problem. They propose a solution using SURF features with visual words and require sub volumes with a minimum height of 44 mm for the registration. Both [4] and [5] are used for the evaluation of the radial descriptor proposed in this paper.
3
Feature Extraction
The process of generating the compound radial image descriptor consists of the following steps: unifying the image resolutions, extracting the patient’s body and combining the two image descriptors to a single radial descriptor. The resolution of a CT image is determined by the setting of the associated recording device and may vary depending on several external factors. Thus it
III
is needed to scale the image I to a common resolution (1.5 px/mm) to obtain scale invariance between different scans. The resulting image is defined as IS . In order to separate the body from the rest of the image, a compound region detection is performed on IS . A compound region is defined as an area of pixels which is enclosed by a contour of pixels with p(x, y) > τ . p(x, y) defines the Hounsfield Unit (HU) value of a pixel at the position (x, y) and τ defines the according threshold (-500 HU). The resulting compound regions are extracted by starting a contour tracing algorithm from each pixel ∈ IS with p(x, y) > τ . The applied algorithm is implemented by using the analyze particles function of ImageJ [1] which adapts the well known contour tracing algorithm of Pavlidis [8]. Afterwards the bounding box of the largest compound region defines the region of interest (ROI) represented by the area of the patient’s body on the image IS (cf. Fig. 1(b)). IS is then cropped to this ROI, building the image IROI . Next, a radial sector/shell model comparable to [2] (c.f. Fig. 1(c)) is created from which the two descriptors representing dense structures (bones) and soft tissues (like organs etc.) are extracted. Both descriptors are represented by the circumcircle of IROI with radius r. They consist of ny shells and nx sectors resulting in nx · ny = i bins. For each bin i, both the number of pixels of interest (POI) pi and the number of other pixels (NPOI) ni is calculated. A POI is defined as a pixel with p(x, y) ≥ ψ1 or p(x, y) ≤ ψ2 (depending on the type of descriptor, which are described subsequently). The values of bins ∈ / IROI are set to a penalty value (−0.25) to achieve a larger difference between descriptors from regions with different aspect ratios. The first descriptor represents the distribution of bones. Thus, ψ1 is set 300 HU and the set of all POIs is defined by pi = | {p(x, y) ∈ IROI |p(x, y) ≥ ψ1 } |. Regarding the spatial distribution of the bones, it can be said that the outer shells of the descriptor are more relevant than the shells in the middle of the body where hardly any bones are detected. Thus each bin of the descriptor is weighted w.r.t. the shell index i ∈ [1, nx ], so that pi = pi · shell(i)2 . Evaluating the parameters nx and ny showed the slightly best results with nx = 24 and ny = 11. Nevertheless, the impact to εmean and σ (if nx and ny are changed by ±4) are less than 2 mm in case of εmean and less than 6 mm for the standard deviation σ, so that the choice of these parameters is not very critical. Some areas in the human body like the abdomen show a comparatively small amount of dense structures. Therefore, a descriptor representing the location and arrangement of soft tissues is created. The threshold for this descriptor is set to ψ2 = −500 HU. The set of POIs is defined by pi = | {p(x, y) ∈ IROI |p(x, y) ≤ ψ2 } | in this case. For this descriptor the amount of shells and sectors were set to nx = 18 and ny = 8. Same as above, the impact of changing the parameter values on the accuracy is very small. In contrast to the previous descriptor, the weighting is fixed for this descriptor, so that pi = pi · n2y . Finally, both descriptors are concatenated to a single feature vector q. An additional step is the application of a principal component analysis to reduce the dimensionality of the feature vectors. In our experiments, the dimensionality could be reduced to 50 dimension without losing accuracy.
IV Type ψ Sectors nx Shells ny Angle φ Weighting Bins Bones ≥ 300 HU 24 11 15◦ quadratic 240 Soft ≤ −500 HU 18 8 20◦ equal 144 Table 1. Parameter setting for both descriptors.
(a)
(b)
(c)
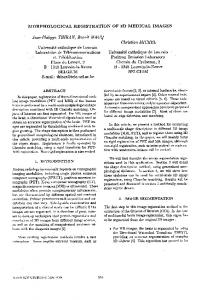
Fig. 1. Visualization of the feature extraction process for a neck scan image Fig. 1(a): the image is rescaled and the body (in this case the head) is detected Fig. 1(b) and approximated by a bounding box. Afterwards the sector/shell model is created Fig. 1(c) from which the features are extracted.
4
Localization
The task of the prediction method is to localize the query vector q representing the query slice with unknown position qz to a value z ∈ [0, 1] in the standardized height model. For this task, we use a database DB containing all feature vectors f v to the corresponding CT slices of n volume scans. DB can thus be regarded as the atlas of the method. Additionally, each f v ∈ DB is annotated with the position f vz ∈ [0, 1] of the according CT slice. For the prediction, we propose a two level knn search, in order to avoid overfitting to a single CT scan: First, the k1 nn to q are computed for each of the n scans ∈ DB, so that k1 · n results are returned, building the set S. This limitation of k1 results per volume scan is done to avoid that all results origin from a single CT scan. Next, the k2 nn to q in S are computed and stored in set T . The result qz of the prediction P is defined by the mean of all position labels in T ’s feature vectors: qz = k12 f vz . f v∈T
5
Evaluation
All experiments were conducted on a database consisting of 98 CT scans (38 neck and 60 thorax scans) with the collection covering the complete area between the top of the head to the end of the coccyx. The scans were recorded from 71 different patients (43 male, 31 female, 1 unknown) with the age of 4 to 86 years. Each of the patients contributed no more than 1 thorax and 1 neck scan. The data set was recorded with 120 kVp from 5 different types of Siemens CT
V
scanners3 and comprises 53 437 DICOM images using more than 27 GB disk space. The resolution along the z-axis varies between 66 and 1 749 slices per scan (= 0.5 - 5 mm/slice). The resolution along the x- and y-axis varies between 1.09 - 2.32 px/mm. The ground truth was created by a manual annotation of all scans with the following landmarks which were selected by a medical expert. In neck scans: cranial crista galli, cranial sella turcica, cranial dens axis, caudal plate of cervical vertebrae #4, caudal plate of cervical vertebrae #7. In thorax scans: cranial sternum, caudal xiphoid process, caudal plate of thoracic vertebrae #12, sacral promontory, caudal os coccygis. The positions of slices are defined in a standard model ∈ [0; 1]. All experiments were conducted using a leave-one-out scheme on each of the 97 scans in the database. Each slice of a scan was used as test object while DB did not contain the volume scan which q belongs to. Therefore, overfitting to the same patient could be excluded. The error is determined by the difference between the predicted height qz and the annotated position of the slice, from which q was extracted. In order to obtain an interpretable result, a height of 1.80 m for each patient was assumed so that all error measurements are relative to this height. We used k1 = 1 and k2 = 3 which proved the best results. Larger values for k1 and k2 only result in a very minor decrease in performance. The feature extraction takes 55 ms/70 ms for the bone/soft descriptors. Cross validation was accomplished in less than 39 minutes (40 ms/slice). More advanced feature reduction techniques combined with spatial index structures could further decrease the search time, yet we mainly focused on minimizing the prediction error in this paper. To measure the prediction quality of the radial descriptor, we measured the mean error εmean and standard deviation σ of the prediction. Applying the prediction method introduced in Sec. 4, we were able to reduce the mean error to εmean = 1.8 cm and the standard deviation to σ = 2.81 cm. Compared to the MR-Descriptor proposed in [4], this means a reduction of the mean error and standard deviation by a factor of almost 2.5 (cf. εmean = 4.45 cm, σ = 9.15 cm). The improvement of σ is visualized by the box plots of Fig. 2: It can be seen that the upper whiskers in the lower diagram of Fig. 2 are clearly lower throughout the whole dataset than in the case of the MR-Descriptor. The improvement of εmean is most significant in the areas between 0-10 cm (representing the head) and > 70 cm (region of the hips). Only in the small region of [66 cm, 71 cm], the radial descriptor is outperformed by about 1.8 cm w.r.t. εmean by the MR-Descriptor. Nevertheless the large errors values are still much smaller in this region using the radial descriptor. In order to evaluate the distribution of the error value, we calculated the cumulative distribution function (CDF) of ε, FE (ε) = F (E ≤ ε). Comparing to the MR-Descriptor, we observed an improvement on the complete CDF: The probability for errors less than 1 cm (FE (≤ 1 cm)) was 0.51 compared to 0.3. FE (ε) ≥ 0.9 was hit at ε = 4 cm for the radial descriptor and ε = 8 cm for the MR-Descriptor. This means that we could guarantee 90% of the errors to be 3
Definition AS+, Sensation 10/16/64, Volume Zoom
VI 14 12 10 8 6 4 2 0 0
10
20
30
40
50
60
70
80
90
0
10
20
30
40
50
60
70
80
90
14 12 10 8 6 4 2 0
1
1
0,9
0,9
0,8
0,8 F ( E ≤ ε )
F ( E ≤ ε )
Fig. 2. Comparison of εmean of the MR-descriptor (upper plot) to the radial descriptor (lower plot). The x-axis displays body regions of 1 cm width starting with the head at x = 0. The y-axis displays the amount of errors in cm. The dashed line in the lower diagram indicates the upper whiskers of the upper diagram for easier comparison.
0,7 0,6
0,7 0,6
0,5 ,
0,5
0,4
0,4
0,3
0,3
1
2
3
4
5
6
7
8
9
10
1
2
3
4
5
ε in cm combined radial
(a)
6
7
8
9
10
ε in cm
MR‐Descriptor
Feulner et al
combined radial
(b)
Fig. 3. CDF of errors from the radial descriptor (red) compared to the MR-Descriptor Fig. (a). Fig. (b) compares our descriptor (1 slice/query) to the work of [5] (4.4 cm query volumes) on all volumes containing the required landmarks.
less than ±4 cm, while the MR-Descriptor could only garantee ε to be less than ±8 cm with the same confidence. The complete CDF can be seen in Fig. 3(a). Comparing the scatter plots of Fig. 4 it can clearly be seen that the result of the localization is much more stable in Fig. 4(b) than in Fig. 4(a). Especially large errors in the region [0 cm, 20 cm] and > 75 cm could almost be eliminated. The problematic regions [20 cm, 30 cm] (shoulder) and [60 cm, 75 cm] (abdomen)
VII
100
100
90
90
80
80
70
70 Predicted
Predicted
can still be identified as a source for larger errors but the overall amount of errors in these regions was also lowered significantly (c.f. CDF in Fig. 3(a)). We also compared the approach to the work of Feulner et al [5]. As their proposed algorithm is designed for query volumes instead of query slices, we chose sub volumes with a size of 4.4 cm for their algorithm and single slice queries for the radial descriptor. This means of course, that the radial descriptor is using less slices and thus less information for the retrieval. Also, the approach of Feulner et al is based on landmarks, so that we had to reduce the data set to 17 volumes (12 male, 5 female, 6 547 slices) which contained the according landmarks. In Fig. 3 the CDFs for both approaches can be compared. It can be seen that the break even for the radial descriptor is at 4.5 cm. In case of ε ≤ 4.5 cm, the work of Feulner et al performs better. Nevertheless ε ≤ 5 cm are measured with a confidence of 0.9, whereas Feulner et al yield the same confidence at 6.5 cm. This means that the amount of larger errors is smaller in the case of the radial descriptor even though only a single query slice is used.
60 50 40
60 50 40
30
30
20
20 10
10 0
5 10 15 20 25 30 35 40 45 50 55 60 65 70 75 80 85 90 95 100 Reference
(a)
0 0
5 10 15 20 25 30 35 40 45 50 55 60 65 70 75 80 85 90 95 100 Reference
(b)
Fig. 4. Scatter plots displaying the results of the prediction. (a) shows the plot of the MR-Descriptor, (b) shows the plot of the Radial Descriptor. The x-component of a pixel denotes the true position of an image, the y-component describes the prediction.
6
Conclusion
In this paper, we proposed to apply a combined radial descriptor for registering single CT slices in a generalized height scale of the human body. The descriptor is independent of any landmark detectors and combines a descriptor regarding bone structures with a descriptor regarding soft tissues. Both descriptors are based on a sector/shell partitioning schema to provide locality sensitivity. Experiments were conducted on a large real world dataset, which was manually annotated by consulting a clinical expert. The descriptor was compared against two state of the art methods. One, based on landmarks and volume queries, another based on single slice queries. Using the radial descriptor significantly reduces the average prediction errors and the likelihood of large prediction errors by up to 2.5× for
VIII
the method having the identical setting. For future work, we plan to extend the prediction method in a way to support query volumes as well as single slice queries. We also plan to apply boosting and instance selection for further improvement of the feature representation. Acknowledgments: This research has been supported in part by the THESEUS program in the MEDICO and CTC projects. They are funded by the German Federal Ministry of Economics and Technology under the grant number 01MQ07020. The responsibility for this publication lies with the authors.
References 1. Abramoff, M., Magelhaes, P., Ram, S.: Image processing with ImageJ. Biophotonics international 11(7), 36–42 (2004) 2. Belongie, S., Malik, M., Puzicha, J.: Shape context: A new descriptor for shape matching and object recognition. In: In NIPS. pp. 831–837 (2000) 3. B¨ urger, C.: Automatic Localisation of Body Regions in CT Topograms. VDM, Saarbr¨ ucken (2008) 4. Emrich, T., Graf, F., Kriegel, H.P., Schubert, M., Thoma, M., Cavallaro, A.: CT slice localization via instance-based regression. In: Proceedings of the SPIE Medical Imaging 2010: Image Processing (SPIE), San Diego, CA, USA. vol. 7623 (2010) 5. Feulner, J., Zhou, S.K., Seifert, S., Cavallaro, A., Hornegger, J., Comaniciu, D.: Estimating the body portion of CT volumes by matching histograms of visual words. In: Proceedings of the SPIE Medical Imaging 2009 Conference (SPIE), Lake Buena Vista, FL, USA. vol. 7259, p. 72591V (2009) 6. G¨ uld, M.O., Kohnen, M., Keysers, D., Schubert, H., Wein, B.B., Bredno, J., Lehmann, T.M.: Quality of DICOM header information for image categorization. In: Proceedings of the SPIE Medical Imaging 2002: PACS and Integrated Medical Information Systems: Design and Evaluation (SPIE), San Diego, CA, USA. pp. 280–287 (2002) 7. Haas, B., Coradi, T., Scholz, M., Kunz, P., Huber, M., Oppitz, U., Andr´e, L., Lengkeek, V., Huyskens, D., van Esch, A., Reddick, R.: Automatic segmentation of thoracic and pelvic CT images for radiotherapy planning using implicit anatomic knowledge and organ-specific segmentation strategies. Physics in Medicine and Biology 53(6), 1751–71 (2008) 8. Pavlidis, T., Liow, Y.: Integrating region growing and edge detection. IEEE Transactions on Pattern Analysis and Machine Intelligence pp. 225–233 (1990) 9. Seifert, S., Barbu, A., Zhou, S., Liu, D., Feulner, J., Huber, M., Suehling, M., Cavallaro, A., Comaniciu, D.: Hierarchical parsing and semantic navigation of full body CT data. In: Proceedings of the SPIE Medical Imaging 2009 Conference (SPIE), Lake Buena Vista, FL, USA. vol. 7259, p. 725902 (2009)