3D Realistic Head Model Simulation Based on Transcranial Magnetic Stimulation Shuo Yang, Guizhi Xu, Lei Wang, Yong Chen, Huanli Wu, Ying Li and Qingxin Yang
Abstract—Transcranial magnetic stimulation (TMS) is a powerful, non-invasive tool for investigating functions in the brain. The target inside the head is stimulated with eddy currents induced in the tissue by the time-varying magnetic field. Precise spatial localization of stimulation sites is the key of efficient functional magnetic stimulations. Many researchers devote to magnetic field analysis in empty free space. In this paper, a realistic head model used in Finite Element Method has been developed. The magnetic field induced in the head by TMS has been analyzed. This three-dimensional simulation is useful for spatial localization of stimulation.
T
I. INTRODUCTION
magnetic stimulation (TMS) is a new technique for the study of human brain and for neurological therapeutics. It is a non-invasive and painless technology [1], which complements conventional neuro -imaging. The stimulation with TMS is achieved from the outside of the head using pulses of electromagnetic field that induce an electric field in the brain. The intense pulsed magnetic field is applied to the underlying neural tissue via a current carrying coil. These currents can be of sufficient magnitude to depolarize neurons [2]. Thus, TMS can either excite the cortex or disturb its function. When used over the motor cortex, TMS produces a motor-evoked potential in the muscles innervated by the corticospinal tract, allowing central motor conduction time to be measured. It can transiently excite or inhibit neural activity, and probe regional brain excitability and intracortical circuits. TMS has grown dramatically in popularity since its initial demonstration by Barker, et al., in Sheffield, England, in 1985[3]. Today TMS has been used in several applications in medical and clinical research which include brain mapping, treatment of mood disorder and schizophrenia, treatment of epilepsy, treatment of chronic pain and so on [4],[5]. But using TMS is still empirical for estimating stimulation sites in head is not easy. Precise spatial localization of stimulation sites is the key of efficient functional magnetic stimulations and treatment. In most cases, the stimulation site is RANSCRANIAIL
This work was supported by the Natural Science Foundation of Hebei Province under Grant No. E2006000037, No.E2004000054 and No. E2005000047. Shuo Yang, Guizhi Xu, Lei Wang, Yong Chen, Huanli Wu, Ying Li and Qingxin Yang are with Province-Ministry Joint Key Laboratory of Electromagnetic Field and Electrical Apparatus Reliability, Hebei University of Technology, Tianjin 300130, China. (phone: +86-022-60201524; e-mail:
[email protected] ).
determined by performing several stimulation experiments which lower the efficiency of experiments and made testees wearied. A lot of researches on TMS simulation in empty free space have been done. However, the tissue electric properties have some influence on the magnetic field and eddy current distribution. To improve the precision in calculation, the tissues exposed to a time-varying magnetic field should not be neglected accordingly. The stimulation site could be gotten from the calculation result of the simulation of realistic head model during TMS using Finite Element Method (FEM). In this study, a three-dimensional realistic head model during TMS is built. Using FEM, magnetic field distribution on the head has been analyzed. Before TMS experiments on the head, the stimulation site could be found by this realistic head model simulation. This simulation is useful for enhancing both the precision in calculation and the efficiency of TMS experiments. II. THE MATHEMATIC MODEL IN TMS In TMS, excitation is achieved by driving intense pulses of current Is(t) through a coil located above the head. The typical pulse lasting time is about hundreds of microseconds, so the frequency used in TMS is 1-10 kHz. The biological tissue permittivity ε is about 10-6 F/m. The biological tissue resistivity σ is about 1S/m. In this condition, displacement current can be neglected and Ampere circuital theorem can be written as:
∇× H = J,
(1)
where J is current density. The activation source is the electric field E induced in the tissues, obtained from Faraday’s law:
∇× E = −
∂B , ∂t
(2)
The tissue material properties are:
H = νB , where ν is permeability. According to:
(3)
∇ ⋅ B = 0,
(4)
B = ∇ × A.
(5)
we have
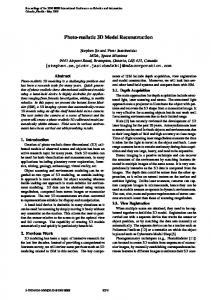
approximations, which necessitate a finite-element model of geometrical and structural characteristics similar to realistic human head. Therefore, we developed 3D realistic head model shown in Fig.1 from MRI pictures using image process and reconstruction technique.
A is magnetic vector potential. Thus, there is
∇ × (E +
∂A ) = 0. ∂t
(6)
Using electric scalar potential ϕ , (6) can also be expressed as:
E=−
∂A − ∇φ . ∂t
(a) brain
(7)
Current density
J = Js + Je ,
(8)
J s is current density applied outside. The induced current density satisfies the Ohm’s Law:
J e = σE = −σ (
∂A + ∇ϕ ). ∂t
(9)
The total H is:
∇ × H = J s − σE , ∇ ×ν ∇ × A = J s − σ (
or
∂A + ∇ϕ ). ∂t
(10)
(11)
For:
∇ ⋅ J e = 0,
(12)
we have
∇ ⋅σ
∂A + ∇ ⋅ σ∇ϕ = 0. ∂t
(b) head Fig. 1. Realistic Head Model reconstructed from MRI
In FEM, a continuous system has been converted to an approximate discrete system, which consists of a finite number of elements and nodes. We use tetrahedron division and get 420875 nodes and 315190 elements. The model consists of scalp, skull, cerebrospinal fluid (CSF) and brain. The conductivity of the tissues inside human head has no uniform standard, and the data used in papers are different. The electrical properties used in this calculation are provided by Stok in 1986. The relative permeability and resistivity of the tissues are shown in Table I. TABLE I THE ELECTRICAL PROPERTIES OF ENCEPHALIC TISSUES Tissues Scalp Skull CSF Brain Relative 1 1 1 1 Permeability Conductivity 0.33 0.0042 1 0.33 (S/m)
The stimulation model is shown as Fig.2. A figure-of-8 coil is placed over the head. When the current inputs the coil, the time-varying magnetic field is induced.
(13)
By solving (11) and (13), the magnetic vector potential A and electric scalar potential ϕ can be gotten. III. THE REALISTIC HEAD MODEL USED IN FEM Both the geometries and the tissue properties of human head are complex. Analytical modeling of such a problem is very difficult. Therefore, this problem is often solved numerically rather than analytically using finite-element
(a) Figure-of-8 coil configuration (b) Stimulation model Fig. 2. Stimulation model for figure-of-8 coil
The input current is produced by a RLC circuit which is given in Fig.3.
C is capacitor for charging and discharging. L is the magnetic coil. R is the resistance. Ui is the excited source. The input voltage Ui is 1000V. i
R
Ui
C
L
Fig. 3. The RLC circuit in TMS.
The parameters for the RLC circuit are shown in Table II. TABLE II THE PARAMETERS OF THE MAGNETIC STIMULATION COILS Diameter of wire 0.0025m
Capacitance 130μF
Inductance 20μH
Inner radium 0.0225m
Fig. 6. Contour plot of magnetic flux density (Tesla) induced by figure-of-8 coil on the scalp.
Turns 6
The coil is powered by current produced in the RLC circuit. The curve of current is shown in Fig.4. The time of the first peak on the curve is that the maximum magnetic field is induced. 2000
Current (A)
1500
1000
Fig. 7. Contour plot of magnetic flux density (Tesla) induced by figure-of-8 coil on the skull.
500
0
-500
-1000 0
0.2
0.4
Time (s)
0.6
0.8
1 x 10
-3
Fig. 4. Coil input current in the RLC circuit
IV. RESULT The magnetic field distributions have been calculated. The radial magnetic flux density distribution in the figure-of-8 coil is shown in Fig.5.
Magnetic flux density (T)
0.045
Fig. 8. Contour plot of magnetic flux density (Tesla) induced by figure-of-8 coil on the CSF.
0.04
0.035
0.03
0.025
0.02 -0.05
-0.04
-0.03
-0.02
-0.01
0
0.01
0.02
Radial Distance (m)
0.03
0.04
0.05
Fig. 5. Radial distribution of magnetic flux density (Tesla) in figure-of-8 coil.
The distribution of magnetic field induced by figure-of-8 coil on the scalp, skull, CSF and brain is illustrated in Fig.6, Fig.7, Fig.8 and Fig.9 respectively. The maximum value is right below the centre of the figure-of-8 coil when the current
Fig. 9. Contour plot of magnetic flux density (Tesla) induced by figure-of-8 coil on the brain.
direction in the two coils of the figure-of-8 coil is different. With the stimulation depth of the tissues increasing, the stimulation intensity decreases and the stimulation range becomes wider. For the shape of brain is irregular and not smooth, the maximum value in the brain is separated. Fig. 10 gives the magnetic flux density distribution along z-axes on the centre of the figure-of-8 coil. The magnetic flux density along z-axes produced by figure-of-8 coil decreased rapidly. And a spatial resolution about 1cm can be attained. 0.045
Magnetic flux density (T)
0.04 0.035 0.03 0.025 0.02 0.015 0.01 0.005 0 0
0.01
0.02
0.03
0.04
0.05
Z-Axes (m)
0.06
0.07
0.08
0.09
Fig. 10. Magnetic flux density distribution (Tesla) along z-axes on the centre of the figure-of-8 coil.
V. CONCLUSION This paper performs a study about magnetic field distribution on the head during TMS. A three-dimensional realistic head model is created. The magnetic field distribution is solved by FEM. From the discussion above, we can find the stimulation site by finite-element analyses. If we have chosen the target tissue, the position the coil is placed can also be gotten by finite-element analyses. This is helpful for experiment design and localization of treatment. REFERENCES [1]
[2]
[3]
[4]
[5]
J. Ruohonen, M. Ollikainen, V. Nikouline, J. Virtanen, and R.J.Ilmoniemi, “Coil Design for Real and Sham Transcranial Magnetic Stimulation,” IEEE Trans. Biomedical Engineering, vol. 47, pp. 145-148, Jan. 2000. T. A. Wagner, M. Zahn, A. J. Grodzinsky and A. Pascual-Leone, “Three-Dimensional Head Model Simulation of Transcranial Magnetic Stimulation,” IEEE Trans. Biomedical Engineering, vol. 51, pp. 1586-1598, Sep. 2004. J. Zheng, L. Li, X. Huo, “Analysis of Electric Field in Real Head Model during Transcranial Magnetic Stimulation,” in Proc. of the 2005 IEEE Engineering in Medicine and Biology,27th Annu. Conf., Shang Hai, 2005. S. Luquet, V. Barra, J. J. Lemaire, “Transcranial Magnetic Stimulation: Magnetic Field Computation in Empty Free Space,” in Proc. of the 2005 IEEE Engineering in Medicine and Biology,27th Annu. Conf., Shang Hai, 2005. J. Ruohonen, P. Ravazzani, J. Nilsson, M. Panizza, F. Grandori, and G. Tognola, “A Volume-Conduction Analysis of Magnetic Stimualtion of Peripheral Nerves”, IEEE Trans. Biomedical Engineering, vol. 43, pp. 669-678, July. 1996.