for recovery of function after spinal cord injury in rodent models. ... Since the most biologically relevant data .... in an AVI format and post-processed. Fig.
3D Tracking of Mouse Locomotion Using Shape-From-Silhouette Techniques Po-Lun Lai1 , D. Michele Basso2 , Lesley C. Fisher2 , and Alison Sheets1 1 Mechanical and Aerospace Engineering, The Ohio State University, Columbus, Ohio 2 School of Allied Medical Professions, The Ohio State University, Columbus, Ohio Abstract— Locomotion is commonly used as a method for evaluating the effectiveness of interventions and treatments for recovery of function after spinal cord injury in rodent models. However, most conventional approaches to assess recovery rely on a series of semi-quantitative visual inspections. In the present study, we propose a volume intersection approach to obtain 3D information about the position of the center of volume and locomotion speed from multiview video cameras. The addition of quantitative measures can be used to improve precision and repeatability within and across testing sites, and further assist researchers in behavioral evaluations of locomotion. Keywords: shape-from-silhouette, SCI mouse, motion tracking
1. Introduction Mice and rats are commonly used as experimental models to help identify important mechanistic targets for the treatment of people with neuromuscular disorders such as spinal cord injury (SCI) [1]. To translate new interventions and treatments from rodent models to human clinical trials, they must be proven to improve recovery of function. Evaluations of treatment effectiveness are typically based on quality of locomotion before and after the intervention. Currently, the SCI field relies on a semi-quantitative, subjective locomotor rating system to assess recovery in mice that freely move in an open environment. Locomotion quality is rated by highly trained researchers on a 10-point scale that quantifies a series of visually detectable movement events over a 4 minutes testing period in an open-field environment [2]. An important indicator of recovery is fore and hind limb coordination, which can only be assessed if the mouse is purposefully moving, moves sufficient distances and at steady speeds. However, the very fast speed and small size of mice make visual observations of potentially important gait characteristics more difficult and may mask important aspects of recovery. Perhaps finer scale evaluations, beyond the visually detectable range, may provide greater quantification of injury severity and extent of recovery. A small number of planar motion analyses have utilized video-based marker tracking for animals while walking over a straight walkway [3] or on a treadmill [4] . While much can be learned from these marker-based studies, the mice
can be distracted by the markers and alter their movements accordingly. Additionally, the mice must be trained to walk on these surfaces. Since the most biologically relevant data on recovery after SCI is likely provided by measurements made in the most natural settings, a markerless approach which can be applied in an open field is favored. The application of computer vision techniques to develop quantitative and sensitive measures of mouse locomotor behavior, which can detect features deemed clinically important in human SCI, would advance the field. Among these techniques, 3D reconstruction and tracking are most relevant to the mouse locomotion analysis since they can reveal the spatial distribution of movement patterns in the minimally constrained, open-field environment. Shape-fromsilhouette [5] has been regarded as an effective approach in the active research area of object reconstruction. The idea of recovering object shape from multi-view silhouettes has been applied to reconstruct human body shape [6] and track human movements [7] [8] [9]. Various improvements have also been proposed for reconstructing object shapes in the presence of different scene problems. For instance, in [10] both foreground object silhouette and occlusion information in a view are combined in an extended silhouette approach. The effective boundary of a moving foreground object is defined to alleviate partial occlusion in the scene. Though the shape-from-silhouette approaches have demonstrated promising outcomes for 3D human shape reconstruction and movement classification, few studies have applied it to evaluate animal movements. A method for tracking multi-legged animal movement using spines has been previously presented [11]. In the field of biology, an automated tracking method for free-flying insects was proposed that could accurately extract full, 3D body and wing kinematics from high-resolution films [12]. In spite of the success of these attempts, they are not directly applicable to the measurements of mouse and rat locomotion since the legs are frequently obscured by the body. In this research, we applied shape-from-silhouette procedures to measure mouse locomotion in the same open-field environment currently used for visual assessment. An interactive process is utilized in the first frame to increase algorithm robustness in the presence of shadows, changing light conditions and objects moving in and out of the capture volume. The results show that shape-from-silhouette methods track mouse position in
the open field environment and provides novel quantification of the type and extent of movement bouts not available with standard testing techniques. The potential for greater precision and repeatability within and across testing sites with these approaches meet the need to resolve ambiguity from observational-based assessments.
2. Center of volume estimation and tracking
(a)
(b)
(c)
(d)
The purpose of this study is to introduce 3D information for the behavioral analysis of SCI mouse. More specifically, we are interested in estimating the velocity and vertical position of the mouse center of volume (CoV). In this section, we delineate the approach utilized in the study and describe the modifications to existing algorithms that make them more robust to background changes.
2.1 Silhouette creation In order to accurately establish the transformation between 3D object space and 2D image space, the calibration parameters for all video cameras are first obtained using the calibration toolbox provided by [13]. Each frame image is then undistorted by applying these intrinsic parameters. The global camera position is generally determined by selecting a local reference frame in the scene and finding correspondences between 3D and 2D spaces. The projection matrix P composed of both intrinsic and extrinsic parameter is then formed to describe the mapping from object space to image space as x = PX
(1)
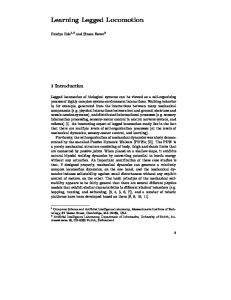
where X is the point location in object space and x denotes its corresponding image pixel. Given multiple views of a scene, we are able to apply the linear mapping in Equation 1 for determining spatial occupancy of an object. An object’s silhouette, when properly segmented from the background, tells its shape from the known camera perspective. A large body of computer vision literature has addressed various models, such as the one in [14], to robustly perform background subtraction. Nevertheless, presence of object shadows which lead to noisy silhouette extraction are still commonly observed in many cases. In this paper, we utilize an intuitive technique for the shadow removal based on the specific experimental setting. In our testing environment, the mouse is placed on top of a translucent plate covered by a blue sheet. After subtracting the trial frame from background image, the shadow casted on the plate mainly increases the intensity of blue band. Hence, we sum up only the absolute differences in red and green bands to form an intensity image. The intensity image is then thresholded using Otsu’s method[15]. The result shown in Figure 1 reveals satisfactory shadow removal.
Fig. 1: Background subtraction. (a)Original image, (b)intensity image, (c)extracted silhouette by using color differences in RGB bands, and (d)silhouette by using R and G bands only. The apparent shadow in original image (a) is mostly removed in the silhouette (d).
In a typical SCI mouse locomotion trial, human researchers commonly reach into the capture volume to interact with the mouse to ensure that it does not stay stationary for the entire testing duration. With researchers moving in and out of the scene, the external illumination condition changes significantly, which increases the difficulty of accurately subtracting the background. Moreover, the researcher may even totally occlude the mouse in several contiguous frames for a specific camera view, making background subtraction more complicated. In order to alleviate these effects, we incorporate a bounding cube approach detailed in the following section.
2.2 Volume estimation In volume intersection approaches, object silhouettes are generated from multi-view images. The intersection of backprojected silhouette cones creates a visual hull that represents 3D object shape. In other words, only the volume occupied by the object should correspond to all object silhouettes. However, due to complex changes in the scene including lighting/shadows and occlusions, it is hard to obtain perfect silhouettes. To avoid noisy reconstruction, generic statistical models are usually applied to find best fit of the object shape. In this approach, divide the scene space into voxels vi . The volume V occupied by the object is represented by the collection of voxels that exceed a certain likelihood threshold:
V = {vi |p(vi ) ≥ pth }
(2)
where p(vi ) is the likelihood index of voxel vi , which is determined by the number of correspondences and spatial distribution. An initial index based only on correspondence is assigned to each voxel by
cube also acts as a window in which background subtraction and thresholding are performed. With this approach, effects of scene illumination changes from human intervention were greatly reduced.
c (3) n where c is number of correspondences and n is number of cameras (n=8 in our experiment). The index p(vi ) is then recomputed by p(vi )ini =
p(vi ) = p(vi )ini +
Y
p(vadj )ini
(4)
m
In the equation above, p(vadj ) represents the initial indices of the m immediate adjacent voxels of vi . The threshold pth is then selected such that the estimated volume size is within three standard deviation from the mean mouse size: −3σ ≤ {V |pth } − Vmean ≤ 3σ
(5)
The estimation may need to be iterated until a stable average volume is achieved. From the accumulated number and coordinates of object voxels, volume and CoV of the mouse can be approximated, and its speed is calculated from CoV locations in the testing plane.
Fig. 3: Sketch of the bounding cube. The computed CoV is projected onto the image and marked as a red cross.
3. Experiment 3.1 Experimental methods Three healthy mice and two SCI mice of different injury severity are used for proof of concept and baseline measurements to determine if the automated markerless measurements are sensitive enough to identify differences between the healthy and injured populations. Eight synchronized VGA cameras recording at 60 FPS are configured around the open field testing environment, such that four view the capture volume from a lower vertical angle (∼30 degrees) and the other four from higher angle (∼60 - 75 degrees). The container incorporates lighting from the bottom to reduce shadows, and transparent walls to confine mouse motion while maintaining visibility for side-view cameras (Figure 3). After collecting trials for all mice, the videos are exported in an AVI format and post-processed.
Fig. 2: Likelihood measure of voxels. Warmer colors indicate higher likelihood. In this study, further reduction of computational time is achieved by confining voxel projection within a cubic volume surrounding the mouse, as shown in Figure 3. The dimension of the cube is predetermined from prior knowledge of the mouse size, with an additional marginal space to accommodate mouse motion in the next frame. The CoV position estimated for the previous frame serves as the center of bounding cube of the current frame, hence the cube moves along with the mouse. The image projection of the bounding
Fig. 4: 3D mesh representation of reconstructed mouse shape.
Fig. 5: In the synthesized video, the left half of the frame consists of four images of the same behavior from different camera views, while the right half shows corresponding speed and CoV height. The projection of CoV location in each view is marked red for inspecting the validity.
Based on the approximate size of mice tested, the dimension of the bounding cube is set as 10cm for both length and width, and its height as CoV height plus 5cm. The cube is then divided into cubic voxels with 2mm on each side, and the mice volumes are estimated from equation 2. To qualitatively examine the validity of the mouse CoV calculation, the CoV of the 3D reconstructed mouse shape (Figure 4) is estimated in all frames and then superimposed onto each existing frame. Due to the small color difference between the markers on the tail (used for animal identification purposes) and the background, the tail cannot be entirely reconstructed in most of the frames. However, knowing that the contribution of the tail to the CoV estimation is small, we consider the CoV approximation to be valid. After the CoV estimation is completed for the whole trial, synthesized videos (Figure 5) are created for the researchers to check if the CoV placement is on a reasonable location.
Fig. 6: Healthy mouse locomotion occurred almost entirely at fast speeds, as denoted by the red color.
3.2 Experimental results The speed and CoV height are considered simultaneously to identify animal movements throughout the trial. When the velocity of the center of volume exceeds a low threshold speed, the mouse is either performing goal-directed locomotion or exploring the testing environment. These behaviors are differentiated mathematically by evaluating the distance that the CoV moves with speeds exceeding a larger threshold value, since mice frequently stop and restart during exploratory behaviors. Additional behaviors which are not currently evaluated in any behavioral rating system can also be identified. For example, rearing is differentiated from standing using the CoV height when the average speed is approximately zero. As expected, hindlimb paralysis or weakness after SCI impairs locomotion and these impairments are reflected in
the measured walking velocities of freely moving mice. Peak locomotion velocities of the healthy mouse were faster than those of the injured mouse, and fast walking bouts were more frequent (Figures 6 and 7). In the healthy mouse, both short and long excursions are completed at high speeds and the mouse walked faster than 50 mm/s for 27% of the testing time (as illustrated by dark red separated by dark blue dots). After SCI, locomotion at speeds faster than 50 mm/s only occur during 13% of the testing period and the mouse rarely attains the fastest speeds (note lack of red in walking trajectory in Figure 7). In addition to allowing comparisons between healthy and injured mice, the velocity plots allow automated identification of portions of the trajectory during which mice are purposefully moving. During these portions of locomotion,
Fig. 7: Injured mouse locomotion was much slower with occasional faster bouts clearly separated by periods of slow walking as denoted by the blue colors.
Fig. 8: Preliminary results indicate that mouse motion patterns can be automatically identified using measurements of center of volume speed and height.
comparisons of step-to-step fluctuations in the center of volume height and average height between the injured and healthy mouse could indicate locomotion quality in the injured animal (Figures 6 and 7). By plotting translational velocity and CoV height, it can be observed that when the healthy mouse is stationary, it frequently rears on the hind limbs which raises the CoV by 50%. The rearing action is not relevant to assessing gait quality, but it clearly illustrates that changes in CoV height can be detected. The injured mouse did not show rearing behavior, thus the range of measured CoV heights are smaller. Also, the injured animal has smaller fluctuations in CoV during purposeful walking which may indicate uncoordinated walking or dragging of the hind limbs (Figure 8). Further investigations are needed to determine if the vertical CoV height measured using the shape-from-silhouette method is sensitive enough to distinguish between typical stepping (healthy), uncoordinated stepping and hind-limb paralysis.
larger samples with different extents of recovery after SCI of different severities.
4. Conclusion and future work The shape-from-silhouette approach for the 3D tracking of mice with and without SCI appears to quantify locomotion in ways not detected with traditional observation. Whether the length, number and speed of bouts will be sensitive indicators of recovery is being tested. Trunk height as measured by CoV is especially interesting since most people with SCI display profound trunk instability. Moreover, trunk height changes in response to different treatment intervention in rats with SCI [16]. In addition to the information directly interpreted from speed and CoV height, the specific waveform in the speed plots of Figure 8 may imply finer motion patterns for characterizing coordinated fore- and hind limb stepping. These patterns will be further investigated in
References [1] D. M. Basso, M. S. Beattie, and J. C. Bresnahan, “A sensitive and reliable locomotor rating scale for open field testing in rats,” Journal of Neurotrauma, vol. 12, no. 1, pp. 1–21, Feb 1995. [2] D. M. Basso, L. C. Fisher, A. J. Anderson, L. B. Jakeman, D. M. Mctigue, and P. G. Popovich, “Basso mouse scale for locomotion detects differences in recovery after spinal cord injury in five common mouse strains,” Journal of Neurotrauma, vol. 23, no. 5, pp. 635–659, May 2006. [3] Q. Xu, C. Cai, H. Zhou, and H. Ren, “A video tracking system for limb motion measurement in small animals,” in 2010 International Conference on Optoelectronics and Image Processing (ICOIP), vol. 1, 2010, pp. 181–184. [4] D. Gibson, N. Campbell, and B. Thomas, “Quadruped gait analysis using sparse motion information,” in International Conference on Image Processing, ICIP 2003., vol. 3, 2003, pp. 333–336. [5] A. Laurentini, “The visual hull concept for silhouette-based image understanding,” IEEE Trans. on Pattern Analysis and Machine Intelligence, vol. 16, no. 2, pp. 150–162, 1994. [6] T. Yang, Y. Zhang, M. Li, D. Shao, and X. Zhang, “A multi-camera network system for markerless 3d human body voxel reconstruction,” in ICIG ’09. Fifth International Conference on Image and Graphics, 2009, pp. 706 –711. [7] G. Cheung, T. Kanade, J.-Y. Bouguet, and M. Holler, “A real time system for robust 3d voxel reconstruction of human motions,” in IEEE Conf. on Computer Vision and Pattern Recognition, vol. 2, 2000, pp. 714 –720. [8] S. Corazza, L. M§ndermann, A. Chaudhari, T. Demattio, C. Cobelli, and T. Andriacchi, “A markerless motion capture system to study musculoskeletal biomechanics: visual hull and simulated annealing approach,” Annals of Biomedical Engineering, vol. 34, no. 6, pp. 1019–1029, 2006. [9] R. Kehl and L. J. V. Gool, “Markerless tracking of complex human motions from multiple views,” Computer Vision and Image Understanding, vol. 104, no. 2-3, pp. 190–209, 2006. [10] L. Guan, S. Sinha, J.-S. Franco, and M. Pollefeys, “Visual hull construction in the presence of partial occlusion,” in Third International Symposium on 3D Data Processing, Visualization, and Transmission, 2006, pp. 413 –420.
[11] G. J. Brostow, I. Essa, D. Steedly, and V. Kwatra, “Novel skeletal representation for articulated creatures,” European Conf. on Computer Vision, vol. III, pp. 66–78, 2004. [12] L. Ristroph, G. Berman, A. Bergou, Z. J. Wang, and I. Cohen, “Automated hull reconstruction motion tracking (hrmt) applied to sideways maneuvers of free-flying insects,” Journal of Experimental Biology, vol. 212, pp. 1324–1335, 2009. [13] J.-Y. Bouguet, “Camera calibration toolbox for matlab,” Website, 2010, http://www.vision.caltech.edu/bouguetj/calib_doc/index.html. [14] S. Cheung and C. Kamath, “Robust background subtraction with foreground validation for urban traffic video,” EURASIP Journal on Applied Signal Processing, vol. 14, pp. 2330–2340, 2005. [15] N. Otsu, “A threshold selection method from gray-level histograms,” IEEE Transactions on Systems, Man, and Cybernetics, vol. 9, no. 1, pp. 62–66, 1979. [16] A. Lankhorst, M. ter Laak, T. van Laar, N. van Meeteren, J. de Groot, L. Schrama, F. Hamers, and W. Gispen, “Effects of enriched housing on functional recovery after spinal cord contusive injury in the adult rat,” Journal od Neurotrauma, vol. 18, no. 2, pp. 203–15, Feb 2001.