lic participation Web site) was edited to develop a user-friendly and easy to under- ... including PHP, JAVA, HTML, SQL, and Visual Basic. The GISEA Web site ...
and Applying 9 Developing a Participative WebBased GIS for Integration of Public Perceptions into Strategic Environmental Assessment Ainhoa Gonzalez, Alan Gilmer, Ronan Foley, John Sweeney, and John Fry CONTENTS 9.1 9.2 9.3
Introduction .................................................................................................. 118 Methodology ................................................................................................. 120 Results........................................................................................................... 123 9.3.1 Assessing the Usability of the Web Site through Pilot Tests ............ 123 9.3.2 Applying the Web Site in Practical Case Studies ............................. 123 9.3.3 Integrating Public Perception into the Environmental Assessment........................................................................................ 125 9.3.4 Assessing Perceptions in Relation to the GIS-Based SEA Methodology ..................................................................................... 127 9.4 Discussion: Assessing the Applicability of the Tool .................................... 128 9.5 Conclusion .................................................................................................... 130 References .............................................................................................................. 131
OVERVIEW The intrinsic spatial nature of development plans poses specific requirements on the analytical tools applied to support Strategic Environmental Assessment (SEA) processes. Geographic information systems (GIS), with their mapping and analytical potential, can assist and enhance the various stages of SEA. A method has been developed to apply GIS as a support tool to assist SEA of land use plans in the Republic of Ireland. This chapter describes one phase in the development and testing of the method during the preparation of County Development Plans, a participatory Internet-based GIS tool 117
55496_C009.indd 117
8/27/08 11:34:46 AM
118
Representing, Modeling and Visualizing the Natural Environment
developed to communicate and gather information in a spatially specific format. The aim of the web site was to promote and expand the use of GIS in public participation and, thus, allow for the incorporation of spatially specific public perceptions in SEA. The results revealed that the integration of public perceptions into the assessment through GIS stimulates debate and provides an overall scientific and social view of the relative environmental significance and vulnerability of the different areas. However, current issues in relation to availability and quality of spatial data constrained the applicability of GIS. Furthermore, complexity of the technology, data disclosure issues, and statutory consultation requirements restricted its implementation and use, affecting the adequacy and the level of public opinion gathered through the Web site.
9.1 INTRODUCTION European Directive 2001/42/EC [1], also known as the Strategic Environmental Assessment (SEA) Directive, requires an assessment of the potential effects of certain plans and programs (e.g., for land use or waste management) on the environment. The SEA process requires a number of steps to be undertaken (Figure 9.1) during the preparation of the plan or program to anticipate, assess, and mitigate any environmental issues associated with the implementation of the plan/program’s objectives and actions. All European Union (EU) member states, except Luxembourg, have transposed the SEA Directive into national legislation and have implemented it, particularly in land use planning [2]. The strong spatial and temporal dimensions of land use plans pose specific requirements in relation to the analytical tools applied to support SEA processes. The intrinsic spatial nature of land use plans solicits their presentation in graphic format. Similarly, temporal variation can often be represented in visual form by spatially illustrating changes over time. Furthermore, it is estimated that up to 85% of government data—used to support policy, plan, and program making—have spatial components [3,4] and can therefore be mapped using geographic information systems (GIS). The graphic display and analytical potential of GIS can significantly contribute to the SEA of development plans by facilitating and enhancing the various stages of the process. SEA processes and the integration of environmental concerns into planning can be positively influenced by public participation [5,6]. The SEA Directive and the related Århus Directive 2003/35/EC [7] make mandatory provisions for public participation in the assessment of potential environmental effects of certain plans and programs in the EU. It is argued that involving the affected public and interest groups enhances the level of legitimacy, transparency, and confidence in the decision-making process [6,8]. Methods such as submission of written comments, public hearings, workshops, and interviews, as well as more modern forms of consultation such as Internet-based forums, are acceptable forms of participation in the EU [7]. Selection of appropriate public participation techniques is necessary to ensure that citizens are given enough time and scope to participate in an effective manner while avoiding undesirable time delays in the decision-making process [8]. Although public participation methods have been widely explored, systems for influential inclusion of public concerns and interests in environmental assessment have seldom been defined [9].
55496_C009.indd 118
8/27/08 11:34:46 AM
Developing and Applying a Participative Web-Based GIS
119
Scoping (Mapping & Spatial Analysis)
Plan/Programme (Non applicable)
Description of Baseline Environment (Mapping & Overlay) Strategic Environmental Objectives (No GIS application) Definition of Alternatives (Mapping) Assessment of Alternatives (Overlay & Spatial Analysis) Definition of Mitigation Measures (No specific application) Definition of Monitoring Measures (No specific application) Environmental Report (GIS outputs included)
Public Consultation and Participation (Public Participation GIS)
Screening (Mapping)
Decision-Making (GIS outputs presented)
FIGURE 9.1 SEA stages, their correlation, and the GIS application for each of the stages. Note that the iterative nature of the process is illustrated by the continuous communication with the planning process. However, the participative aspect of SEA is illustrated referring only to those SEA stages where the directive requires public and stakeholder involvement. The feedback between processes indicated by the upward arrows represents the continuous reappraisal and adjustments required in the process.
Contemporary European planning practice shows an increasing trend toward electronic-based or e-planning (e.g., G-Plan, the Internet-based planning system used by Irish local authorities), as well as toward Internet-assisted information and consultation (e.g., e-tax and e-voting). In addition, the application of technology and computer-based models is common practice in some phases of environmental assessment [10,11]. GIS constitute a useful tool for conveying and presenting information by overlying geographically referenced data, thus facilitating the assessment of the location, extent, and spatial interaction of environmental factors. Unfortunately, GIS packages tend to require skilled knowledge of the system to operate them, as applications normally have a technological rather than usability focus [12,13]. However, recent developments are leading to more user-friendly software interfaces, and usability barriers are being reduced, as indicated by a number of studies where GIS has been successfully used in participatory processes to facilitate spatial comprehension, enhance transparency, and stimulate debate [5,14–16]. In light of this, a GIS-based Web site has been developed for public participation in SEA and incorporated into two Irish land use planning SEAs. This tool provides the means of viewing and gathering data in a spatially specific format and, consequently,
55496_C009.indd 119
8/27/08 11:34:46 AM
120
Representing, Modeling and Visualizing the Natural Environment
facilitates the integration of public perceptions into the environmental assessment of development plans and programs.
9.2 METHODOLOGY This chapter describes one phase in the development and testing of GISEA—a methodological application of GIS to SEA. The resultant GIS-based methodology, suitably adapted to the requirements of each SEA stage (Figure 9.1), is being tested by incorporation within real SEA case studies of land use plans in Ireland to assess its usefulness from an environmental planning perspective. This chapter presents the results derived from the case studies of Mayo and Kilkenny county development plans (CDP). Since personal evaluations of importance can vary widely, a participatory approach to SEA was considered necessary to define a valuing scale that was legitimate and fair to all involved in the assessment process. Therefore, as part of the methodology, a participatory Internet-based GIS tool was developed (hereafter referred to as the GISEA Web site). The aim was to both promote and expand the use of GIS in public participation and, thus, allow for the incorporation of spatially specific public perceptions in SEA. Environmental criteria and their value of significance were determined at the scoping stage based on scientific fact and expert knowledge. Subsequently, the GISEA Web site gathered public perceptions in relation to the importance (weight) of previously defined aspects and other environmental issues, as well as on proposed alternative actions. The objective of this approach was to ensure that articulation of values from most affected parties, including the public, were incorporated into the computerized GISEA methodology for a holistic assessment. The ArcGIS family of products was chosen as the platform for developing the method since it provided the versatility and tools needed to achieve the research objectives. The ArcIMS interface (i.e., the server GIS used for developing the public participation Web site) was edited to develop a user-friendly and easy to understand system that would not require specific GIS skills and could be manipulated with basic Web-browser knowledge. Therefore, the viewframe and tools available in ArcIMS were adapted to the requirements of the research. This included an enhanced browser, improved user interaction, and incorporation of a database, display of tools, and questionnaires specific to the chosen case studies. This was achieved by programming and editing the scripts on the ArcIMS files in several computer languages, including PHP, JAVA, HTML, SQL, and Visual Basic. The GISEA Web site follows a number of steps that guide the user through the public consultation process (Figure 9.2), with an introductory Web page describing the purpose of the site. Users are asked to select three environmental criteria of concern. These selected criteria are essential for validating the significance of environmental factors. The GIS-based Web pages subsequently display the relevant environmental information, and users can view and interact with these spatial data. Personal perceptions and comments on the displayed environmental information and the proposed alternatives can be submitted via questionnaires, which are gathered on a database for future analysis. In addition, and to avoid limiting the submission of comments to the previously established environmental factors, a supplementary tool
55496_C009.indd 120
8/27/08 11:34:47 AM
Developing and Applying a Participative Web-Based GIS
Initially this frame displays information on how to use the website (1). The user can always come back to it using the help (2) button.
A semistructured questionnaire (1) is displayed for each scenario where the user can submit personal views and opinions.
The user can also submit information (3) in relation to any particular feature/area on the map (coordinates are automatically recorded when clicking on the map), using the information button (1) located in the toolbar.
121
The selected environmental criteria are displayed on the map and listed on the table of contents (3), which also includes the proposed scenarios. Pictures (3) illustrate the listed factors.
The different scenarios can be turned on/off from the table of contents (2). The tools (3) allow the user to explore (zoom and palm) and query the geographic data displayed.
When the user has finished interacting with the website (note that steps 2 and 3 can be repeated as many times as the user desires), the submit (2) button exits the site.
FIGURE 9.2 Details of the GISEA ArcIMS Web page.
is provided to allow comments to be recorded on any particular location or feature on the map (by recording the X and Y coordinates). Once the user finishes exploring the information and submitting opinions, the browser continues to a final Web page where users are asked to comment on the usefulness of the site.
55496_C009.indd 121
8/27/08 11:34:47 AM
122
Representing, Modeling and Visualizing the Natural Environment
The tool was pilot tested and subsequently amended to incorporate changes and improve its user interface. It was then made available during the development of two real-life SEAs to evaluate its applicability in the Irish planning system. These have allowed preliminary conclusions to be drawn in relation to the limitations, opportunities, barriers, and benefits derived from the availability of a GIS tool for public participation. It must be noted that the Web site was intended to complement rather than replace existing practices and techniques and traditional public participation methods by ensuring that stakeholders have timely access to information and are provided with a mechanism to have a say outside conventional participatory processes. Therefore, the Web site results were to be compared and incorporated with other participatory outcomes for completion and consolidation. The overall objective was to validate the chosen environmental criteria, to gather opinions in a spatially specific format, and to incorporate these into the environmental assessment of the proposed alternatives. The qualitative comments and opinions submitted could also be evaluated and summarized in the SEA’s environmental report. Perceptions in relation to environmental criteria of concern were used in the form of weighted values for assessing the relevance and consequent vulnerability of the environmental resources in the region. Multicriteria analysis was applied and existing GIS tools used to automatically detect the degree of overlap of thematic layers (i.e., environmental data) and determine areas of potential vulnerability (i.e., the higher the number of overlapping key environmental factors, the greater the vulnerability). This was done by converting feature spatial data to raster format and reclassifying them to allow the GIS to undertake automated calculations. The weighted linear combination algorithm proposed by Chrisman [17] was adapted by subtracting the division factor that averages the output value. This adaptation was made to avoid neglecting potential cumulative effects because the vulnerability of each area was directly related to the number of environmental criteria that overlapped at one location (i.e., pixel). The following equation was applied to combine the number of environmental factors, and their significance and weight: Vn = SWjVj where Vn refers to the resultant vulnerability value for the area/pixel that relates to the total number (n) of criteria that overlap in the area. Wj refers to the significance or sensitivity value for each criterion (j) according to scientific opinion. To standardize categorizations it was established that highly sensitive environmental factors (e.g., surface waters designated as being at risk (1a) under the Water Framework Directive or landscapes classified as highly sensitive in the CDP) equated to 10, and sensitive factors (e.g., surface waters designated as being potentially at risk (1b) under the Water Framework Directive or landscapes classified as sensitive in the CDP) equated to 5. A value of 0 was given to the cells that had no occurrence of environmental constraint. Vj refers to public weighting and includes the subjective judgments from stakeholders and the general public on the perceived vulnerability of each criterion (j)
55496_C009.indd 122
8/27/08 11:34:48 AM
Developing and Applying a Participative Web-Based GIS
123
considered. The weighting values (Vj) are used as a “strengthening” factor. Those aspects of concern (i.e., the three criteria selected the higher number of times) were perceived as more important and, thereby, given a weight of 1.5 that increased their significance. The criteria perceived as neutral (i.e., unselected criteria or criteria selected the fewest times) still had scientific significance and were therefore given a weight of 1. The computer model undertook the weighted overlay process and reevaluated the data. The results provided a thematic map reflecting the composite vulnerability of each area according to both scientific opinion and public perception. The results were also computed and provided in quantitative form to complement and further facilitate the understanding of key environmental aspects within the study area, as well as the succeeding assessment of alternatives.
9.3 RESULTS 9.3.1 ASSESSING THE USABILITY OF THE WEB SITE THROUGH PILOT TESTS Pilot studies were carried out to assess the usability and overall user-friendliness of the GISEA public participation tool. These pilot tests targeted 61 undergraduate and postgraduate students with no or basic GIS knowledge. Results revealed that total lack of GIS skills could limit the understanding of the displayed maps and affected performance; 75% of the students with some GIS knowledge were able to complete all the steps indicated in the Web site, whereas this value was only 39% for individuals with no GIS skills. The majority (66%) of users that completed the process found the Web site easy to use and navigate. The graphics were perceived as a good way of communicating environmental information. However, 30% indicated that the absence of background Ordnance Survey Ireland (OSI) maps and a readily available legend (i.e., an alternative to having to select the legend menu) were major drawbacks. Other observations highlighted the necessity to improve the guidance on how to use the Web site, to reduce the amount of information displayed, and to enhance the browser structure. The Web site was consequently amended to improve the overall interface and incorporate those suggestions derived from the pilot studies. New instruments to facilitate its use were included (such as an animated demonstration on how to use the Web site and interactive questionnaires), together with representative photographs for the different areas and environmental considerations and, where possible, OSI base maps.
9.3.2 APPLYING THE WEB SITE IN PRACTICAL CASE STUDIES The Web site was launched as part of the SEA of two CDPs in the Republic of Ireland. The GISEA Web site was adapted to the requirements of each case study, providing the flexibility necessary to reflect and incorporate both the regulatory requirements and the planning information needs. The planning teams involved in both SEAs perceived it as a complementary participative instrument and supported public access to the Web site by providing GIS data and including a link on the organizations’
55496_C009.indd 123
8/27/08 11:34:48 AM
124
Representing, Modeling and Visualizing the Natural Environment
official Web sites. However, the authorities responsible for the SEAs already had a formal method for gathering public submissions, derived from the statutory planning procedures. This formal requirement constrained the effective application of the tool in the case studies, and a number of other factors also limited the usability of GIS during the participative stages of SEA. The SEA process in County Mayo envisaged an experimental public consultation program using the GIS-based Web site to validate the environmental objectives. Unfortunately, the work program for revising the existing CDP and the consequent SEA process were delayed, thus affecting the public consultation stage. In addition, issues of political will and confidentiality, and fears over early disclosure of information affected both the timely provision of the Web site and the disclosure of certain layers of information, such as OSI base maps and considered alternatives. This, in turn, affected the evaluation of proposed alternatives by the general public. The GISEA Web site, therefore, only displayed the environmental data used during the SEA process. Furthermore, despite initial enthusiasm, the forward planning team questioned the usability of a GIS-based participatory Web site, indicating that GISbased interfaces are complex tools that only technically skilled personnel would be able to use. Although the GISEA Web site was made publicly available within the County Council’s official Web site on 4 May 2007, access was gained via a series of links in additional Web pages and the GISEA Web site link was addressed as a research study rather than an additional public consultation tool. All of the above aspects had implications on the usability of the tool. A limited number of hits were registered (a single hit from Mayo, four from Dublin, six from the rest of the country, two from Germany, and one from London). Moreover, no comments were submitted to the GISEA Web site during the public consultation period (10 April to 21 June 2007). During the consultation period, the County Council received 56 written submissions and 22 online submissions. A modified version of the research tool (which included OSI maps and a specific questionnaire for each of the proposed alternatives displayed in the Web site) was subsequently launched during the public consultation stage of the Kilkenny CDP revision. The forward planning team involved in that SEA process actively supported the publication of the GISEA Web site through appropriate license agreements and provision of all relevant data. It was anticipated that the tool would be launched at the initial stages of the SEA process to facilitate all consultation procedures and promote the transparency of the decision-making process. However, a number of practical considerations affected its implementation. As with the Mayo CDP, the statutory information and submission channels limited the effectiveness and applicability of the tool. Although no limitations were imposed on disclosing data, delays in the definition of proposed alternatives affected its early incorporation in the process. Similarly, changes and delays in the scheduled work program affected the timely incorporation and, thus, the availability of the tool. Although access to the GISEA Web site required fewer intermediary Web pages, the official link also addressed the GISEA Web site as a research study rather than an additional public consultation tool. The Web site was made available on the 15 August 2007. No comments were submitted to the GISEA Web site during the public consultation period (10 August to 19 October 2007). There were a limited number of hits registered,
55496_C009.indd 124
8/27/08 11:34:48 AM
Developing and Applying a Participative Web-Based GIS
125
none of them apparently from Kilkenny (thirty-four from Dublin; two from Cork; four from the rest of the country; and one from each of Australia, United States, and Spain). During the consultation period, the County Council received 208 written and 46 online submissions.
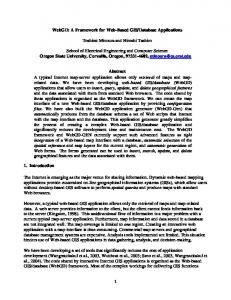
9.3.3 INTEGRATING PUBLIC PERCEPTION INTO THE ENVIRONMENTAL ASSESSMENT An initial test was undertaken utilizing a simple version of the methodology to assess the level of acceptance by the SEA and the forward planning teams of representing environmental vulnerabilities in a composite map (Figure 9.3). This version avoided the more complex computation model designed as part of the full methodology. Feedback indicated that conveying results in overlay format facilitated the combined assessment of multiple factors, enhancing the identification of key nodes of environmental sensitivity. Subsequently, with public perceptions still being gathered, the full methodological approach was applied as a pilot study in which assessment was undertaken by ascribing weighting values to each environmental criterion. A distinction was made between high and moderate sensitivity factors (see Section 9.2), as some of the environmental variables considered already incorporated a sensitivity classification (Table 9.1). The software computed those environmental sensitivities that co-occur in each pixel cell to obtain a total sensitivity value (i.e., environmental vulnerability to development) for each particular area. The pixel cell size adopted for the pilot test N
SLIGO
ROSCOMMON
LEGEND Linked hub towns Westport tourism node Key towns Composite of environmental sensitivities GALWAY
0
5
10
20 Km
FIGURE 9.3 Results of the overlay indicating composite environmental vulnerabilities in County Mayo.
55496_C009.indd 125
8/27/08 11:34:48 AM
126
Representing, Modeling and Visualizing the Natural Environment
TABLE 9.1 Ascribed Relative Vulnerability of the Key Environmental Aspects Considered in the Assessment Environmental Criteria Designated natural heritage areas Special areas of conservation (Natura 2000 sites) Special protection areas (Natura 2000 sites) River basins at significant risk Lakes at significant risk Coastal waters at significant risk Designated national monuments Sensitive landscape protection policy areas River basins probably at significant risk Lakes probably at significant risk Coastal probably waters at significant risk Ground waters probably waters at significant risk Total
Sensitivity Value (Wj) 10 10 10 10 10 10 10 10 5 5 5 5 100
calculations was 30 m × 30 m; this size can be adjusted to provide a higher level of detail for larger scale, or geographically smaller area, assessments. Figure 9.4 illustrates the total vulnerability for that area, assuming the vulnerability values indicated in Table 9.1 and incorporating an equal-weighted value for each cell (i.e., assuming all criteria have the same relevance according to public opinion). For example, the total sum for three moderately sensitive factors (3 × Wj = 5) and two highly sensitive factors (4 × Wj = 10) co-occurring at a given location with an equal weighted value (Vj = 1) applied to each, would score 55 and thus render that particular area extremely vulnerable in environmental terms (Table 9.2). The resulting map (Figure 9.4) provides a graphic representation of the location, interrelationship, and extent of areas vulnerable to impact, classified according to the various levels of vulnerability (Table 9.2). It also allows quantitative analysis by calculating the number of pixels under each environmental vulnerability category. Table 9.3 illustrates the type and extent of environmentally vulnerable areas in the county (e.g., 5.5% of the county is highly vulnerable in environmental terms). Proposed scenarios can be evaluated against the vulnerability map, rapidly identifying those areas of proposed urban expansion or economic development that conflict with areas of significant environmental vulnerability. Representation of codified results (by color and with spatially definite variables) allows fast identification of potential incompatibilities and viable alternatives, informing the decision-making process in a concrete and transparent manner. The breakdown of the results in percentages (relating to perceived possible environmental impacts of implementing the plan) also contributes to a more effective comparison of alternatives as well as to the definition of spatial indicators that can facilitate the monitoring and auditing phases of SEA.
55496_C009.indd 126
8/27/08 11:34:49 AM
Developing and Applying a Participative Web-Based GIS
127
N
SLIGO
ROSCOMMON
GALWAY 0
5
10
20 Km
LEGEND 5 10 15 20 25 30 35 40 45 50 55 60 65
FIGURE 9.4 Results of weighted overlay indicating areas of varying degrees of environmental vulnerability in County Mayo.
TABLE 9.2 Vulnerability Classes According to Weighted Overlay Scores Vulnerability of the Area
Weighted Overlay Score
Low vulnerability Moderate vulnerability Vulnerable High vulnerability Extreme vulnerability Acute vulnerability
5–20 20–30 30–40 40–50 50–60 >60
9.3.4 ASSESSING PERCEPTIONS IN RELATION TO THE GIS-BASED SEA METHODOLOGY Planners and technicians involved in the case studies were interviewed to gain further insight into the potential benefits and limitations of applying GIS to SEA. Summarizing the survey findings and maintaining the focus on the public participation aspect of the methodology, it can be argued that the responses were largely positive: spatial data and GIS were considered to provide clearer and spatially specific information that improved understanding of environmental and planning
55496_C009.indd 127
8/27/08 11:34:49 AM
128
Representing, Modeling and Visualizing the Natural Environment
TABLE 9.3 Quantification of Environmentally Vulnerable Areas in County Mayo Environmental Vulnerability
Area (km2)
Percentage (%) of Total County Area
Low vulnerability areas Moderate vulnerability areas Vulnerable areas High vulnerability areas Extreme vulnerability areas
3552.16 937.92 855.84 325.28 180.8
60.5 16.0 14.5 5.5 3.5
issues, facilitated plan-making, and better informed decision making. The majority of respondents indicated that the main benefit of GIS derived from its potential to overlay information in a spatially specific manner. Graphic representation and the quantitative computation of results were perceived as enhancing the comprehensiveness and transparency of the SEA process. Interviewees generally perceived that, if used properly (i.e., ensuring data quality and avoiding complex analysis and intricate representations), maps can promote, debate, and assist public participation and consultation processes. However, several respondents noted that in reality the public does not commonly engage in forward planning processes and, moreover, the lay public may have educational impediments for reading and understanding maps, a barrier that could be exacerbated when using GIS-based interfaces.
9.4 DISCUSSION: ASSESSING THE APPLICABILITY OF THE TOOL GIS has been recognized as a useful tool for assisting environmental decision making [18–20], and the methodology for employing GIS to assist the various SEA stages revealed a number of strengths and weaknesses (Table 9.4). The case studies highlighted that GIS has the potential for improving the transparency of the information available to the public and the spatial analysis of combined quantitative and qualitative data. Similarly, the availability of a Web-based participatory tool can facilitate public consultation processes by providing an alternative and complementary way of informing the public and allowing them to remotely submit views and comments. However, it is still considered an expensive solution that requires high levels of spatial understanding and technological skill to use (Kingston, personal communication). Moreover, Kingston et al. [21] suggest that the levels of participation are directly related to the geographical scale, with the greater participation occurring at more localized scales. Several of the interviewed practitioners confirmed this observation by highlighting the limited participation levels of the general public in forward planning. Notwithstanding the findings of an international questionnaire indicating that Internet-based GIS can facilitate participative processes [22], it can be argued that there is a somewhat limited scope for GIS during the consultation procedures of SEA.
55496_C009.indd 128
8/27/08 11:34:50 AM
Developing and Applying a Participative Web-Based GIS
129
TABLE 9.4 Key Strengths and Weaknesses of the Method Observed during the Case Studies Strengths • Enhanced transparency of both SEA and planning processes
AU: Clarify “availing from.”
• Spatially specific assessment of issues and alternatives • Improved information delivery and easier interpretation of results by planners and decision makers • Speed of applicability derived from the availability of a systematic methodology • Controlled subjectivity of the assessment (as a result of the inclusion of public perception values) • Facilitated comparison among both alternatives and case studies
Weaknesses • The reliability of results depends largely on the availability and quality of baseline information/GIS data • The method relies on GIS knowledge/expertise • Existing formal procedures for public participation can affect the effectiveness of participatory GIS • Fear of early disclosure can affect the use of GIS and divulgation of outcomes • There is a tendency to interpret overall results in a quantitative manner (and not all environmental aspects or planning decisions are quantifiable) • Comparison among different studies/alternatives requires availing from this method
The apparent division between computer-skilled and “traditional” citizens [23,24], the complexity of the system, and variable access to the technology [14,25] can affect its applicability. In line with international opinion, complexity of the technology and issues associated with data disclosure and statutory consultation requirements restricted the implementation and use of GIS during the case studies. In addition, the majority of received submissions were provided in written form, despite the availability of e-mail submission options on the County Council Web sites. Therefore, it can be argued that computer literacy or reservations in relation to technology are a basic barrier to e-participation. This issue is aggravated when using additional and more complex technologies such as GIS. However, despite the constrained use of GIS during the consultation process of the case studies, the planners involved considered GIS as information media to benefit the spatial understanding of both environmental aspects and planning processes. This agrees with published findings that data analysis through GIS produces a synergistic effect, enhancing collaboration and understanding, as well as improving both the quality and accuracy of results [20,26]. The majority of environmental GIS applications rely on mapping and simple overlay operations to examine where resources or vulnerabilities co-occur [11,27], but this general approach does not give consideration to the relative importance and vulnerability of the different environmental factors. Significant attempts have been made to incorporate qualifiers that stress the relative significance of environmental considerations. Such approaches commonly translate public perceptions and scientific opinion into weighted values. However, there is still a significant gap between experimental and practical application of participatory GIS and very few real-life
55496_C009.indd 129
8/27/08 11:34:50 AM
130
Representing, Modeling and Visualizing the Natural Environment
case studies have been published (examples include Kingston et al. [14], Jordan and Shrestha [28], and Weiner and Harris [29]). Current real-life environmental studies largely rely on basic GIS operations [27]. Taking into consideration the work undertaken by a number of researchers (e.g., Kingston et al. [14] and Antunes et al. [30]), this application introduced weighting values derived from both expert opinion and public participation for each relevant data. This approach provided a new dimension to the existing SEA methodologies by incorporating an innovative approach to the strategic assessment of land use plans. However, a number of fairly predictable limitations were observed, such as the need for GIS expertise, and data availability and accuracy issues, similar to those noted by Joao and Fonseca [11] and Vanderhaegen and Muro [27]. Moreover, reservations with regard to the usability of the tool and willingness to share and disclose spatial information varied among the case studies. Despite the perceived potential of the tool to assist and enhance participative processes in SEA, the aforementioned factors are considered to significantly affect the uptake of participatory GIS in the context of the Irish planning system.
9.5 CONCLUSION Spatial data and GIS have the potential to facilitate and improve methodological aspects of environmental assessment (e.g., Joao [10], Antunes et al. [30], Agrawal and Dikshit [18], Steadman et al. [19], and Semmens and Goodrich [31]). Similarly, e-planning has huge potential to improve public participatory processes [32]. The provision of a complementary and alternative participatory GIS tool via the Internet has the potential to promote public involvement and enhance the transparency of the process by means of explicit display of information that reaches more people [33,34]. Despite this, the Irish case studies exposed a number of technical issues (e.g., computer and GIS knowledge/skill requirements, as well as spatial literacy) and institutional problems (e.g., copyright, confidentiality, and regulatory requirements for formal consultation) that significantly influence the usability of GIS-based public consultation in SEA. The integration of public perceptions through GIS adds a new dimension to existing SEA methods and fulfills the requirements of Article 17 of the SEA Directive, which establishes that opinions expressed by the public are to be taken into consideration [1]. Having taken this approach, the results provide a composite scientific and social view of the relative environmental significance and vulnerability of the different areas, providing a more holistic view of the potential issues. It was observed through the case studies that the spatial representation and analysis of environmental considerations allows further scrutiny and contributes to a better understanding of the environmental implications of a planning decision. The consequent graphic and quantitative representation of the results allows a rapid and effective identification of most viable development scenarios/alternatives. The case studies indicate that GIS maps help stimulate debate and perform as a support tool in SEA by providing the mappable aspects. The GISEA methodology moves toward a more comprehensive and better informed decision-making process. It must be noted, however, that current issues in relation to availability and quality of spatial data significantly hamper the effective application of GIS techniques in all
55496_C009.indd 130
8/27/08 11:34:50 AM
Developing and Applying a Participative Web-Based GIS
131
SEA stages. Data confidentiality and licensing issues also limit the extent to which GIS can be used. Furthermore, GIS skill and knowledge requirements and the more strategic and nonspatial nature of certain planning policies and objectives at SEA level restrict the applicability of GIS in a number of steps in the environmental assessment process (e.g., public participation, assessment of alternatives, and definition of mitigation measures). In all cases, results derived from the spatial assessment need to be carefully scrutinized for validity and complemented with other forms of scientific knowledge and data if they are to be accountable. Resolution of complex environmental and planning decisions goes beyond the use of spatial data and the application of a systematic technology. Significant developments (at the education and technology levels) are still required to improve the efficiency of GIS in public participation processes. Similarly, more practical applications of spatial inclusion of public perceptions are needed to assess the real contribution of the methodology to participative environmental planning. Further research in relation to both participative SEA processes and governance issues in current planning procedures could also help identify feasible methods for the effective incorporation of public perceptions into decision making.
REFERENCES 1. Commission of the European Communities (CEC), Directive 2001/42/EC on the assessment of the effects of certain plans and programmes on the environment, Luxemburg, Official Journal of the European Union, 2001. 2. Fischer, T. B., Environmental Assessment in Land Use Planning in European Union Member States. Environmental Policy Advisory Service and Environmental Management Project, GTZ–Deutsche Gesellschaft für Technische Zusammenarbeit, Task 1 of project 02.2164.8-001.00, 2006. 3. Chan, Y. and Easa, S., Looking ahead, in Urban planning and development applications of GIS, Easa, S. and Chan, Y., Eds., American Society of Civil Engineers, Reston, VA, 2000. 4. Wicks, P., INSPIRE Directive, Unpublished paper presented at the Irish Organisation for Geographic Information (IRLOGI) Conference, Dublin, Ireland, 2006. 5. Al-Kodmany, K., GIS and the artist: Shaping the image of a neighbourhood in participatory environmental design, in Community participation and geographic information systems, Weiner, D., Harris, T. M., and Craig, W. J., Eds., Taylor & Francis, London, 2002. 6. Risse, N., Crowley, M., Vincke, P., and Waaub, J.-P., Implementing the European SEA directive: The member states’ margin of discretion, Environmental Impact Assessment Review, 23, 453, 2003. 7. Commission of the European Communities (CEC), Directive 2003/35/EC—Providing for public participation in respect of the drawing up of certain plans and programmes relating to the environment and amending with regard to public participation and access to justice council Directives 85/337/EEC and 96/61/EC, Official Journal of the European Union, L 156, 25.6.2003, 2003. 8. von Seht, H., Requirements of a comprehensive strategic environmental assessment system, Landscape and Urban Planning, 45, 1, 1999. 9. Gonzalez, A., Gilmer, A., Foley, R., Sweeney, J. and Fry, J., Dynamics of a decision support system in strategic environmental assessment implementation, Proceedings of the IAIA´05 Ethics and Quality, Annual Conference of International Association for Impact Assessment, Boston, 2005.
55496_C009.indd 131
8/27/08 11:34:50 AM
132
Representing, Modeling and Visualizing the Natural Environment
10. Joao, E., Use of geographic information systems in impact assessment, in Environmental methods review: Retooling impact assessment for the new century, Porter, A. and Fittipaldi, J., Eds., The Army Environmental Policy Institute, Atlanta, 1998, 154. 11. Joao, E. and Fonseca A., Current use of geographical information systems for environmental assessment: A discussion document, Research Papers in Environmental and Spatial Analysis (No. 36), Department of Geography, London School of Economics, 1996. 12. Jordan, G., A public participation GIS for community forestry user groups in Nepal: Putting people before the technology, Department of Agriculture & Forestry, University of Central Lancashire Penrith, Carlisle, UK, 1998. 13. Sieber, R. E., Geographic information systems in the environmental movement, http:// www.ncgia.ucsb.edu/varenius/ppgis/papers/sieber.pdf, 1998 14. Kingston, R., Carver, S., Evans, A., and Turton, I., Web-based public participation geographical information systems: An aid to local environmental decision-making, Computers, Environment and Urban Systems, 24(2), 109, 2000. 15. Bojórquez-Tapia, L., Diaz-Mondragón, S., and Ezcurra E., GIS-based approach for participatory decision making and land suitability assessment, International Journal of Geographical Information Science, 15(2), 129, 2001. 16. Wood, J., “How green is my valley?” Desktop geographic information systems as a community-based participatory mapping tool, Area, 37(2), 159, 2005. 17. Chrisman, N., Exploring geographic information systems, John Wiley & Sons, Chichester, 1999. 18. Agrawal, M. L. and Dikshit, A. K., Significance of spatial data and GIS for environmental impact assessment of highway projects, Indian Cartographer, 4, 262, 2002. 19. Steadman, E. J., Mitchell, P., Highley, D. E., Harrison, D. J., Linley, K. A., McFarlane, M., and McEvoy, F., Strategic environmental assessment and future aggregate extraction in the East Midlands region, British Geological Survey Report CR/04/003N, 2004. 20. Bettes, L., Successfully integrate environmental and transportation planning, http:// www.geoplace.com/uploads/OnlineExclusives/quantm.asp, 2005. 21. Kingston, R., Carver, S., Evans, A., and Turton, I., Virtual decision making in spatial planning: Web-based geographical information systems for public participation in environmental decision making, Proceedings of the International Conference on Public Participation and Information Technology, Lisbon, Portugal, 1999. 22. Gonzalez, A., Gilmer, A., Foley, R., Sweeney, J., and Fry, J., Technology and public participation methods, Proceedings of the IAIA´06, Annual Conference of International Association for Impact Assessment, Stavanger, Norway, 2006. 23. Furlong, S. R., Interest group participation in rule making: a decade of change, Journal of Public Administration Research and Theory, 15(3) 353, 2005. 24. Scott, D. and Oelofse, C., Social and environmental justice in South African cities: Including invisible stakeholders in environmental assessment procedures, Journal of Environmental Planning and Management, 48(3), 445, 2005. 25. Carver, S., Public participation using web-based GIS, Environment and Planning B, 28(6), 803, 2001. 26. Andrienko, G., Andrienko, N., and Gitis, V., Interactive maps for visual exploration of grid and vector data, ISPRS Journal of Photogrammetry and Remote Sensing, 57(5-6), 380, 2003. 27. Vanderhaegen, M. and Muro, E., Contribution of a European spatial data infrastructure to the effectiveness of EIA, Environmental Assessment Review, 25(2), 123, 2005. 28. Jordan, G. and Shrestha, B., A participatory GIS for community forestry user groups in Nepal: Putting people before the technology, Participatory learning and action notes 39, International Institute for Environment and Development, 2000, available at: http://www.geog.ntu.edu.tw/course/gislucc/GIS_Paper%5Cforestry.pdf.
55496_C009.indd 132
8/27/08 11:34:50 AM
Developing and Applying a Participative Web-Based GIS
133
29. Weiner, D. and Harris, T. M., Community-integrated GIS for land reform in South Africa, Urban and Information Systems Association Journal, 15(APA II), 61, 2003. 30. Antunes, P., Santos, R., and Jordao, L., The application of geographical information systems to determine environmental impact significance, Environmental Impact Assessment Review, 21(6), 511, 2001. 31. Semmens, D. J. and Goodrich D. J., Planning change: case studies illustrating the benefits of GIS and landuse data in environmental planning, 2005, available at: http://www. tucson.ars.ag.gov/AGWA/docs/pubs/hypesd.pdf. 32. Kingston, R., The role of participatory e-planning in the new English local planning system, 2006, available at: www.ppgis.manchester.ac.uk/downloads/e-Planning_LDFs. pdf. 33. Ceccato, V. and Snickers, F., Adapting GIS technology to the needs of local planning, Environment and Planning B: Planning and Design, 27, 923, 2000. 34. Ball, J., Towards a methodology for mapping “regions of sustainability” using PPGIS, Progress in Planning, 58, 81, 2002.
55496_C009.indd 133
8/27/08 11:34:50 AM