The spindle is the organ that performs the milling operation. It is, in fact, a universal motor that has an important rotational speed (up to 30000 rpm) and enough ...
Communications on Applied Electronics (CAE) – ISSN : 2394-4714 Foundation of Computer Science FCS, New York, USA Volume 5 – No.8, August 2016 – www.caeaccess.org
A CNC Machine Fault Diagnosis Methodology based on Bayesian Networks and Data Acquisition Abdelkabir Bacha
Jamal Benhra
Ahmed Haroun Sabry
OSIL Team, LISER Laboratory Ecole Nationale Supérieure d’Electricité et de Mécanique Université Hassan II, Casablanca, Morocco
OSIL Team, LISER Laboratory Ecole Nationale Supérieure d’Electricité et de Mécanique Université Hassan II, Casablanca, Morocco
OSIL Team, LISER Laboratory Ecole Nationale Supérieure d’Electricité et de Mécanique Université Hassan II, Casablanca, Morocco
ABSTRACT In this work, a Bayesian Networks based fault diagnosis system for industrial machines is proposed. For this purpose, an experimental setup of a CNC machine is given as a test rig. This fault diagnosis system is composed of three levels: The first level concerns a set of sensors that are connected directly to the machine’s main organs. The second level is a microcontroller based data acquisition interface that calibrates and transfers the measured data to the third level. The last level is a set of machine learning algorithms that are executed in a computer. These algorithms perform BN structure learning and exploit this structure for classifying the new arrival data from the CNC machine and determining if it presents a faulty or a normal situation.
Keywords Fault diagnosis, Fault detection, Bayesian Networks, CNC machine, Flexible manufacturing, Data acquisition.
1. INTRODUCTION In today’s manufacturing ideologies, machines should be available all the time and they should run with full cadence. So, responsible personnel cannot wait until those machines break down to repair them. Otherwise, it will be a catastrophic situation because of the supplementary costs that will be added due to the non-respect of the production schedule. In real life, such situations may happen often, so in order to overcome this problem, one must have good maintenance strategies. In this perspective, a fault diagnosis/detection system might be very handy and more than welcomed. Many years before now, this was a nearly impossible task. But nowadays, and owing to the advances in artificial intelligence (AI) and machine learning (ML) methodologies, proposing a fault diagnosis/detection system based on AI and ML is becoming more and more accessible. One of the ML methods which will be used in this work is called Bayesian networks (BN). In the fact, BN are formalisms that use uncertain reasoning and give probabilities that will help in making decisions. BN are graphical models that represent reasoning with their network structures and parameters. So, to make them useful, one should find the best BN structure that better represents the studied problem. However, constructing a BN structure requires modeling the knowledge of a domain expert or using another approach which consists of learning the structure from measured data from the studied problem using some algorithms. This second option is desirable, especially when experts are rare to find and are expensive. So learning from data is a more accessible option. Learning from data requires implementing a reliable data acquisition system. In
this paper, a data acquisition (DAQ) interface is proposed in order to feed a BN fault diagnosis/detection system.
2. METHODS & MATERIALS 2.1 Bayesian networks Bayesian Networks (BN) are directed acyclic graphs that represent probabilities of a set of random variables. They have been initiated by J. Pearl et al [1] and other researchers. BN have other denomination such as Belief Networks [2] or Probabilistic graphical Model [3]. BN are based on probability theory, especially the well-known Bayes theorem and the joint probability (see formula (1)). 𝑛
𝑃 𝑋1 , … , 𝑋𝑛 =
𝑃 𝑋𝑖 𝜋𝑖
(1)
𝑖=1
BN can be constructed with different methods, first, they were elaborated manually by modeling the human knowledge, and then many algorithms were conceived especially for automating this task using data [4].
2.1.1 BN parameter learning BN parameter learning is technically trying to estimate probability distributions (or parameters of the relevant laws) from available data. The most used methods for Bayesian networks learning, according to the kind of data in possession, and to their completeness (no values are missing the records) are : statistical learning , Bayesian learning for complete data, while learning with incomplete data uses specific algorithms such as the Expectation Maximization (EM) algorithm BN [4]
2.1.2 BN structure learning Learning a BN structure is, in other words, trying to find the structure that better represents the studied problem. So learning the structure of a Bayesian Network from data means finding a graph representing a perfect map (called a P-map) of an independence model associated with a probability distribution that one has a sample from. So one must be sure of the existence of such P-map (loyalty) and the knowledge of all the variables (causal sufficiency) [4] [5]. Learning the structure of a BN with exact or exhaustive methods is very practically impossible, especially when the number of nodes is important [6]. The formula (2) demonstrates that the number of possible structures for a BN with n nodes is super-exponential. For n = 5, NS(5)= 29281; for n=10, NS(10)= 4.2 × 10¹⁸ [7]
41
Communications on Applied Electronics (CAE) – ISSN : 2394-4714 Foundation of Computer Science FCS, New York, USA Volume 5 – No.8, August 2016 – www.caeaccess.org
𝑁𝑆 𝑛 =
1
,
1
𝑛 𝑖 2 𝑖
𝑛
𝑖=1
𝑖+1
𝑛 = 0 𝑜𝑟 𝑛 = 1 𝑛−1
𝑁𝑆 𝑖 − 1
,𝑛 > 1
(2)
From this, one can imagine how huge can became the space of solutions. So, in order to overcome this problem, many heuristics were proposed. Some of them try to reduce the space of solutions to a space of trees. Some other methods try to be limited in the research of possible parents for each node (like the K2 algorithm [2], [8] ). While some other methods perform a greedy search in the space of the solutions [7].
2.2 Fault diagnosis/detection In the literature, one can find a considerable amount of work concerning fault diagnosis and fault detection of industrial systems. However, there are still some pathways to explore concerning the use of BN in this field. This paper’s approach was inspired by many other works: One can cite as an example the work of [9] where an exploration of the use BN in fault diagnosis of a permanent magnet synchronous machine was done. In [10] BN were used in the fault diagnosis with a new approach to this task, based on the framework of hybrid dynamic Bayesian networks (DBN). Other works were conducted in the same perspective by this paper’s authors such as [11][12] and [13] where BN were applied to fault diagnosis of DC Motors with their power management systems.
2.3 Data acquisition In data-oriented fault detection/diagnosis, there are two major data acquisition techniques, either push- or pullbased data acquisition techniques. In a pull-based data acquisition system, the user defines a query and sends it to the system which will then return the matched value. The frequency the query has to be executed can be determined in the query itself, or by submitting the query in the desired frequency. In push-based data acquisition systems, a formerly described state or a behavior will be communicated by system autonomously whenever values recently changed [14]
2.4 Data preprocessing Data preprocessing consist of cleaning the raw data taken from the data acquisition system, in order to make it usable. This work’s preprocessing is done in two stages. The first stage consists of filtering raw data, by eliminating aberrant and abnormal values. The second stage is the execution of a discretization algorithm in order to transform continuous variables into discrete ones as described in [15].
3. THE PROPOSED APPROACH AND EXPERIMENTAL SETUP This paper's approach can be summarized as the following: first a description of the used industrial machine is giving, where both the hardware and software are described in detail in order to frame the work. The hardware part consists of the main organs that a CNC machine is based on, while the
software part presents the most used computer programs that drive a CNC machine. Secondly, another description of the proposed fault diagnosis/detection system is given. This fault diagnosis/detection system is composed of many subsystems such as the data acquisition interface, the computing device, the used sensors, etc. without forgetting to present all the programs and algorithms that were used in this work. All these parts will be detailed above. The third section is dedicated to describing the used variables. These variables can be measured from the studied machine via the fault diagnosis/detection system or decision variables generated by the fault system. The fourth section concerns the data filtering and preprocessing. The fifth section describes the generated datasets from the fault diagnosis/detection system. And finally, the last section is dedicated to discussing the generated BN structure from the data of the system
3.1 Description of the used industrial Machine The used industrial machine is one of the machines that can be used in a flexible production unit (flexible manufacturing). It is called a CNC machine (CNC: Computer Numeric Control). Figure 6 gives a picture of an experimental CNC machine that was used as test rig for this work.
3.1.1 Hardware of the machine 3.1.1.1 Stepper motors: The studied machine is actuated by 3 stepper motors of the type: NEMA 17. Their technical specifications are given in 1. One example of them is showed in Figure 3. Table 1. Technical specifications of the stepper motors Type Number of steps per revolution
NEMA 17, bipolar 200
Degree by step (angle)
1.8°
Current per phase
1.1 A
3.1.1.2 Stepper motor drivers: The studied CNC machine contains 3 stepper motor drivers that are responsible for transforming the small electrical signals generated by a computer into power electrical ones that can drive the stepper motors with precision and accuracy. They have some features such as regulating the amount of current that passes through each coil of a given stepper motor, and choosing the number of sub-steps per step. Figure 3 shows one of the three used drivers which are based on the TOSHIBA TB6560 chip.
3.1.1.3 The spindle: The spindle is the organ that performs the milling operation. It is, in fact, a universal motor that has an important rotational speed (up to 30000 rpm) and enough power to mill a wide range of materials.
.
42
Communications on Applied Electronics (CAE) – ISSN : 2394-4714 Foundation of Computer Science FCS, New York, USA Volume 5 – No.8, August 2016 – www.caeaccess.org
Figure 1: A typical CNC machine using a microcontroller and GRBL
Figure 2 : One of the used stepper motors
Figure 3 : One of the used stepper motor drivers
Figure 4 : example of a spindle
Figure 5 : example of limit sensors
43
Communications on Applied Electronics (CAE) – ISSN : 2394-4714 Foundation of Computer Science FCS, New York, USA Volume 5 – No.8, August 2016 – www.caeaccess.org
3.1.1.4 Limit sensors: Limit sensors are hardware switches that detect the limit of travel for each axis of the CNC machine. They will be used in this work as an entry for the fault diagnosis/detection system.
3.1.1.5 The microcontroller based G-code interpreter It is a microcontroller based interface that interprets the received G-code from a connected computer via USB port. This interface is managed by the software called GRBL described in next paragraph.
3.1.2 Software of the machine CNC machines are driven by 3 major types of software. The first type is the most professional one. They run in Microsoft windows XP or higher. As an example one can cite mach3 or mach4. The second type runs in Linux environment like Emc2 or LinuxCNC. The third type runs in a microcontroller and it doesn’t need an OS (operating software). One example of this third type is GRBL. The software of the used CNC machine in this work is GRBL. The work [16] is using this software for building a low cost and affordable CNC machine .
3.2 Description of the Fault Diagnosis/Detection system Figure 8 gives a synoptic view of the implementation of the fault diagnosis/detection system in the CNC machine. A description of the system is given in next subsections
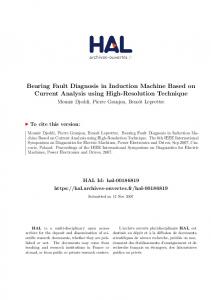
3.2.1 Hardware of the system The hardware of the fault diagnosis system (like one can see in Figure 6) will be discussed in the next paragraphs:
3.2.1.1 The Data acquisition interface The acquisition interface is based on a microcontroller that handles many tasks such as the reception of data from sensors, the analog to digital conversion and the transfer of data via the serial port to the unit that will handle these data. The microcontroller has a clock frequency rated at 16MHz. This will allow it to run those tasks at a very short time, in addition to a faster data transfer. The type of data acquisition’s architecture used in this scope is a push-based architecture as described in [14].
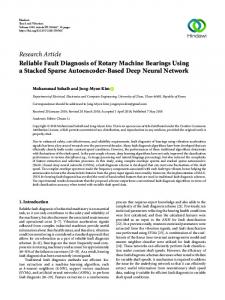
3.2.1.2 The used sensors Current sensors: It is a current measuring device based on the Hall Effect sensor (ACS712). This sensor allows the measurement of current with a perfect isolation, and without the need of the shunt resistor. However, because of its noisy output, this type of sensors needs to be coupled to some digital filters such as statistical mode filter or more sophisticated ones such as Kalman filters. Figure 7 gives a picture of the installation of this type of sensors in the machine.
Figure 6 : Experimental setup of the used CNC machine, and installation of all mentioned sensors in the machine.
Voltage sensors: The voltage measurement is provided by the data acquisition interface by itself, more precisely by the analog to digital converter module (ADC) integrated into the main microcontroller of the interface. And since the measured voltages in these experiments are slightly higher than 5V (the nominal voltage of the used components is about 12V), we added a voltage divider based on resistors to transform the reading range to be between 0 and 5V (maximum allowable voltage of the module the microcontroller. This bridge will decrease the voltage read by multiplying it by a coefficient less than 1. Then, in the microcontroller’s software, we multiply the values read by the analog-to-digital converter by the inverse of the voltage divider ratio for recording the exact values. Limit sensors: Every CNC machine is equipped with limit sensors for safety reasons and for running Homing cycles. The signals that these sensors are generating for the machine are copied electronically into the data acquisition interface to be used the fault diagnosis process. Temperature sensors: For surveying the temperature of the main organs of the CNC machine. This is a necessary feature for diagnosing any possible faulty situation that is related to overheating. For this reason, temperature sensors are installed near these organs:
Figure 7 : A closer look at three current sensors installed near the stepper motor drivers.
steppers drivers
spindle driver
spindle
.
44
Communications on Applied Electronics (CAE) – ISSN : 2394-4714 Foundation of Computer Science FCS, New York, USA Volume 5 – No.8, August 2016 – www.caeaccess.org
Figure 8: Implementation of the fault diagnosis system on the CNC machine.
3.2.2 Software of the system The software of the fault diagnosis/detection system is distributed on two levels: The first level is a program that runs in the data acquisition interface’s main microcontroller as one can see in Figure 8. It has the mission of acquiring raw data from sensors, digital to analog conversions, calibrating and data transmission. The second level is a set of algorithms that run in an Operating System and a computer as it will be described in the next subsections.
3.3 The used variables: In this work, a lot of variables have been used. These variables can be classified in different manners. In fact, there are some variables that are directly measured from the machine; they can be either continuous or Boolean. While there is another variable generated in the computer that runs the learning algorithms. Table 2 gives more details about measured variables, and in Table 3 one can find a list of variables that represent faulty situations. These last variables are added manually in order to perform a supervised learning by adding fault decision to every recorded instance from the measured variables.
3.4 Data filtering and preprocessing The Bayesian networks modeling process begins with a very important task: filtering and cleaning data. This is called feature engineering [14]. Since the major number of variables
in data acquisition concerns continuous variables, it is necessary to discretize them in order to be able to use them in the next phase [17]. Previous works such as [18] and [19] proposed a methodology in this field. For this work, after obtaining a dataset from the system, it was cleaned by deleting manually some aberrant values. Then, a 5 bins unsupervised discretization filtering algorithm was applied for every continuous attribute. This algorithm is available in the open source software called Weka 3.6 [20] [21]. As for Boolean attributes another algorithm called “numerictonominal”, also available in the same software solution, was applied but this time with only 2 bins in order to prepare the ground to the next learning algorithms.
3.5 The BN structure learning specifications For learning a BN structure, (or in other words: learning a BN graph) one must use the cleaned and preprocessed data that will be saved as a dataset with “.csv” format and after with “.arff” format. This use is an execution of a learning algorithm. The used algorithm, in this case, is called K2 algorithm as described in section 2. Table 4 shows this algorithm’s options. For this case, the K2 algorithm is configured to use N= 10. N is the maximum number of parents that a node of the graph can have. RandomOrder was selected as false. This option, as its name indicates, initializes the BN structure in a random order. Markov Blanket Classifier was initialized as false. The score type that was used in this scope is Bayes.
45
Communications on Applied Electronics (CAE) – ISSN : 2394-4714 Foundation of Computer Science FCS, New York, USA Volume 5 – No.8, August 2016 – www.caeaccess.org Table 2 : A list of measured variables and their types Variable
Description
Type
Volt_X
measured voltage from the X axis stepper motor driver
Continuos
Curr_X
measured current from the X axis stepper motor driver
Continuos
Tem_X
measured temperature from the X axis stepper motor driver
Continuos
Lim_X
Status of the X axis travel limit sensor (hit or not)
Boolean
Volt_Y
Voltage measured from the Y axis stepper motor driver
Continuos
Curr_Y
measured current from the Y axis stepper motor driver
Continuos
Tem_Y
measured temperature from the Y axis stepper motor driver
Continuos
Lim_Y
Status of the Y axis travel limit sensor
Boolean
Volt_Z
Voltage measured from the Z axis stepper motor driver
Continuos
Curr_Z
measured current from the Z axis stepper motor driver
Continuos
Tem_Z
measured temperature from the Z axis stepper motor driver
Continuos
Lim_Z
Status of the Z axis travel limit sensor
Boolean
Volt_Spdle
measured voltage from the spindle motor power driver
Continuos
Curr_Spdle
measured Current from the spindle motor power driver
Continuos
Tem_Spdle
measured Temperature from the spindle motor power driver
Continuos
Duty_Cycl_Spdle
measured Duty cycle that controls the spindle motor speed
Continuos
Table 3 : A list of Added variables that represent faults Variable
Description
Type
X_Over_Curr
Over Current fault on X axis stepper motor driver
Boolean
Y_Over_Curr
Over Current fault on Y axis stepper motor driver
Boolean
Z_Over_Curr
Over Current fault on Z axis stepper motor driver
Boolean
Spdle_Over_Curr
Over Current fault on the spindle driver
Boolean
X_Short_Cir
Short circuit fault on X axis stepper motor driver
Boolean
Y_Short_Cir
Short circuit fault on Y axis stepper motor driver
Boolean
Z_Short_Cir
Short circuit fault on Z axis stepper motor driver
Boolean
Spdle_Short_Cir
Short circuit fault on the spindle driver
Boolean
X_Lim_Fault
X axis Limit off travel fault detected sensor activation
Boolean
Y_Lim_Fault
X axis Limit off travel fault detected sensor activation
Boolean
Z_Lim_Fault
X axis Limit off travel fault detected sensor activation
Boolean
Fault
General fault, active when one or more other faults are active
Boolean
Table 4 : The K2 algorithm parameters N: maximum number of parents per node RandomOrder (boolean) MarkovBlanketClassifier (boolien) ScoreType
>= 1 True or False True or False Bayes, BDeu, MDL, AIC, Entropy
4. RESULTS AND DISCUSSIONS Error! Reference source not found. shows the result of the learning phase: it is a Bayesian Network with its CPT (Conditional Probability Table). This BN is now operational and ready for diagnosing new data entries from the system by performing a classification.
46
Communications on Applied Electronics (CAE) – ISSN : 2394-4714 Foundation of Computer Science FCS, New York, USA Volume 5 – No.8, August 2016 – www.caeaccess.org
Figure 9 : The learned BN graph Table 5 : Results of the classification Correctly Classified Instances Incorrectly Classified Instances Mean absolute error Root mean squared error Relative absolute error Root relative squared error Total Number of Instances
249 (100%) 0 (0%) 0.0094 0.0342 3.4711% 9.3263% 249
Table 5 shows different types of calculated indicators that prove the quality of the classification. These were issued from a 10 folds cross-validation test.
(a)
Table 6 : the confusion matrix of the executed classification a 40 0
b 0 209
a=0 a=1
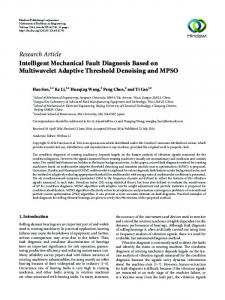
In order to push the test of the BN further, a manual entry was done by forcing some variables to take some known values and watching if any decision variable will change in probability. This is called evidence introduction. For example, in Figure 10 the variable “Y_Short_Cir” models the existence of a short circuit in the driver of the Y axis. The probability that this fault is true before the introduction of the evidence was 08.59% (Figure 10 (a)). But after forcing “Volt_Y” to take a value in the interval [0 ; 4.134V] and “Curr_Y” to take a value in [2.726A ; max], the probability of “Y_Short_Cir” is now 96.86% and this is logic.
(b) Figure 10: States of variables : (a) befor introducing evidences to the variables : Volt_Y and Curr_Y. (b) After introducing evidences
5. CONCLUSION AND PERSPECTIVES This work’s purpose was the attempt to prove that Bayesian Networks are very useful in the diagnosis of industrial machines faults and failures. This was done by designing a fault diagnosis system based on a set of hardware and
47
Communications on Applied Electronics (CAE) – ISSN : 2394-4714 Foundation of Computer Science FCS, New York, USA Volume 5 – No.8, August 2016 – www.caeaccess.org software solutions that was implemented in a flexible production machine. More precisely, the machine was a CNC mill. A description of the hardware of both the CNC machine and the fault diagnosis system was given as well as a description of the used software solutions. After the description, it was shown in the results section, the generated Bayesian Network that was learned from the data. This BN was used in a classification task, with a 10 folds crossvalidation method in order to test its performance in term accuracy. The same BN will be used after for classifying new data entries and determine if they present faulty situations.
6. REFERENCES [1] J. Pearl, Probabilistic reasoning in intelligent systems: networks of plausible inference. Morgan Kaufmann, 2014. [2] G. F. Cooper and E. Herskovits, “A Bayesian method for the induction of probabilistic networks from data,” Machine learning, vol. 9, no. 4, pp. 309–347, 1992. [3] D. Koller and N. Friedman, Probabilistic graphical models: principles and techniques. MIT press, 2009. [4] O. François and P. Leray, “Etude comparative d’algorithmes d’apprentissage de structure dans les réseaux bayésiens,” Rencontres des Jeunes Chercheurs en IA, 2003. [5] D. Margaritis, “Learning Bayesian network model structure from data,” US Army, 2003. [6] G. F. Cooper, “The computational complexity of probabilistic inference using Bayesian belief networks,” Artificial intelligence, vol. 42, no. 2–3, pp. 393–405, 1990. [7] P. Leray, “Réseaux bayésiens: apprentissage et modélisation de systèmes complexes,” Université de Rouen, 2006. [8] G. F. Cooper and E. Herskovits, “A Bayesian method for constructing Bayesian belief networks from databases,” in Proceedings of the Seventh conference on Uncertainty in Artificial Intelligence, 1991, pp. 86–94. [9] N. Z. Kamal MEDJAHER Amine Mechraoui, “Bayesian Based Fault Diagnosis: Application to an Electrical Motor.” . [10] U. Lerner, R. Parr, D. Koller, G. Biswas, and others, “Bayesian fault detection and diagnosis in dynamic systems,” in AAAI/IAAI, 2000, pp. 531–537.
[11] A. Bacha, A. H. Sabry, and J. Benhra, “Design of a data acquisition system to be used in fault diagnosis,” in 2015 Third World Conference on Complex Systems (WCCS), 2015, pp. 1–6. [12] A. Bacha, A. H. Sabry, and J. Benhra, “An industrial fault diagnosis system based on bayesian networks,” International Journal of Computer Applications, vol. 124, no. 5, 2015. [13] A. Bacha, A. H. Sabry, and J. Benhra, “Aide au diagnostic de défaillances des machines industrielles basé sur les réseaux bayésiens,” in Xème Conférence Internationale: Conception et Production Intégrées, 2015. [14] P. Jahnke, “Machine Learning Approaches for Failure Type Detection and Predictive Maintenance,” tudarmstadt, 2015. [15] M. J. Flores, J. A. Gámez, A. M. Mart𝚤nez, and J. M. Puerta, “Handling numeric attributes when comparing Bayesian network classifiers: does the discretization method matter?,” Applied Intelligence, vol. 34, no. 3, pp. 372–385, 2011. [16] M. Y. Javed, S. T. H. Rizvi, M. A. Saeed, K. Abid, O. B. Naeem, A. Ahmad, and K. Shahid, “LOW COST COMPUTER NUMERIC CONTROLLER USING OPEN SOURCE SOFTWARE AND HARDWARE.” [17] J. M. P. José A. Gámez Ana M. Martínez M. Julia Flores, “Handling numeric attributes when comparing Bayesian network classifiers: does the discretization method matter?” [18] C. Peter;Meek Spirtes, “Learning Bayesian Networks with Discrete Variables from Data.” . [19] N. Friedman, M. Goldszmidt, and others, “Discretizing continuous attributes while learning Bayesian networks,” in ICML, 1996, pp. 157–165. [20] I. H. Witten and E. Frank, Data Mining: Practical machine learning tools and techniques. Morgan Kaufmann, 2005. [21] G. Holmes, A. Donkin, and I. H. Witten, “Weka: A machine learning workbench,” in Intelligent Information Systems, 1994. Proceedings of the 1994 Second Australian and New Zealand Conference on, 1994, pp. 357–361.
48