A Comparison of Different Machine Learning Algorithms Using Single Channel EEG Signal for Classifying Human Sleep Stages Khald A. I. Aboalayon1, Wafaa S. Almuhammadi2, Miad Faezipour3 Department of Computer Science and Engineering University of Bridgeport, CT 06604, USA 1 kaboalay, 2walmuham, @my.bridgeport.edu 3
[email protected]
Abstract — In recent years, the estimation of human sleep disorders from Electroencephalogram (EEG) signals have played an important role in developing automatic detection of sleep stages. A few methods exist in the market presently towards this aim. However, sleep physicians may not have full assurance and consideration in such methods due to concerns associated with systems accuracy, sensitivity and specificity. This paper presents a novel and efficient technique that can be implemented in a microcontroller device to identify sleep stages in an effort to assist physicians in the diagnosis and treatment of related sleep disorders by enhancing the accuracy of the developed algorithm using a single channel of EEG signals. First, the dataset of EEG signal is filtered and decomposed into delta, theta, alpha, beta and gamma subbands using Butterworth band-pass filters. Second, a set of sample statistical discriminating features are derived from each frequency band. Finally, sleep stages consisting of Wakefulness, Rapid Eye Movement (REM) and Non-Rapid Eye Movement (NREM) are classified using several supervised machine learning classifiers including multi-class Support Vector Machines (SVM), Decision Trees (DT), Neural Networks (NN), K-Nearest Neighbors (KNN) and Naive Bayes (NB). This paper combines REM with Stage 1 NREM due to data similarities. Performance is then compared based on single channel EEG signals that were obtained from 20 healthy subjects. The results show that the proposed technique using DT classifier efficiently achieves high accuracy of 97.30% in differentiating sleeps stages. Also, a comparison of our method with some recent available works in the literature reiterates the high classification accuracy performance. Keywords- EEG, sleep stages, EEG sub-bands, Machine Learning Algorithms, Butterworth band-pass filter.
I.
INTRODUCTION
A. Background Sleep is the primary function of the brain that has an essential role in every individual’s performance, learning capabilities and physical movement. Humans spend around one third of their life sleeping [1][2]. Sleep is separated into six different stages: Wakefulness, Rapid Eye Movement (REM) sleep and Non-REM (NREM). NREM sleep is further divided into four stages: 1, 2, 3 and 4 according to Rechtschaffen and Kales (R&K) sleep staging criteria [3]. It
978-1-4577-1343-9/12/$26.00 ©2015 IEEE
has been found that the EEG signals in REM and Stage 1 of NREM are similar in nature; this is why this paper merges both stages into one [4][5]. Sleep disorders are considered as one of the major public health issues in recent years. According to [6], more than 90% of depressive disorder patients suffer from sleep disorders. Liang et al [7] reported that sleep diseases such as insomnia and obstructive sleep apnea have a negative impact on the quality of human life. Sleep Apnea is estimated to be common in 2–4% of adults and in 1%–3% of children [8]. In addition, the occurrence of sleepiness is high and has serious effects on the physical health of people. Approximately 33% of the world’s population suffers from insomnia symptoms [3]. According to [7], these sleep issues may cause sleepiness, depression or even death. According to National Highway Traffic Safety Administration in the United States, falling asleep while driving causes at least 100,000 automobile crashes annually; in Germany, one out of four traffic accidents; and in England 20% of traffic accidents [9]. Therefore, the need to distinguish human sleep stages is very important for diagnosis and treatment of sleep disorders such as sleep apnea, insomnia and narcolepsy [10]. Several biomedical signals such as Electroencephalogram (EEG) of the brain waves, Electrocardiography (ECG) of the heart rate, Electromyography (EMG) of muscle activity, and Electrooculography (EOG) of the eye movement provide valuable details for medical configurations that are used in the identification of sleep related disorders [4]. According to [4], the use of EEG signals is stated to be the gold standard for sleep stage recognition including Wakefulness, REM and NREM. Recently, many studies show that single channel EEG signal is an informative input for studying sleep stage recording and classification. According to the 10-20 system, EEG signals can be recorded by placing the electrodes either at C3-A2 or C4-A1 sites on the head of a subject [11]. Thus, the development of efficient sleep stage identification techniques using single channel EEG signal would be very beneficial to analysis, diagnosis and treatment of sleep disorders. B. Related Work
A number of techniques of sleep stage recognition have been presented in the past few years. According to [12], sleep stages classification was addressed based on graph domain features, single channel of EEG signal and multiclass Support Vector Machine (SVM) classifier. The accuracy results of six-state classification are able to attain rates 87.5%. Spectral analysis, Wavelet transform and Fuzzy clustering based on Fuzzy C-Means algorithm (FCM) were used by [13] for an automatic sleep stage detector, which can separate Awake stage, Stage1, Stage2, Stage3, Stage4 and REM stage using single channel EEG signals. The results showed that the algorithm could provide 92.27% success rate when using wavelet packets. Similarly, using single channel EEG signals, an in-flight automatic detection of low vigilance (wake/sleep) states was developed by [14]. The method was based on the comparison of mean values in α, β & θ, ratio [(α + θ)/β] or fuzzy logic fusion (α, β). The results confirm high efficiency of the designed technique during real flights. Another sleep stage classification study was done by Chen et al [15] to estimate sleep stages including Awake, Stage 1 and Stage 2, during daytime naps using four recorded EEGs signals. The proposed method achieved 80.6 accuracy rates based on the Hopfield Neural Network (HNN) classifier. According to [16], a metric learning approach for automatic sleep stage classification based on single channel EEG data was introduced. K-Nearest Neighbor methods were used to classify Awake/Sleep and four sleep stages consisting of Awake, Stage1 + REM, Stage 2 and Slow Wave Stage (SWS). The achieved accuracies were 98.32% and 94.49% respectively. Another previous study was done by [17] that used an SVM based approach classifier to distinguish between awake and drowsy state using three channels of EEG waveforms. The drowsy state was defined as a combination of both sleep Stage1 and Stage2. The results of drowsiness detection approach indicate high accuracy and precision of 98.01% and 97.91% correspondingly. Moreover, Multi-class Support Vector Machine based on EEG and EOG signals was used for an automatic sleep stage detector, which can separate sleep stages in young healthy subjects and elderly patients automatically. The experimental results showed that the proposed algorithm could achive 91% success rate [18]. C. Contribution and Paper Organization In the present work, the major contributions and main characteristics involved in proposing an efficient technique that could easily be implemented in hardware to differentiate between Wake, Sleep Stages1+REM, Stage2, Stage3 and Stage4 are discussed. The proposed approach will enable physicians to identify certain patterns in sleep such as fatigue, drowsiness, and/or various sleep disorders like apnea, insomnia and narcolepsy. The choice of filtering techniques with regards to decomposing the EEG signal into various sub-bands and the selection of features with less computational time for the purposes of classification is a key feature of this proposed methodology. It is based on several machine learning algorithms using a single channel
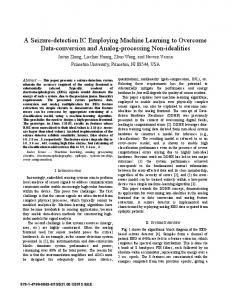
of EEG signals for detection and classification procedure. Butterworth band-pass filters are designed to filter and decompose the EEG signal into five frequency sub-bands: delta wave (0-4Hz), theta wave (4-8Hz), alpha wave (812Hz), beta wave (12-30Hz) and gamma wave (>30 Hz). Then, discriminating features including energy, standard deviation and entropy are computed and extracted from each sub-band. Furthermore, the extracted features are then fed into the five classifiers for sleep stage recognition. In addition to the accuracy, the sensitivity and specificity were also considered to demonstrate the robustness of the proposed method. The experimental results on a number of subjects confirm high classification accuracy of the proposed work. The subsequent structure of this paper is as follows: Section II describes the design principles, methodology and procedure including data acquisition process and data decomposition. Section III presents different statistical features extracted from EEG signals to validate the feasibility of the proposed scheme. Section IV briefly demonstrates the machine learning algorithms used in this work. Section V presents and discusses the experimental and comparison results of the proposed technique. Finally, concluding remarks are provided in Section VI. II. METHODOLOGY AND PROCEDURE A. Proposed Method The overall objective of this work is on building a portable hardware device for sleep stage identification in an effort to assist physicians in the diagnosis and treatment of related sleep disorders. Thus, we focused on methodologies that can be easily implemented on any embedded system device. Figure 1 shows the flow chart of the proposed method including four parts: (1) Acquiring the Input EEG signal, (2) Filtering and Decomposition, (3) Features Extraction, and (4) Machine learning classification. Input EEG signal
Preprocessing Butterworth filter δ, θ, α, β ,γ bands
Feature Extraction Energy – EntropySTD
Classification SVM – DTNN - KNN - NB
Figure 1. EEG sleep stages classification
B. EEG Dataset The dataset used in this work is a publicly available dataset from PhysioNet website [19]. The EEG Sleep-EDF database is a collection of 61 polysomnograms (PSGs) that comes from two diffrent studies obtained in 1987-1991 and 1994, respectively. The first study utilized in this work consists of 20 healthy subjects; 10 males and 10 females, between the ages 25-34. Two PSGs of around 20 hours were recorded each day (including night time) for two days at the subjects' homes. The second night of subject 13, was not available due to a failure in recording cassette. The EEG signals were each sampled at 100 Hz. According to Van, sleep recording contains Fpz-Cz/Pz-Oz EEG signals instead of C4-A1/C3A2 EEG signals [20]. The EEG Fpz-Cz channel is used in this work. Its associated hypnogram files contain sleep
patterns corresponding to each subject. This pattern consists annotated sleep stages: W, 1, 2, 3, 4, R, M movement time and '?' as not scored. All hypnograms were manually scored by well-trained technicians according to Rechtschaffen and Kales manual. Each signal is processed in 60 second timeframes. For the purpose of illustration, Figure 2 shows samples of five different stages of EEG signals, which are used as inputs to the designed filter. Table I shows the number of Wake, Stage1, Stage2, Stage3, Stage4 and REM for each subject. TABLE I. SUBJECTS INFORMATION Subject
W
S1
S2
S3
S4
REM
Sub. 1 Sub. 2 Sub. 3 Sub. 4 Sub. 5 Sub. 6 Sub. 7 Sub. 8 Sub. 9 Sub. 10 Sub. 11 Sub. 12 Sub. 13 Sub. 14 Sub. 15 Sub. 16 Sub. 17 Sub. 18 Sub. 19 Sub. 20
40 50 40 50 50 40 50 75 40 40 40 40 45 40 40 40 40 50 50 52 912
17 42 48 36 81 49 23 48 40 24 30 10 11 52 14 29 36 20 26 25 661
60 40 50 84 76 56 40 50 80 70 80 80 40 50 50 79 75 69 50 50 1229
70 55 47 35 50 83 50 43 53 60 7 44 16 29 53 70 80 70 70 57 1042
60 5 19 32 2 8 52 77 80 39 0 27 27 43 57 54 24 33 99 11 749
23 20 12 23 40 10 10 20 10 18 13 18 20 17 24 10 19 18 14 15 354
Total epochs
(a) Awake EEG signal
the passband and is extremely flat. Minimum order of filter is applied to yield precise and a significantly effective design [10]. The minimum order and cutoff frequencies are defined as N=1/2 × (ln( p/ s)/ln(ωp/ωs)) and ωc= ωs/( s)1/2N respectively, whereas p is pass-band gain, s is stop-band gain, ωp is corner pass-band frequency, and ωs is corner stop-band frequency. The frequencies and amplitudes of δ, , α, β and γ sub-bands during normal condition are shown in Table II [21]. TABLE II. AMPLITUDE AND FREQUENCY RANGE OF DECOMPOSED EEG SIGNAL Rythm Frequency Amplitude
Theta θ 4-8Hz 10µV
Alpha α 8-12Hz 2-100µV
Beta β 12-22Hz 5-10µV
Gamma γ >30Hz -
III. FEATURE EXTRACTION According to the R&K rule, the parameter values corresponding to each EEG sleep stage is different [15]. In this paper, the characteristic parameters are measured based on three sample statistical features for each 60-s EEG data segment called epoch. For classification purposes, below are details about the extracted features at each five sub-bands frequency. A. Energy The power of the signal is represented by the energy at any period of time, which is given by: E
│
│
1
n
6000, 1
i
5
1
B. Entropy The entropy is a mathematical equation that measures uncertain outcomes of signals. It is given by: EN
(b) Stage 1 EEG signal
Delta ∆ 0-4 Hz 20-100µV
log
1
n
6000, 1
i5
2
C. Standard Deviation Standard deviation calculates the distribution of a set of data. The mathematical representation is expressed as:
(c) Stage 2 EEG signal
1
1 1
1
6000
3
(d) Stage 3 EEG signal
IV. MACHINE LEARNING ALGORITHMS (e) Stage 4 EEG signal
Figure 2. Sample EEG Signal (a) Awake, (b) Stage 1, (c) Stage 2 (d) Stage 3 and (e) Stage 4.
C. Data Decomposition The five frequency bands, namely: δ, θ, α, β and γ that are decomposed and filtered using Infinite Impulse Response (IIR) Butterworth band-pass filters for feature extraction process are derived as a result of the input EEG signal. The transfer function of IIR filters is not only simple but also easily realizable on digital signal processers or digital hardware engines, and/or embedded systems. The frequency response of Butterworth filters has no ripple in
In this work, a combination of five classifiers have been used to improve the classification performance of sleep stages using MATLAB tool box. The Support Vector Machine (SVM) is commonly used as a very powerful and flexible tool for the classification of real-world data. SVMs are binary classifiers, in which the objective is to locate a separating hyper-plane in the space between the two classes by mapping the data into a higher dimensional space [22]. For multi-class classification SVM, a "one-against-all" approach combined with linear kernel function was used in this work. It constructs k SVM models where k is the number of classes. Each classifier is trained to separate one class from the rest k-l classes [23].
As non-linear classifier, a Decision Tree (DT) has been mainly used in solving problems related to machine learning and classifier systems. The learning and classification steps of such algorithm are simple, fast and it can handle multidimensional data. The concept of decision tree classifiers is a flowchart-like tree structure in which each decision discards a certain class until reaching the accepted class. It is consisted of nodes, branches, and leaves. Whereas, a node denotes a test on an attribute using transition rules, a branch represents the result of the test, and the leaf holds a class label [24][25]. A Neural Network (NN) is a learning algorithm built for information processing through mathematical or computational model [25]. Neural network typically is a number of interconnected neurons in which each connection has a weight associated with it. During the classification process, it can predict the correct class label of the input layer by modifying the weights. In general, neural network consists of an input layer, one or more hidden layers and an output layer. Selecting the number of hidden layers is different and depends on each application. In practice, one layer is usually used [25]. K-Nearest-Neighbor (KNN) classifier is a nonlinear classifier based on learning by analogy. KNN utilizes different distance metric such as Euclidean and Mahalanobis to achieve good performance. KNN algorithm compares a given unknown test sample with training samples that are stored in an n-dimensional pattern space in order to measure closeness. Nearest-Neighbor assigns the test sample to the most common class among its k closest neighbors [24][25]. Naive Bayes (NB) classifier is a statistical classifier based on Bayes theorem with robust probability and assumption. Naive Bayes classifier is known to be a simple Bayesian classifier which can predict class probabilities by a given tuple belonging to a specific class. The assumption of Bayesian classifier is called class conditional independence, which means that each attribute value of a specific class has independent effects from other attribute values. Theoretically, it is a superior classifier that can guarantee a high classification speed and accuracy when applied to large databases [25]. V.
RESULTS AND DISCUSSION
To assess the performance of our proposed sleep staging method, features were extracted from 4947 60-second epochs from 20 subjects, which were used as our experimental dataset. The work has been implemented using MATLAB R2015a platform. As stated before, EEG signals in REM and Stage 1 of NREM are similar in nature and are merged into one. Hence, this study attempts to classify five sleep stages including Wake, Sleep Stages1+REM, Stage2, Stage3 and Stage4. For classification purposes, several machine learning algorithms were applied to train and test the datasets in different percentage levels: 50% and 50%, 70% and 30%, and 80% and 20%, respectively. The achievement of each classifier is described in the following tables: III, IV, V, VI, and VII. The performance of these
classifiers can be determined by the computation of accuracy, sensitivity and specificity using TP, FP, FN, and TN values [5], where TP is true positives, TN is true negatives, FP is false positives, and FN is false negatives. The equations of accuracy, sensitivity and specificity are shown below: ccuracy Sensitivity Specificity
⁄ ⁄
⁄
4 5 6
I.
Support Vector Machine (SVM) The results of using Multi-class SVM by combining the one-against-all approach with the linear kernel function are described in Table III. The best performance is achieved by training 70% of the data set and testing the other 30%. TABLE III. SVM PERFORMANCE RESULTS Test percentage
20 30 50
Se Sp Se Sp Se Sp
Sleep EEG Classes Stage1+REM
Stage2
Stage3
Stage4
Wake
94.93 97,40 97.32 94.59 95.41 95.33
89.24 98.64 80.00 99.46 82.47 98.92
97.11 86.46 98.38 60.59 97.00 67.22
30.88 99.88 13.10 99.84 56.01 99.51
95.88 99.01 0.00 NaN 0.00 0.00
Acc 85.23 64.08 68.91
II. Decision Tree (DT) From Table IV, it’s clear that the tree structure can separate the sleep stage with large variations. The accuracy rate using 70% for training and 30% for testing of the dataset resulted in over 97%. However, other accuracies did not vary a lot between training and testing set. TABLE IV. DT PERFORMANCE RESULTS Test percentage
20 30 50
Se Sp Se Sp Se Sp
Sleep EEG Classes Stage1+REM
98.61 99.74 99.70 99.73 98.80 99.69
Stage2
Stage3
Stage4
Wake
98.80 99.59 99.17 99.55 98.87 99.35
95.67 98.59 95.14 98,55 94.80 81.10
93.38 98.82 92.71 99.21 90.90 78.76
97.17 99.63 97.75 99.75 98.41 99.65
Acc 97.06 97.30 96.64
III. Nerul Network (NN) The designed networks were trained and tested with 100 hidden neurons. From Table V, the training neural network, which was used to classify sleep stages of the different testing sets, achieved the best average accuracy of 91.7% when 20% samples were used for testing. TABLE V. NN PERFORMANCE RESULTS Test percentage
20 30 50
Se Sp Se Sp Se Sp
Sleep EEG Classes Stage1+REM
Stage2
Stage3
Stage4
Wake
96.8 96.4 98.6 95.2 97.1 94.5
96.3 96.0 95.3 97.8 93.2 95.8
88.6 81.2 88.2 76.1 83.0 80.4
76.0 87.0 69.5 85.6 78.3 80.0
95.6 96.7 94.5 96.7 95.8 97.0
Acc 91.7 90.2 90.1
IV. K-Nearest Neighbors (KNN) Table VI illustrates the classifier output results using default distance metric Euclidean with k neighbors equal to
K-Nearest Neighbors reached best accuracy when 30% of the data set was used for testing. TABLE VI. KNN PERFORMANCE RESULTS
20 30 50
Sleep EEG Classes Stage1+REM
Stage2
Stage3
Stage4
Wake
88.94 97,21 91.09 99.47 86.85 99.55
95.21 96.47 95.61 96.60 96.46 95.78
93.75 90.52 91.90 91.06 93.40 89.85
66.17 98.00 66.01 97.74 62.16 98.20
83.05 99.50 83.89 99.42 86.45 99.45
Se Sp Se Sp Se Sp
Acc 87.36 88.10
400
86.45
300
Accuracy
Test percentage
classifier achieved high performance in separate sleep stages; where the sensitivity and specificity in all stages were better than other classifiers. Overall, DT, NN and KNN achieve best accuracies 97.30, 91.2 and 88.10 in percentages, respectively. The performance result of using multiple classifiers is illustrated in Figure 3.
V. Naive Bayes (NB) As can be seen from Table VII, the result of the statistical classifier produces an accuracy of 84% for all training and testing sets.
20 30 50
20% SVM DT NN KNN NB
Sleep EEG Classes Stage1+REM
Stage2
Stage3
Stage4
Wake
92.16 97.92 94.36 96.33 92.03 96.65
90.03 97.42 85.20 98.03 85.85 97.67
68.26 86.17 70.55 95.06 71.20 93.76
78.67 93.08 80.09 93.34 76.90 94.04
93.22 98.52 91,01 98.27 93.45 98.26
Se Sp Se Sp Se Sp
30%
100 0
TABLE VII. NB PERFORMANCE RESULTS Test percentage
50%
200
Acc
Figure 3. Overall results for each Classifier
84.5 84.1 84.03
The tables above show a detailed comparison of sensitivity and specificity of each sleep stage and overall accuracy for the five analyzed classifiers: SVM, DT, NN, KNN and NB in three different training and testing datasets. It is observed that there is improved performance for DT and KNN classifiers when 70% of the dataset is used for training while 30% is applied for testing; whereas, SVM, NN and NB achieved best accuracy when 20% is used for testing and 80% for training. Also, it’s clear that the DT
Table VIII displays the comparison of our proposed approach with some recent related works on the same EEG EDF Sleep Dataset. In comparison with some of prior work, our approach is higher in terms of classification accuracy. VI. CONCLUSION In this work, the sleep stages identification for a single channel EEG signal based on a novel filtering and classification technique is presented. The experiment is conducted in this work by using a set of machine learning algorithms. The proposed methodology achieves the average classification sensitivity, specificity and accuracy of 96.89%, 99.35% and 97.30% respectively, when the
TABLE VIII. COMPARISON TABLE No
Author name
Technique employed
Number of stages classified
Signal , Size & Test set
Accuracy
Year
1 2 3 4 5 6 7 8 9 10 11 12 13 14 15 16 17 18 19 20 21 22 23 24
Agustina et al Eka et al Estrada et al Sheng et al Chen et al Adnane & Jiang Estrada et al Obayya & Abou-Chadi Zhu et al Ebrahimi et al Herrera et al Yuan et al Li et al Vatankhah et al Zhovna & Shallom Estrada et al Phan et al Raymond & Liang Yu et al Liu et al Mora et al Sirvan et al Liang et al Proposed Method
NN FNGL-VQ-GLVQ Feature Extraction SVM-AASM-Feature selection HNN SVM AR-Feature Extraction Fuzzy Clustering SVM NN-Packet coefficient SVM NN KNN SVM Kullback-Leibler Itakura Distance KNN SVM SVM NN KNN-SVM-GPROP-KANTS SVM DT DT-SVM-NN-NB-KNN
Drowsiness/Alertness = 2 3-NREM/Wake/REM = 5 Stage1/Wake/ REM = 3 2-NREM/ Wake/REM = 4 3-NREM = 3 Sleep/wake = 2 4-NREM/Wake/ REM = 6 4-NREM/ Wake/ REM = 6 4-NREM/ Wake/ REM = 6 3-NREM/ Wake/ REM = 5 2-NREM/ Wake/ REM = 4 Drowsiness/Alertness = 2 2-NREM/ Wake/ REM = 4 NREM/ REM = 2 3-NREM/ Stage5 = 4 4-NREM/ Wake/ REM = 4,2 Awake/Sleep & 3-NREM/ Wake = 2,4 2-NREM/Wake/ REM = 4 Wake/Drowsy = 2 2-NREM/Wake/ REM = 4 3-NREM/ Wake/ REM = 5 (Awake/Sleep) 3-NREM/ Wake/REM =2,5 3-NREM/ Wake/ REM = 5 3-NREM/ Wake/ REM = 5
EEG 10 Subjects MIT-BIH database ECG 10 Subjects Mitra -MIT-BIH database EEG-EOG 10 Subjects NPSG dataset EEG 12 Subjects EEG 10 Subjects ECG 16 Subjects MIT-BIH database EEG 1 Subjects EEG 12 Subjects Cairo sleep database EEG 8 Subjects Sleep EDF database EEG 7 Subjects Sleep EDF database EEG 10 Subjects EEG 10 Subjects EEG 8 Subjects Sleep EDF database EEG Sleep EDF database EEG 25 Subjects EEG- EOG 10 Subjects EEG 4 Subjects Sleep EDF database EEG- MIT-BIH database EEG 16 Subjects CAP Sleep database EEG 7 Subjects Sleep EDF database EOG-EEG-EMG 9 Subjects EEG-EOG Laboratory dataset Coimbra EOG-EEG-EMG4,20 Subjects EEG 20 Subjects Sleep EDF database
86.5%-81.7% 68%-70% 100% 77% 80.6% 78.05% NAN 92.27% 87.5% 93.0% 70% 79.1%-90.9% 81.7% 98% 93.2% NAN 98.3%-94.4% 96.2% 97.64% NAN 70% 95%-93.0% 86.5% 97.30%
2010 2012 2006 2013 2013 2009 2004 2014 2014 2008 2011 2009 2009 2010 2008 2005 2013 2011 2013 2010 2010 2011 2011 2015
Decision Tree based-rule is applied. The filters employed to extract the sub-bands are less complicated; rendering our design easy, rapid and more feasible; hence, making our work not only appealing but also easy to implement in any embedded system/hardware engine as a personalized standalone device for identifying certain patterns such as fatigue, drowsiness, and/or various sleep disorders like sleep apnea. In comparison with certain recently available work on classification of sleep stages, the performance of this proposed work has certain advantages in terms of accuracy and feasibility. REFERENCES [1]
[2]
[3]
[4]
[5]
[6]
[7]
[8]
[9]
[10]
[11]
[12]
[13]
[14]
Y. Li, F. Yingle, L. Gu, and T. Qinye, "Sleep stage classification based on EEG Hilbert-Huang transform, "Industrial Electronics and Applications, 2009. ICIEA 2009. 4th IEEE Conference on, , pp. 3676-3681, 25-27 May 2009. E. Estrada, H. Nazeran, J. Barragan, J.R. Burk, E.A. Lucas, and K. Behbehani, "EOG and EMG: Two Important Switches in Automatic Sleep Stage Classification," Engineering in Medicine and Biology Society, 2006. EMBS '06. 28th Annual International Conference of the IEEE, pp. 2458-2461, Aug. 30 2006-Sept. 3 2006. C. Kuo and S. Liang, "Automatic stage scoring of single-channel sleep EEG based on multiscale permutation entropy," Biomedical Circuits and Systems Conference (BioCAS), 2011 IEEE, pp. 448-45, 10-12 Nov. 2011. F. Ebrahimi, M. Mikaeili, E. Estrada, and H. Nazeran, "Automatic sleep stage classification based on EEG signals by using neural networks and wavelet packet coefficients,"Engineering in Medicine and Biology Society, 2008. EMBS 2008. 30th Annual International Conference of the IEEE, pp. 1151-1154, 20-25 Aug. 2008. Yuelei Liu; Lanfeng Yan; Bo Zeng; Wei Wang, "Automatic Sleep Stage Scoring Using Hilbert-Huang Transform with BP Neural Network," Bioinformatics & Biomedical Engineering (iCBBE), 2010 4th International Conference on, pp. 1-4, 18-20 June 2010. S. Leistedt, M. Dumont, J.-P. Lanquart, F. Jurysta, P. Linkowski, Characterization of the sleep EEG in acutely depressed men using detrended fluctuation analysis, Clinical Neurophysiology, Volume 118, pp. 940-950, Issue 4, April 2007. Sheng-Fu Liang; Chih-En Kuo; Yu-Han Hu; Yu-Shian Cheng, "A rule-based automatic sleep staging method," Engineering in Medicine and Biology Society, EMBC, 2011 Annual International Conference of the IEEE, pp. 6067-6070, Aug. 30 -Sept. 3 2011. Redmond, S.J.; Heneghan, C., "Cardiorespiratory-based sleep staging in subjects with obstructive sleep apnea," Biomedical Engineering, IEEE Transactions on , vol.53, no.3, pp. 485,496, March 2006. K.B.M. Kumari, "Review on Drowsy Driving: Becoming Dangerous Problem, "International Journal of Science and Research (IJSR) Volume 3, pp. 49-51, Issue1, January 2014. A.M. Mora, C.M. Fernandes, L.J. Herrera, P.A. Castillo, J.J. Merelo, F. Rojas, and A.C. Rosa, "Sleeping with ants, SVMs, multilayer perceptrons and SOMs," Intelligent Systems Design and Applications (ISDA), 2010 10th International Conference on, , pp. 126-131, Nov. 29 -Dec. 1 2010. A.R. See and C. Liang, "A study on sleep EEG Using sample entropy and power spectrum analysis," Defense Science Research Conference and Expo (DSR), 2011, pp. 1-4, 3-5 Aug. 2011. Guohun Zhu; Yan Li; Wen, P.P., "Analysis and Classification of Sleep Stages Based on Difference Visibility Graphs From a SingleChannel EEG Signal," Biomedical and Health Informatics, IEEE Journal of , vol.18, no.6, pp. 1813-1821, Nov. 2014. Obayya, M.; Abou-Chadi, F.E.Z., "Automatic classification of sleep stages using EEG records based on Fuzzy c-means (FCM) algorithm," Radio Science Conference (NRSC), 2014 31st National, pp. 265-272, 28-30 April 2014. Sauvet, F.; Bougard, C.; Coroenne, M.; Lely, L.; Van Beers, P.; Elbaz, M.; Guillard, M.; Leger, D.; Chennaoui, M., "In-Flight
[15]
[16]
[17]
[18]
[19] [20]
[21] [22]
[23]
[24] [25]
[26]
Automatic Detection of Vigilance States Using a Single EEG Channel," Biomedical Engineering, IEEE Transactions on ,vol. 61, no.12, pp. 2840-2847, Dec. 2014. Xi Chen; Bei Wang; Xingyu Wang, "Automatic sleep stage classification for daytime nap based on hopfield neural network," Control and Decision Conference (CCDC), 2013 25th Chinese, pp. 2671-2674, 25-27 May 2013. Huy Phan; Quan Do; The-Luan Do; Duc-Lung Vu, "Metric learning for automatic sleep stage classification," Engineering in Medicine and Biology Society (EMBC), 2013 35th Annual International Conference of the IEEE, vol, pp. 5025-5028, 3-7 July 2013. Shaoda Yu; Peng Li; Honghuang Lin; Rohani, E.; Gwan Choi; Botang Shao; Qian Wang, "Support Vector Machine Based Detection of Drowsiness Using Minimum EEG Features," Social Computing (SocialCom), 2013 International Conference on, pp. 827-835, 8-14 Sept. 2013. J. Kempfner, P. Jennum, H.B.D. Sorensen, J.A.E. Christensen, and M. Nikolic "Automatic SLEEP staging: From young aduslts to elderly patients using multi-class support vector machine," Engineering in Medicine and Biology Society (EMBC), 2013 35th Annual International Conference of the IEEE, pp. 5777-5780, 3-7 July 2013. PhysioNet, PhysioBank ATM, http://www.physionet.org/physiobank/database/sleep-edfx. B van Sweden, B Kemp, HAC Kamphuisen, EA van der Velde. Alternative electrode placement in (automatic) sleep scoring (FpzCz/Pz-Oz versus C4-A1/C3-A2). Sleep 13(3):279-283 (1990). CleveLabs Laboratory Course System Manual, Version 6.0, Cleveland. M. Vatankhah, M-R Akbarzadeh-T, and A. Moghimi, "An intelligent system for diagnosing sleep stages using wavelet coefficients," Neural Networks (IJCNN), The 2010 International Joint Conference on, pp. 1-5, 18-23 July 2010. C. Hsu and C. Lin, "A comparison of methods for multiclass support vector machines," Neural Networks, IEEE Transactions on, vol. 13, no. 2, pp. 415-425, Mar 2002. S. Theodoridis, K. Koutroumbas, Pattern Recognition,” Academic Press, pp. 95, 2006. J. Han, M. Kamber, and J. Pei, “Data Mining: Concepts and Techniques”, Morgan Kaufmann Publishers Inc., San Francisco, CA, USA, 3rd edition, 2011. Garcés Correa, A.; Laciar Leber, E., "An automatic detector of drowsiness based on spectral analysis and wavelet decomposition of EEG records," Engineering in Medicine and Biology Society (EMBC), 2010 Annual International Conference of the IEEE, pp. 1405-1408, Aug. 31 -Sept. 4 2010.