embedded in the wall of a nuclear reactor pressure vessel (RPV). The ..... solutions for the C1 embedded-flaw geometry(at Point 1 in. Fig. 1). . Time (minutes). 0. 5. 10. 15. 20. 25. 30. 35. 2. 4 .... U.S. Nuclear Regulatory Policy Issue, 1982, NRC Staff Evaluation ... ABAQUS Theory Manual, Version 5.8, 1998, Hibbit, Karlsson &.
A COMPARISON OF FRACTURE MECHANICS METHODOLOGIES FOR POSTULATED FLAWS EMBEDDED 1 IN THE WALL OF A NUCLEAR REACTOR PRESSURE VESSEL
Terry L. Dickson, B. Richard Bass, and Paul T. Williams Computational Physics and Engineering Division Oak Ridge National Laboratory Oak Ridge, Tennessee USA far by PNNL are of varying sizes and embedded at various locations in the RPV wall, i.e., no surface-breaking flaws were found. Analyses performed at the Oak Ridge National Laboratory (ORNL) [7] showed that embedded flaws postulated to reside close to the inner-surface of an RPV contribute significantly to the conditional probability of cleavage fracture of the RPV during postulated PTS events. It is anticipated that embedded flaws will play a significant role in future RPV structural integrity evaluations; therefore, the need for an accurate (as feasible) KI computational model for embedded flaws provided the motivation for this investigation. Another previous study at ORNL [8-9] compared LEFM Mode I stress intensity factor, KI , solutions for embedded flaws that were generated using the EPRI NP-1181 model [10] (which is an analytical interpretation of the ASME Boiler and Pressure Vessel Code, Section XI, Appendix A, procedure [11]) with KJ solutions from the ABAQUS finite-element computer code [12]. In this current study, solutions generated by a computational method published by Electricité de France (EdF) [13-16] for calculating LEFM KI solutions for embedded flaws were compared with the solutions generated in the previous study [8-9]. The EdF and the EPRI/ASME models include methods for correcting the LEFM KI solutions to approximately account for the effects of plastic deformation. The current study evaluated the EPRI/ASME and EdF LEFM KI solutions, corrected for plasticity, by comparing them with ABAQUS three-dimensional (3-D) elasticplastic fracture mechanics (EPFM) solutions for a limited number of embedded flaw geometries.
ABSTRACT This study continues an investigation of a computational methodology for calculating the Mode I stress intensity factor, KI , for flaws embedded in the wall of a nuclear reactor pressure vessel (RPV). The results generated by a model published by Electricité de France (EdF) for calculating linear-elastic fracture mechanics (LEFM) KI solutions for embedded flaws were compared against solutions previously generated using the EPRI NP-1181 embedded-flaw model (which provides an analytical interpretation of the ASME Boiler and Pressure Vessel Code, Section XI, Appendix A, procedure) and solutions generated using the ABAQUS finite-element computer code. For the flaw geometries examined in the current study, the EPRI / ASME LEFM peak-value KI solutions were in slightly better agreement with ABAQUS LEFM peak-value KI solutions than those generated by the EdF model. The EdF and the EPRI/ASME LEFM KI solutions, corrected to account for plasticity, were benchmarked for three embedded flaw geometries by comparing them with ABAQUS three-dimensional fully elastic-plastic fracture mechanics (EPFM) KJ solutions. The ABAQUS EPFM KJ solutions were significantly higher in magnitude than the ABAQUS LEFM KI solutions. For the limited number of flaws examined, both plasticity-correction methods significantly underpredicted the ABAQUS EPFM peak-value KJ solutions. INTRODUCTION A significant advancement in nuclear reactor pressure vessel (RPV) fracture-related technology is an improved technical basis [1-4] for estimating flaw-related data for RPV material, i.e., the number, location, and size of flaws postulated to reside in an RPV. The computational models from which the current pressurized thermal shock (PTS) regulations [5-6] were derived postulated that all flaws were inner surface-breaking flaws. Some recent nondestructive and destructive examinations of material taken from actual RPVs were performed by Pacific Northwest National Laboratory (PNNL) under contract to the U.S. Nuclear Regulatory Commission (NRC). These examinations revealed a considerably larger number of flaws than were postulated in the earlier analyses. All of the flaws detected thus
IMPLEMENTATION OF EPRI/ASME AND EDF FRACTURE METHODOLOGIES INTO FAVOR CODE FAVOR (Fracture Analysis of Vessels: Oak Ridge) is an advanced computational tool [17-18] that performs deterministic and probabilistic fracture mechanics (PFM) analyses of a clad RPV subjected to complex time-varying thermal-hydraulic boundary conditions imposed on its inner surface. FAVOR-generated thermal, stress, and KI solutions for inner-surface breaking flaws have previously been validated [19] to be within 1-2 percent of ABAQUS 3-D solutions. The current development version of FAVOR has the capability to model inner-surface breaking and/or embedded flaws. Implementation into FAVOR of the various computational fracture models for embedded flaws provides a platform for evaluating these models. The FAVOR implementation included both the
1Research Sponsored by the Office of Nuclear Regulatory Research, U.S. Nuclear Regulatory Commission under Interagency Agreement 1886-8663-1W with the U.S. Department of Energy under Contract DE-AC05-00OR22725 with UT-Battelle, LLC.
1
EPRI/ASME and the EdF LEFM KI models, with and without plasticity correction. Solutions generated by FAVOR using these two methodologies were compared with those obtained from the ABAQUS code.
interface. The through-wall depth (2a) of the flaws in cases B1-B2 is 2.54 mm (0.1 inch), a relatively small flaw. The through-wall depth (2a) of the flaws in cases C1-C3 is 25.4 mm (1.0 inch), a relatively large flaw. Again, in each of these case series (A, B, and C), the location of the inner crack tip is increasingly farther away from the clad/base interface.
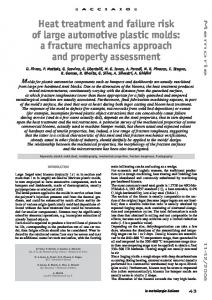
EMBEDDED FLAW MODEL Figure 1 schematically illustrates the RPV geometry and generic embedded flaw used in the benchmarking analyses with relevant descriptive variables,
ABAQUS MODELS A 3-D finite-element model of a 180-degree segment of an RPV shell-wall section containing a planar embedded flaw was constructed for each of the nine flaw geometries in Table 1. The finite-element models utilized 20-node isoparametric brick elements for the main structure. Collapsed prism elements were employed at the crack tip to produce an appropriate singularity for LEFM analyses. A modified version of the ORNL/ORMGEN finite-element mesh generator program [20] was used to generate the nine models. An initial study was carried out to determine the minimum shell length and mesh refinement required to produce model-independent linear-elastic solutions for the temperature, stress, and J-integral distributions. For each flaw geometry, the mesh refinement and axial length of the finite-element model were increased independently until stable J-integral distributions were calculated around the embedded flaw for the duration of the transient, i.e., until the fracture mechanics solution was converged with respect to the mesh refinement. For all ABAQUS analysis results reported herein, J-integrals were converted to KJ using the plain-strain relation
vessel inner surface
t clad = 6.35 mm cladding
base material
Point 1
c
x1 x2
2a
t/2 e
l
Point 2
vessel wall midplane
base material
t =228.6 mm
vessel outer surface
Fig. 1. Geometry and nomenclature used in embedded (subsurface) flaw model.
E KJ = + J 2 1 −ν
where X1 = the distance from the RPV inner (wetted) surface to the inner tip of the embedded flaw at point 1
where E is Young’s modulus of elasticity and ν is Poisson’s ratio. For additional details of the finite-element models used in this study see [8-9].
X2 = the distance from the RPV inner (wetted) surface to the outer tip of the embedded flaw at point 2
(1)
VESSEL MODEL AND MATERIAL PROPERTIES The representative RPV in Fig. 1 had an inside radius of 2286 mm (90 in.), wall thickness, t , of 228.6 mm (9 in.), and clad thickness of 6.35 mm (0.25 in.). The embedded flaw, also shown in Fig. 1, had an elliptical geometry with minor and major axis dimensions defined by the parameters 2a and length, l , respectively. The inner tip of the flaw (Point 1) is located a distance c from the clad/base interface, and the major axis is located a distance e from the midplane (t/2) of the wall. The isothermal thermo-mechanical properties used for the base and cladding materials are given in Table 2. The yield stress of the clad and base material was assumed to be 302.6 MPa (43.9 ksi) and 535 MPa (77.6 ksi), respectively.
e = the distance from the RPV midplane to the midplane of the embedded flaw l = length of the flaw c = distance from the clad-base interface to the inner tip of the embedded flaw at point 1 t = RPV wall thickness MATRIX OF PLANAR EMBEDDED FLAW GEOMETRIES The matrix of embedded flaw geometries for which benchmarking analyses were performed is presented in Table 1 which specifies the parameters describing the flaw geometry, location within the RPV wall, and aspect ratio (length / 2a). The through-wall depth (2a) of the flaws in cases A1-A4 is 17 mm which corresponds to the largest through-wall depth found in material examined in the Pressure Vessel Research User’s Facility (PVRUF) at Oak Ridge National Laboratory (ORNL). The difference in cases A1-A4 is an increasing dimension c, i.e., the location of the inner crack tip is increasingly farther away from the clad-base
LOADING CONDITIONS The thermal transient definition, taken from the NRC/Electric Power Research Institute (EPRI) co-sponsored PTS benchmarking exercise [21], is characterized by a stylized exponentially-decaying coolant temperature. The following formulation expresses the timedependence of the coolant temperature
T (t ) = T f + (Ti − T f ) exp( − β t ) where
2
(2)
T(t)
= coolant temperature at time t
Ti
= coolant temperature at the initial condition, t = 0
Tf
= final coolant temperature
β
= exponential decay constant
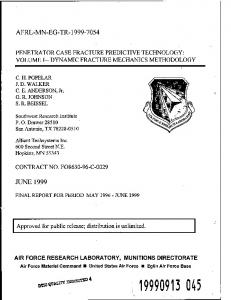
The final coolant temperature, Tf , was 65.56 °C (150 °F) and the decay constant, β, was 0.15 min-1. The initial coolant temperature, Ti , was 287.78 °C (550 °F). The pressure was constant and equal to 6.89 MPa (1 ksi). No through-wall residual stresses were included in the benchmark problems. The initial vessel temperature was set at a constant 287.78 °C (550 °F) through the vessel wall. The convection heat transfer coefficient at the inner surface of the RPV was set equal to a constant value of 5678.27 W/m2-K (1000 Btu/h-ft2-°F); the outer surface was assumed adiabatic. LEFM BENCHMARKING ANALYSIS RESULTS There are implicit and explicit bounds on the flaw-geometry parameters specified in [10] and [11] for the EPRI/ASME model. The previous study [8-9] concluded that for flaw geometries within these bounds, the peak EPRI/ASME KI solutions (at Point 1 of Fig. 1) agreed within approximately 5 percent of the peak ABAQUS LEFM solutions. For flaws considerably outside of the those bounds, but within the region of interest, the EPRI/ASME peak KI values were conservatively higher than the ABAQUS LEFM solutions by up to 13 percent. In the current study, the EdF methodology was used to generate LEFM KI time histories for the entire matrix of embedded-flaw geometries specified in Table 1. Table 3 presents a comparison of the EdF, EPRI / ASME, and the ABAQUS KI LEFM time-history solutions at the peak value of KI. In all but two of the cases, the EPRI/ASME and the EdF LEFM KI solutions are conservative (overpredicted) relative to the ABAQUS solutions. The EPRI / ASME peak-value KI solutions are in better agreement with the ABAQUS solutions for cases A1, A2, A3, C1, C2, and C3, whereas the EdF peak-value KI solutions are in better agreement with the ABAQUS solutions for cases A4, B1, and B2. Figures 2-4 illustrate the LEFM KI time-history solutions at the inner crack tip (point 1 in Fig. 1) for embedded-flaw geometries A1, C1, and C3
Fig. 2. Benchmarking of linear-elastic KI time-history solutions for the A1 embedded-flaw geometry(at Point 1 in Fig. 1). In all three cases, the EdF and the EPRI/ASME LEFM plasticity corrected KI solutions are non-conservative (underpredicted) relative to the ABAQUS EPFM KI solutions (at Point 1 in Fig.1). The EdF peak-value KI solutions are in better agreement with the ABAQUS solutions for cases A1 and C1, whereas the EPRI / ASME peak-value KI solution is in better agreement with the ABAQUS solution for case C3. COMPARISON OF KI AT INNER AND OUTER CRACK TIPS Figure 8 illustrates the ABAQUS and the EPRI/ASME LEFM KI solutions at the inner (Point 1 in Fig. 1) and outer (Point 2 in Fig. 2) crack tips for case A1. The EPRI/ ASME solution at the outer crack tip is also in good agreement with the ABAQUS solution. Noticeably, the KI at the outer crack tip is significantly lower than at the inner crack tip. Figure 9 illustrates the ABAQUS EPFM solutions and the EPRI/ASME LEFM KI solution, corrected for plasticity, at the inner (Point 1 in Fig. 1) and outer (Point 2 in Fig. 2) crack tips for case A1. In both cases, the EPRI/ASME LEFM KI solutions, corrected for plasticity, significantly underpredicts the fully elastic-plastic ABAQUS solutions. As in the case for the LEFM solutions, the KI at the outer crack tip is significantly lower than at the inner crack tip.
EPFM BENCHMARKING ANALYSIS RESULTS ABAQUS 3-D fully elastic-plastic analyses were performed for cases A1, C1, and C3. Significantly, the ABAQUS fully elastic-plastic KJ peak solutions are 20.2 percent, 26.4 percent, and 10.3 percent higher than the ABAQUS LEFM KI solutions for flaw geometries A1, C1, and C3, respectively (see Figs 5-7). The EdF and EPRI/ASME methodologies include adjustments to their LEFM KI solutions that attempt to provide an approximate correction for plasticity effects. The EdF and EPRI / ASME LEFM KI plasticity-corrected solutions were compared with the ABAQUS 3-D fully elastic-plastic KJ solutions. Table 4 presents a comparison of these solutions at the peak value of KI and KJ (at Point 1 in Fig. 1). Figures 5-7 compare the EdF and EPRI/ASME LEFM time-history solutions (at Point 1 in Fig. 1) corrected for plasticity with the ABAQUS 3-D fully elastic-plastic KJ solutions.
3
100 90
linear-elastic fracture mechanics (LEFM) solutions
KI (MPa√m)
80 70 60
EdF ABAQUS EPRI / ASME
50 40 30
Case C1 flaw geometry: depth = 25.4 mm (1 inch) length = 152.4 mm inner crack tip location: 10.15 mm from RPV inner surface
20 10 0 0
5
10
15
20
25
30
35
Time (minutes) Fig. 3. Benchmarking of linear-elastic KI time-history solutions for the C1 embedded-flaw geometry(at Point 1 in Fig. 1).
Fig. 5. Benchmarking of elastic-plastic KI, KJ time-history solutions for the A1 embedded-flaw geometry(at Point 1 in Fig. 1).
. 16
12
10
8
6
Case C3 flaw geometry: depth = 25.4 mm (1 inch) length = 152.4 mm inner crack tip location: 92.05 mm from RPV inner surface
4
5
10
15
20
25
30
100
80
60
ABAQUS linear-elastic solution 40
Case C1 flaw geometry: depth = 25.4 mm (1 inch) length = 152.4 mm inner crack tip location: 10.2 mm from RPV inner surface
20
0
2 0
elastic-plastic solutions: EPRI / ASME ABAQUS EdF
120
KI , KJ (MPa√m)
14
KI (MPa√m)
140
linear-elastic fracture mechanics (LEFM) solutions: EPRI / ASME ABAQUS EdF
0
35
5
10
15
20
25
30
35
Time (minutes)
Time (minutes)
Fig. 6. Benchmarking of elastic-plastic KI, KJ time-history solutions for the C1 embedded-flaw geometry (at Point 1 in Fig. 1).
Fig. 4. Benchmarking of linear-elastic KI time-history solutions for the C3 embedded-flaw geometry(at Point 1 in Fig. 1).
4
16
elastic-plastic solutions EPRI / ASME ABAQUS EdF
KI , KJ (MPa√m)
14
12
10
8
ABAQUS linear-elastic solution Case C3 flaw geometry: depth = 25.4 mm (1 inch) length = 152.4 mm inner crack tip location: 92.05 mm from RPV inner surface
6
4 0
5
10
15
20
25
30
35
Time (minutes)
Fig. 7. Benchmarking of elastic-plastic KI, KJ time-history solutions for the C3 embedded-flaw geometry (at Point 1 in Fig. 1).
Fig. 8. Linear elastic KI time-history solutions at inner crack tip (Point 1) and outer (Point 2) crack tip for the A1 embedded-flaw geometry. CONCLUSIONS Based on the analysis results for the embedded flaws examined in this study, the following conclusions are drawn: (1) For LEFM analyses, the KI peak-value solutions generated with the EPRI/ASME model were in slightly better agreement with the ABAQUS solutions than those generated using the EdF model. (2) The EPRI/ASME embedded flaw LEFM model requires less computational effort than the EdF model due to the numerical integration required by the EdF model. This is an important consideration in a Monte Carlo probabilistic fracture mechanics analysis where millions of embedded KI evaluations are required. (3) ABAQUS EPFM KI solutions were significantly higher than ABAQUS LEFM KI solutions for the three flaws studied herein. (4) ABAQUS LEFM and EPFM KI solutions were significantly higher at the inner crack tip relative to the outer crack tip. (5) The EDF and EPRI / ASME LEFM KI solutions, corrected for plasticity, significantly underpredict the fully elastic plastic ABAQUS KJ solutions.
Fig. 9. ABAQUS EPFM and EPRI/ASME KI solutions, corrected for plasticity, KI time history solutions at inner (Point 1) and outer (Point 2) crack tips for the A1 embedded flaw geometry.
ACKNOWLEDGEMENTS The linear-elastic ABAQUS analyses reported in this paper were carried out by G. E. Giles, Jr., of the Computational Physics and Engineering Division at ORNL. The submitted manuscript has been authored by a contractor of the U.S. Government. Accordingly, the U.S. Government retains a
5
nonexclusive, royalty-free license to publish or reproduce the published form of this contribution, or allow others to do so, for U.S. Government purposes.
11. American Society of Mechanical Engineers Boiler and Pressure Vessel Code, 1998, “Section XI: Rules for Inservice Inspection of Nuclear Power Plant Components, Appendix A, Analysis of Flaws, Article A-3000, Method for KI Determination,” American Society of Mechanical Engineers, New York.
REFERENCES 1. Jackson, D. A., and Abramson, L., 1999, “Report on the Results of the Expert Judgment Process for the Generalized Flaw Size and Density Distribution for Domestic Reactor Pressure Vessels,” U.S. Nuclear Regulatory Commission Office of Research, FY 2000-2001 Operating Milestone 1A1ACE. 2.
3.
12. ABAQUS Theory Manual, Version 5.8, 1998, Hibbit, Karlsson & Sorenson, Inc., Providence, RI. 13. Pellissier-Tanon, A., et al., 1989, “French Experience on the Verification of Pressurized Water Reactor Vessel Integrity,” EPRI Research Project 2975-2.
Schuster, G.J., Doctor, S. R., Crawford, S. L., and Pardini, A. F., 1998, “Characterization of Flaws in U.S. Reactor Pressure Vessels: Density and Distribution of Flaw Indications in PVRUF,” USNRC Report NUREG/CR-6471, Vol. 1, U.S. Nuclear Regulatory Commission, Washington, D.C..
14. Pellissier-Tanon, A., et al., 1991, “Practical Methods for Surface and Sub-Surface Cracks in Reactor Pressure Vessels,” ASME Pressure Vessels and Piping Conference, San Diego, CA. 15. Moinereau, D., et al., 1998, “Some Recent Developments in French Reactor Pressure Vessel Structural Integrity Assessment,” ASME Pressure Vessels and Piping Conference, San Diego, CA.
Schuster, G.J., Doctor, S. R., and Heasler, P.G., 2000, “Characterization of Flaws in U.S. Reactor Pressure Vessels: Validation of Flaw Density and Distribution in the Weld Metal of the PVRUF Vessel ,” USNRC Report NUREG/CR-6471, Vol. 2, U.S. Nuclear Regulatory Commission, Washington, D.C.
16. Moinereau, D., Bezdikian, G., and Faidy, C., 1999, “ThreeDimensional Analysis of a Shallow Subclad Flaw in a PWR Vessel Subjected to a Severe Overcooling Transient,” Fracture, Design Analysis of Pressure Vessels, Heat Exchangers, Piping Components, and Fitness for Service, ASME Pressure Vessels and Piping Conference, PVP-Vol. 388.
4. Schuster, G.J., Doctor, S. R., Crawford, S. L., and Pardini, A. F., 1999, “Characterization of Flaws in U.S. Reactor Pressure Vessels: Density and Distribution of Flaw Indications in the Shoreham Vessel,” USNRC Report NUREG/CR-6471, Vol. 3, U.S. Nuclear Regulatory Commission, Washington, D.C.
17. Dickson, T. L., 1994, “FAVOR: A Fracture Analysis Code for Nuclear Reactor Pressure Vessels, Release 9401,” Technical Report ORNL/NRC/LTR 94-1, Oak Ridge National Laboratory, Oak Ridge, TN.
5. U.S. Nuclear Regulatory Policy Issue, 1982, NRC Staff Evaluation of Pressurized Thermal Shock, SECY 82-465. 6. Dickson, T. L., 1995, “Review of the Pressurized-Thermal Shock Screening Criteria for Embrittled Pressurized Water Reactor Pressure Vessels,” Technical Report ORNL/NRC/LTR-95/39, Oak Ridge National Laboratory, Oak Ridge, TN.
18. Dickson, T. L., 1995, “An Overview of FAVOR: A Fracture Analysis Code for Nuclear Reactor Pressure Vessels,” Transactions of the 13th International Conference on Structural Mechanics in Reactor Technology (SMiRT 13), Volume IV, pp. 701-706.
7. Dickson, T. L., et al., 1999, “Revisiting the Integrated Pressurized Thermal Shock Studies of an Aging Pressurized Water Reactor,” Fracture, Design Analysis of Pressure Vessels, Heat Exchangers, Piping Components, and Fitness for Service, ASME Pressure Vessels and Piping Conference, PVP-Vol. 388.
19. Dickson, T. L., et al., 1995, “Validation of FAVOR Code Linear Elastic Fracture Solutions for Finite-Length Flaw Geometries,” Fatigue and Fracture Mechanics in Pressure Vessels and Piping, ASME Pressure Vessels and Piping Conference, PVP-Vol. 304.
8. Bass, B R., Williams, P. T., and Dickson, T. L., 1999, “Embedded-Flaw KI-Factors: FAVOR Implementation of ASME Section XI-Appendix A Methodology versus Three-Dimensional Finite Element Solutions,” Technical Report ORNL/NRC/LTR99/264, Oak Ridge National Laboratory, Oak Ridge, TN.
20. Bass, B. R., and Bryson, J. W., 1982, “Application of Energy Release Rate Techniques to Part-Through Cracks in Plates and Cylinder, Volume 1, ORMGEN-3D: A Finite-Element Mesh Generator for 3-Dimensional Crack Geometries,” USNRC Report NUREG/CR-2997 Vol. 1 (ORNL/TM-8527/V1), Oak Ridge National Laboratory, Oak Ridge, TN.
9. Dickson, T. L., Bass, B. R., and Williams, P. T., 2000, “Validation of a Linear-Elastic Fracture Methodology for Postulated Flaws Embedded in the Wall of a Nuclear Reactor Pressure Vessel,” Severe Accidents and Other Topics in the RPV Design, ASME Pressure Vessels and Piping Conference, PVP-Vol. 403.
21. Bishop, B. A., 1993, “Benchmarking of Probabilistic Fracture Mechanics Analyses of Reactor Vessels Subjected to Pressurized Thermal Shock Loading, EPRI Research Project 2975—5.
10. Cipolla, R. C., 1979, “Computational Method to Perform the Flaw Evaluation Procedure as Specified in the ASME Code, Section XI, Appendix A,” EPRI Report NP-1181, Electric Power Research Institute, Palo Alto, CA.
6
Table 1. Matrix of Embedded Flaw Geometries for Benchmarking Analyses Case
2a (mm)
length (mm)
c (mm)
a (mm)
e (mm)
l /2a
2a/t
2e/t
A1 A2 A3 A4
17.02 17.02 17.02 17.02
101.6 101.6 101.6 101.6
1.9 8.0 28.6 76.2
8.51 8.51 8.51 8.51
97.5 91.4 70.9 23.2
6 6 6 6
0.074 0.074 0.074 0.074
0.853 0.800 0.620 0.203
B1 B2
2.54 2.54
25.4 25.4
2.5 28.6
1.27 1.27
104.1 78.1
10 10
0.011 0.011
0.911 0.683
C1 C2 C3
25.4 25.4 25.4
152.4 152.4 152.4
3.8 25.4 85.7
12.70 12.70 12.70
91.4 69.9 9.5
6 6 6
0.111 0.111 0.111
0.800 0.611 0.083
Table 2. RPV Material Thermal and Mechanical Properties Property
Units
Cladding
Base
Thermal conductivity
W/m-K Btu/h-ft-°F J/kg-K Btu/lbm-°F GPa ksi
17.31 10.0 502.4 0.12 157.2 22 800 0.3 17.01×10⁻⁶ 9.45×10⁻⁶ 7833 489
41.54 24.0 502.4 0.12 193.0 28 000 0.3 13.99×10⁻⁶ 7.77×10⁻⁶ 7833 489
Specific heat Modulus of elasticity Poisson’s ratio Thermal expansion coefficient Density
K-1 °F-1 kg/m3 lbm/ft3
Table 3. Comparison of ABAQUS, EPRI/ASME, and EdF LEFM Solutions at Peak KI, KJ Case
ABAQUS MPa√m
EPRI/ASME MPa√m
EdF MPa√m
EPRI/ASME EdF % Deviation % Deviation
A1 A2
74.34 64.99
74.64 65.10
70.24 65.47
0.40 0.16
-5.52 0.74
A3 A4
48.71 15.72
46.02 16.56
45.91 15.59
-5.52 5.35
-5.75 -0.83
B1 B2
26.57 16.96
29.80 19.20
27.34 19.01
12.19 13.20
2.90 12.08
C1 C2 C3
86.10 57.33 12.87
84.89 57.45 13.30
87.44 57.95 13.54
-1.41 0.21 3.35
1.56 1.08 5.21
Table 4. Comparison of ABAQUS, EPRI/ASME, and EdF EPFM Solutions at Peak KI and KJ Case A1 C1 C3
ABAQUS MPa√m 102 23 117.00 14.34
EPRI / ASME MPa√m 81 50 92.48 13.80
7
EdF MPa√m
EPRI / ASME % Deviation
EdF % Deviation
91 29 113.70 12.60
-20 28 -20.96 -3.77
-10 70 -2.82 -12.13
8