ed over several other types of samplers (Brinkman and. Duffy 1996, Turner and Trexler 1997), and they are widely used to estimate relative abundances of ...
A COMPARISON OF HORIZONTALLY AND VERTICALLY DEPLOYED AQUATIC INVERTEBRATE ACTIVITY TRAPS Author(s): Miles J. Muscha, Kyle D. Zimmer, Malcolm G. Butler, and Mark A. Hanson Source: Wetlands, 21(2):301-307. 2001. Published By: The Society of Wetland Scientists DOI: http://dx.doi.org/10.1672/0277-5212(2001)021[0301:ACOHAV]2.0.CO;2 URL: http://www.bioone.org/doi/full/10.1672/0277-5212%282001%29021%5B0301%3AACOHAV %5D2.0.CO%3B2
BioOne (www.bioone.org) is a nonprofit, online aggregation of core research in the biological, ecological, and environmental sciences. BioOne provides a sustainable online platform for over 170 journals and books published by nonprofit societies, associations, museums, institutions, and presses. Your use of this PDF, the BioOne Web site, and all posted and associated content indicates your acceptance of BioOne’s Terms of Use, available at www.bioone.org/page/terms_of_use. Usage of BioOne content is strictly limited to personal, educational, and non-commercial use. Commercial inquiries or rights and permissions requests should be directed to the individual publisher as copyright holder.
BioOne sees sustainable scholarly publishing as an inherently collaborative enterprise connecting authors, nonprofit publishers, academic institutions, research libraries, and research funders in the common goal of maximizing access to critical research.
WETLANDS, Vol. 21, No. 2, June 2001, pp. 301–307 q 2001, The Society of Wetland Scientists
NOTE A COMPARISON OF HORIZONTALLY AND VERTICALLY DEPLOYED AQUATIC INVERTEBRATE ACTIVITY TRAPS Miles J. Muscha1, Kyle D. Zimmer1*, Malcolm G. Butler1, and Mark A. Hanson2 1 Department of Zoology North Dakota State University Fargo, North Dakota, USA 58105 2
Wetland Wildlife and Populations Research Group Minnesota Department of Natural Resources Bemidji, Minnesota, USA 56601 * Author for all correspondence Present address: Department of Ecology, Evolution and Behavior University of Minnesota 100 Ecology Building 1987 Upper Buford Circle St. Paul, Minnesota, USA 55108
Abstract: Activity traps are commonly used to develop abundance indices of aquatic invertebrates and may be deployed with either the funnel parallel to the water surface (horizontal position) or facing down (vertical position). We compared the relative performance of these two positions in terms of numbers of invertebrates captured, species richness of samples, detection rates of specific taxa, and community-level characterizations. Estimates of zooplankton abundance were also compared to quantitative estimates obtained using a watercolumn sampler. We used a matched-pairs design where 10 pairs of traps (one horizontal, one vertical) were deployed in each of 4 prairie wetlands on 5 dates in 1999. Vertical traps had higher detection rates and captured greater numbers of adult and larval Coleoptera, Hemiptera, Chaoboridae, hydracarina, cladocera, and Copepoda and also produced samples with greater species richness. Horizontal traps captured greater numbers of Amphipoda and Ostracoda and had higher detection rates for these taxa. Estimates of zooplankton abundance with vertical traps also correlated better with quantitative estimates and indicated greater differences between wetlands than horizontal traps. Both traps showed similar relationships among wetlands and changes through time at the community level, but vertical traps were more sensitive to temporal change. Our results indicate that vertical traps outperform horizontal traps and are preferable for obtaining indices of invertebrate abundance. Key Words:
activity traps, sampling, aquatic invertebrates, species richness, detection rates
INTRODUCTION
high spatial and temporal variability (Hanson et al. 2000). Several types of sampling gear are used, and numerous studies have assessed their relative effectiveness (Kaminski and Murkin 1981, Murkin et al. 1983, Anderson and Smith 1996, Brinkman and Duffy 1996, Hanson et al. 2000). Because they are easy to use and effective, activity traps (ATs) are recommended over several other types of samplers (Brinkman and Duffy 1996, Turner and Trexler 1997), and they are widely used to estimate relative abundances of aquatic invertebrates. Design and deployment techniques of ATs vary, and
Aquatic invertebrates are important components of aquatic ecosystems, playing major roles in energy transfer and nutrient cycling, as well as serving as food resources for vertebrates such as fish, amphibians, and waterfowl (Murkin and Wrubleski 1988, Bouffard and Hanson 1997, Euliss et al. 1999). Numerous studies have identified factors that influence the abundance and community composition of aquatic invertebrates, but characterization of invertebrate communities in complex habitats such as wetlands is difficult due to 301
302
WETLANDS, Volume 21, No. 2, 2001
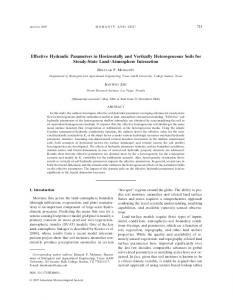
a common question is whether ATs are best deployed vertically (funnel facing down) or horizontally (funnel axis parallel to water surface). Both strategies are commonly used (Swanson 1978, Murkin et al. 1983, Cox et al. 1998, Zimmer et al. 2000), but to our knowledge, their relative effectiveness has not been assessed. Given the diverse behavior of aquatic invertebrates, it seems likely that the relative performance of these two deployment strategies will vary from taxon to taxon. Important criteria in selecting one strategy over the other include the number of individuals captured in each taxon and the ability to detect all organisms present (Turner and Trexler 1997, Hanson et al. 2000). Assessing whether trap types differ in numbers of individuals captured in specific taxa is also important because taxon-specific biases could influence community-level analyses (Cheal et al. 1993). Here, we assess the relative performance of vertically and horizontally deployed activity traps for sampling aquatic invertebrates in prairie wetlands. Specifically, we compared numbers of individuals captured and detection rates of taxa and species richness of samples. We also compared estimates of zooplankton abundance with density estimates and evaluated the influence of deployment position on community-level characterizations. METHODS Our study was conducted in 4 semipermanent wetlands in west-central Minnesota, USA during 1999. All wetlands were located on U.S. Fish and Wildlife Service lands, and the uplands of each site were vegetated with prairie grasses. Average maximum depth of the wetlands was 1.42 m (range 1.22–1.58 m), and average size was 3.57 ha (range 1.58–5.75 ha). Five randomly distributed transects were established in each wetland, with each transect radiating from the wetland center to the edge. Two sampling stations in different habitats were established along each transect—one at the edge of the emergent vegetation and the other in open water one-half the distance from the emergent vegetation station to the wetland center. Two activity traps were deployed within 1 m of each other at each of the 10 stations in each wetland. Trap design followed that of Murkin et al. (1983), and the only difference between traps was deployment position; one of each pair was deployed horizontally and the other vertically (Figure 1). Traps were deployed from anchored buoys with the axis of the horizontal funnel and the orifice of the vertical funnel both 30 cm below the water surface. This design resulted in 10 trap pairs per wetland on each date, 5 in both the open-water and emergent-vegetation habitats. We used a repeated-
measures design with 5 sampling dates, with samples taken every 3 weeks from May through August. On each sampling date, ATs were deployed for 24 hours, and contents were concentrated with a 140 mm mesh funnel and preserved in 70% ethanol. Invertebrates were identified to the lowest feasible taxonomic level and numbers of individuals in each taxonomic group were determined for each trap. We used 34 taxa in our multivariate analysis and to estimate species richness, with species richness defined as the number of taxa per sample. All samples contained at least one taxon. To assess numbers of individuals captured and detection rates, invertebrates were pooled into 11 taxonomic groups: larval Coleoptera, adult Coleoptera, Hemiptera, Chaoboridae, Chironomidae, hydracarina, cladocera, Copepoda, Amphipoda, Ostracoda, and other insects. The group that we designated as ‘‘other insects’’ consisted of Anisoptera, Zygoptera, Trichoptera, and Ephemeroptera. All numbers and species richness data were log10 (n11) transformed to satisfy assumptions of the parametric tests. Differences in log abundance of the 11 taxonomic groups and the differences in log species richness between each trap pair on each date were then determined (vertical-horizontal), giving 40 differences per sampling date. We used repeated measures, paired t-tests to test for differences in species richness and numbers of individuals captured in the 11 taxonomic groups (Hanson et al. 2000). This procedure essentially tests whether the mean difference of the log values differs significantly from zero, or equivalently, whether the ratio of the untransformed data is significantly different from one. The average difference for each variable was then back-transformed to show the catch ratio between the two trap types. Such ratios of backtransformed differences are especially useful because they show the multiplicative improvement of one deployment strategy over the other (Keene 1995). Differences in catch ratios were assessed with the MIXED procedure of SAS (Littel et al. 1996). In all analyses, we maintained an experiment-wise error rate of P ,0.05 by applying a sequential Bonnferoni correction (Rice 1990). We also compared the estimates of cladoceran and copepod abundance from each trap type with quantitative estimates of abundance obtained from column samples (Swanson 1978) taken during the day. Column samples were taken concurrently with ATs deployed in open-water only, as the shallow depths of the emergent stations precluded sample collection. For the column samples, 8.4 L of water were collected at each station on each date and concentrated through a 68-mm mesh funnel. We then determined the average concentration (number/L) of both cladocerans and copepods in the 5 column samples and the average es-
Muscha et al., HORIZONTAL VERSUS VERTICAL TRAPS
303
Figure 1. Illustration of a pair of vertically and horizontally positioned activity traps. Ten such pairs of traps were deployed in each of the 4 wetlands.
timate of relative abundance (number/trap) from both the 5 vertical and 5 horizontal traps set at the openwater stations in each wetland on each date. Estimates for the vertical and horizontal traps in each wetland on each date were then regressed on the corresponding estimate from the column sampler. We used the REG procedure of SAS (SAS 1990b) to estimate the parameters of each regression equation and to test for significant differences in the slopes of the cladoceran and copepod data. Detection rates for the 11 taxonomic groups were determined for both trap types by scoring each trap based on the presence (1) or absence (0) of at least 1 individual in each group. We detected no significant effects of time on detection rates in our 11 taxonomic groups. Thus, we fit a reduced model in which samples were pooled across time, and the detection rates were determined from the 200 samples. To determine whether the detection probability differed significantly between traps, we subtracted the score of the horizontal trap from the score of the vertical trap in each pair. This generated three possible scores for each trap pair (-15 horizontal only, 05 both or neither, 15 vertical only). We then used McNemar’s test to determine whether the marginal probabilities (-1 and 1) were significantly different (Agresti 1996). We used the CATMOD procedure of SAS (SAS 1990a) to estimate and test for significant differences in the detection rates of the two traps, and we maintained an experiment-wise
error rate of P ,0.05 by applying a sequential Bonnferoni correction (Rice 1990). We used principal components analysis (PCA) to assess potential effects of deployment position on community-level characterization. PCA was performed on data from the 400 samples (200 for each type of trap) using the 34 taxonomic groups, with the value of each taxa log10 (n11) transformed to prevent abundant taxa from biasing the results (ter Braak 1995). We then determined average scores along the first and second axes for both the 10 horizontal and 10 vertical traps deployed in each wetland on each date. This produced an average score for each wetland on each of the 5 sampling dates for both trap types. To clarify portrayal of the results, the species scores and scores for each of the 4 wetlands are presented in 5 seperate figures. PCA was performed using CANOCO 4 (ter Braak and Smilauer 1998). RESULTS We detected significantly different catch ratios in nearly all taxonomic groups (Table 1). Vertical traps captured greater numbers of Hemiptera, Chaoboridae, cladocera, adult and larval Coleoptera, Copepoda, and hydracarina and also had greater species richness, while horizontal traps captured greater numbers of Amphipoda and Ostracoda. Other insects and Chironomidae were the only taxonomic groups for which we
304
WETLANDS, Volume 21, No. 2, 2001
Table 1. Average catch ratios of vertically versus horizontally deployed activity traps for 11 taxonomic groups and species richness. The catch ratio represents how may times greater was the abundance of organisms in one trap type relative to the other. The paired t-test (with 39 df) evaluates whether the ratio is significantly different from 1. Variable
Catch Ratio (6 95% CI)
A) Vertical . Horizontal Hemiptera Chaoboridae Cladocera Coleoptera larva Copepoda Adult Coleoptera Hydracarina Species richness Other insects B) Horizontal . Vertical Amphipoda Ostracoda Chironomidae a
t
P
6.20) 3.09) 2.84) 3.69) 2.35) 1.89) 1.32) 1.26) 1.16)
16.14 14.91 7.79 6.37 5.47 6.85 5.99 6.18 0.72
,0.0001a ,0.0001a ,0.0001a ,0.0001a ,0.0001a ,0.0001a ,0.0001a ,0.0001a 0.4782
2.74 (2.23, 3.37) 1.80 (1.44, 2.26) 1.01 (0.91, 1.13)
9.87 5.32 0.24
,0.0001a ,0.0001a 0.8116
5.06 2.91 2.29 2.09 1.87 1.64 1.23 1.19 1.04
(4.13, (2.75, (1.85, (1.97, (1.48, (1.40, (1.15, (1.12, (0.94,
P values adjusted with a sequential Bonnferoni correction.
observed no significant differences in number of organisms captured. Detection rates were also significantly different for most taxonomic groups (Table 2), with the results identical to results of catch ratios. Vertical traps had significantly higher detection rates of Hemiptera, Chaoboridae, cladocera, adult and larval Coleoptera, Copepoda, and hydracarina, while horizontal traps had higher detection rates of Amphipoda and Ostracoda, but no significant difference was observed for Chironomidae or other insects. Estimates of cladoceran and copepod relative abundance from vertical traps agreed better with density estimates determined from the column sampler than did estimates from horizontal traps (Figure 2). Esti-
mates of cladoceran densities from column samples on the 20 wetland-date combinations varied greatly, ranging from 0.32 to 75.3/L. The slope of relative abundance estimates from the vertical traps regressed along this density gradient was significantly greater than the slope for the horizontal traps (F 1,36 514.43; P 50.0005). Density estimates of copepods were also highly variable and ranged from 1.2 to 236.4/L, and the slope of the estimates from vertical traps was again significantly greater than that of the horizontal traps (F1,36 515.43; P 50.0004). Thus, estimates from the vertical traps better reflected patterns in densities of both cladocerans and copepods, while abundance estimates from horizontal traps for both taxonomic
Table 2. Detection rates of 11 taxonomic groups for vertically and horizontally deployed activity traps. Detection rates represent the percent of times a trap captured at least 1 organism. McNemar’s chi square was performed on the 200 trap pairs and tests whether the difference in detection rates (marginal probabilities) is significantly different from zero. Detection Rates (6 95% CI) Variable A) Vertical . Horizontal Hemiptera Chaoboridae Cladocera Coleoptera larva Copepoda Adult Coleoptera Hydracarina B) Horizontal . Vertical Amphipoda Ostracoda Chironomidae Other insects a
Vertical
Horizontal
Difference
McNemar’s Chi Square
P Value
97.0 37.0 89.0 44.5 93.5 67.0 82.0
(94.6, (30.2, (84.6, (37.6, (90.0, (60.5, (76.6,
99.4) 43.7) 93.4) 51.4) 97.0) 73.5) 87.4)
52.0 11.0 68.5 12.0 85.5 38.0 55.5
(45.0, 59.0) (6.6, 15.4) (62.0, 75.0) (7.5, 16.5) (80.6, 90.4) (31.2, 44.8) (48.6, 62.4)
45.0 26.0 20.5 32.5 8.0 29.0 26.5
(37.8, 52.2) (19.1, 32.9) (13.9, 27.1) (24.5, 40.5) (2.7, 13.3) (20.2, 37.8) (18.2, 34.8)
28.70 27.22 22.54 35.91 7.60 29.84 27.74
,0.0001a ,0.0001a ,0.0001a ,0.0001a 0.0059a ,0.0000a ,0.0001a
68.0 38.5 39.5 51.0
(61.5, (31.7, (32.6, (44.0,
74.5) 45.2) 46.3) 58.0)
79.0 54.0 43.0 51.5
(73.3, (47.1, (36.1, (44.5,
11.0 15.5 3.5 0.5
(4.0, 18.1) (8.0, 23.0) (25.2, 12.2) (27.4, 8.4)
8.43 13.86 0.62 0.02
0.0037a 0.0002a 0.4316 0.9013
P values adjusted with a sequential Bonnferoni correction.
84.7) 61.0) 50.0) 58.5)
Muscha et al., HORIZONTAL VERSUS VERTICAL TRAPS
305
wetlands, as well as different temporal patterns among the 4 wetlands. Although variability in the wetlands was high, both trap types indicated similar temporal patterns in community composition. However, greater distances between sampling dates for the vertical traps indicated that this trap design was more sensitive to community change than was the horizontal deployment. DISCUSSION
Figure 2. Relationship between estimates of abundance from vertically and horizontally deployed activity traps (Y axis) and density estimates from column samples (X axis) for cladocerans (top panel) and copepods (bottom panel). Values for the Y axes are the average number per trap for the 5 vertical and 5 horizontal traps deployed at the 5 openwater stations on each date in each wetland. Values for the X axes represent the average density in the 5 column samples taken concurrently with trap deployment in each wetland on each date.
groups were generally poor reflections of density gradients. Our PCA indicated that numerous taxonomic groups varied along the first or second axis (Figure 3). Axis 1 was largely a gradient of increasing abundances of Ceriodaphnia, Cyclopoida, Simocephalus, Chydoridae, Ephemeroptera, and Hirudinoidea and decreasing abundance of Corixidae. Axis 2 was a gradient of increasing abundances of Calanoida, Daphnia, hydracarina, Pleidae, and Chaoboridae and decreasing abundance of Planorbidae. In general, vertical traps had greater scores for axis 2, while horizontal traps had greater scores for axis 1, indicating that vertical and horizontal traps captured greater numbers of taxa positively correlated with axes 2 and 1, respectively. However, these differences were most pronounced on the earlier sampling dates. Catches from both types of traps indicated large temporal variability in 3 of the 4
Several studies have assessed the effectiveness of activity traps relative to samplers such as sweep nets, throw traps, Gerking samplers, and core samplers (Murkin et al. 1983, Brinkman and Duffy 1996, Turner and Trexler 1997); our results indicate that the subtle choice of deployment position may have strong influences on data collected with activity traps. Vertically deployed traps generally outperformed horizontally deployed traps, as vertical traps produced samples with greater species richness, higher numbers of most taxa, and had higher detection rates for most groups analyzed. Additionally, differences in zooplankton densities and temporal changes in community structure were better reflected in the vertical traps. Detection rates and richness of samples reflect the usefulness of a sampler for detecting presence of organisms and for characterizing invertebrate communities; thus, trap performance should be an important criteria when selecting one type of sampler over another (Brinkman and Duffy 1996, Turner and Trexler 1997, Hanson et al. 2000). Failure to detect organisms may be especially important in studies assessing the influence of environmental variables on community composition, as certain multivariate techniques are sensitive to presence or absence of species and species richness of samples (ter Braak 1995, van Tongeren 1995). Thus, vertical traps may be especially useful in multivariate studies. That vertical traps better reflected differences in zooplankton densities is likely due to diel vertical migrations of zooplankton. Horizontal traps have been used successfully to detect differences in abundance of zooplankton among treatment groups of wetlands (Hanson and Riggs 1995, Zimmer et al. 2000). However, our finding of greater variation in estimates of zooplankton abundance across the density gradient may indicate that vertical traps detect smaller differences in abundances between specific sites. Thus, vertical deployment may be better suited for detecting differences in zooplankton abundance among habitats or experimental treatments. Similarly, vertical traps also seem more sensitive to temporal changes at the community level, while still showing the same general patterns of change evident in data from horizontal traps. This may be because vertical traps capture great-
306
WETLANDS, Volume 21, No. 2, 2001
Figure 3. Species vectors and average axis 1 and 2 scores (6 1 standard error) for the 10 vertically and 10 horizontally deployed traps in the 4 wetlands on each of the 5 sampling dates. Species vectors point in the direction of increasing abundance along axes 1 and 2 and describe patterns of species abundances in samples. For each wetland, the hollow data points represent the first sampling date in each wetland (24 May), and the subsequent points are average scores for 14 June, 5 July, 27 July, and 18 August, respectively.
er numbers of most taxa; thus, changes in abundance result in greater changes in the composition of the vertical samples relative to the horizontal samples. Cost of the sampler and the time required to collect and process samples have been evaluated in other studies comparing different samplers (Brinkman and Duffy 1996, Turner and Trexler 1997). These are not considered here, as they are equal for the two deployment strategies. The only logistical difference we are aware
of is that the horizontal traps may be used in shallower water than the vertical traps. Our results indicate that vertically deployed activity traps are superior to horizontally deployed traps for sampling many taxa of aquatic invertebrates, yet costs and logistical aspects are equal. Thus, vertical traps seem preferable for developing indices of abundance for aquatic invertebrates, particularly in habitats where more quantitative samplers are not logistically feasible.
Muscha et al., HORIZONTAL VERSUS VERTICAL TRAPS ACKNOWLEDGMENTS This project was funded by a Frank Cassel Research Award to M. J. Muscha from the Department of Zoology at NDSU and by funding from the Minnesota Department of Natural Resources’ Wetland Wildlife and Populations Research Group, the Gaylord and Dorothy Donnelly Foundation, and Ducks Unlimited, Inc. through the Institute for Wetland and Waterfowl Research, the North Dakota Water Resources Research Institute, and North Dakota EPSCoR. The USFWS Wetland Offices in Detroit Lakes and Fergus Falls, MN provided access to the study sites. This manuscript was improved by comments from two anonymous reviewers. LITERATURE CITED Agresti, A. 1996. An Introduction to Categorical Data Analysis. John Wiley and Sons, New York, NY, USA. Anderson, J. T. and L. M. Smith. 1996. A comparison of methods for sampling epiphytic and nektonic aquatic invertebrates in playa wetlands. Journal of Freshwater Ecology 11:219–224. Bouffard, S. H. and M. A. Hanson. 1997. Fish in waterfowl marshes: waterfowl managers’ perspective. Wildlife Society Bulletin 25: 146–157. Brinkman, M. A. and W. G. Duffy. 1996. Evaluation of four wetland aquatic invertebrate samplers and four sample sorting methods. Journal of Freshwater Ecology 11:193–200. Cheal, F., J. A. Davis, J. E. Growns, J. S. Bradley, and F. H. Whittles. 1993. The influence of sampling method on the classification of wetland macroinvertebrate communities. Hydrobiologia 257: 47–56. Cox, B. B., M. A. Hanson, C. C. Roy, N. H. Euliss, D. H. Johnson, and M. G. Butler. 1998. Growth and survival of mallard ducklings in relation to aquatic invertebrates. Journal of Wildlife Management 62:124–133. Euliss, N. H., D. A. Wrubleski, and D. M. Mushet. 1999. Wetlands of the prairie pothole region: invertebrate species composition, ecology, and management. p. 471–514. In D. P. Batzer, R. P. Rader, and S. A. Wissinger (eds.) Invertebrates in Freshwater Wetlands of North America: Ecology and Management. John Wiley, New York, NY, USA. Hanson, M. A. and M. R. Riggs. 1995. Effects of fish predation on wetland invertebrates: a comparison of wetlands with and without fathead minnows. Wetlands 15:167–175. Hanson, M. A., C. C. Roy, N. H. Euliss, K. D. Zimmer, and M. G.
307
Butler. 2000. A surface-associated activity trap for capturing water-surface and aquatic invertebrates in wetlands. Wetlands 20: 205–212. Kaminski, R. M. and H. R. Murkin. 1981. Evaluation of two devices for sampling nektonic invertebrates. Journal of Wildlife Management 45:493–496. Keene, O. N. 1995. The log transformation is special. Statistics in Medicine 14:811–819. Littell, R. C., G. A. Milliken, W. W. Stroup, and R. C. Wolfinger. 1996. SAS System for Mixed Models. SAS Institute Inc., Cary, NC, USA. Murkin, H. R. and D. A. Wrubleski. 1988. Aquatic invertebrates of freshwater wetlands: function and ecology. p. 239–249. In D. D. Hook, W. H. Mckee, H. K. Smith, J. Gregory, V. G. Burrell, M. R. Devoe, R. E. Sojka, S. Gilbert, R. Banks, L. H. Stolzy, C. Brooks, T. D. Matthews, and T. H. Shear (eds.) The Ecology and Management of Wetlands. Volume 1: Ecology of Wetlands. Croom Helm, London, England. Murkin, H. R., P. G. Abbott, and J. A. Kadlec. 1983. A comparison of activity traps and sweep nets for sampling nektonic invertebrates in wetlands. Freshwater Invertebrate Biology 2:99–106. Rice, W. R. 1990. A consensus combined P-value test and the family-wide significance of component tests. Biometrics 46:303–308. SAS (Statistical Analysis Systems). 1990a. SAS/STAT User’s Guide, volume 1, fourth edition. SAS Institute, Cary, NC, USA. SAS (Statistical Analysis Systems). 1990b. SAS/STAT User’s Guide, volume 2, fourth edition. SAS Institute, Cary, NC, USA. Swanson, G. A. 1978. Funnel trap for collecting littoral macroinvertebrates. Progressive Fish-Culturist 40:73. ter Braak, C. J. F. 1995. Ordination. p. 91–173. In R. H. G. Jongman, C. J. F. ter Braak, and O. F. R. van Tongeren (eds.) Data analysis in community and landscape ecology. Cambridge University Press, Cambridge, England. ter Braak, C. J. F. and P. Smilauer. 1998. CANOCO Reference Manual and User’s Guide to Canoco for Windows: Software for Canonical Community Ordination, Version 4. Microcomputer Power, Ithaca, NY, USA. Turner, A. M. and J. C. Trexler. 1997. Sampling aquatic invertebrates from marshes: evaluating the options. Journal of the North American Benthological Society 16:694–709. von Tongeren, O. F. R. 1995. Cluster analysis. p. 174–212. In R. H. G. Jongman, C. J. F. ter Braak, and O. F. R. van Tongeren (eds.) Data Analysis in Community and Landscape Ecology. Cambridge University Press, Cambridge, England. Zimmer, K. D., M. A. Hanson, and M. G. Butler. 2000. Factors influencing invertebrate communities in prairie wetlands: a multivariate approach. Canadian Journal of Fisheries and Aquatic Sciences 57:76–85. Manuscript received 10 October 2000; revisions received 18 January 2001; accepted 20 February 2001.