A computational兾functional genomics approach for the enrichment of the retinal transcriptome and the identification of positional candidate retinopathy genes Nicholas Katsanis*†‡§, Kim C. Worley*¶, Guillermo Gonzalez*, Stephen J. Ansley†, and James R. Lupski*储** Departments of *Molecular and Human Genetics and 储Pediatrics, **Texas Children’s Hospital, Baylor College of Medicine, Houston, TX 77030; and †Institute of Genetic Medicine, ‡Wilmer Eye Institute, Johns Hopkins University, Baltimore, MD 21287 Edited by Jeremy Nathans, Johns Hopkins University School of Medicine, Baltimore, MD, and approved August 29, 2002
Grouping genes by virtue of their sequence similarity, functional association, or spatiotemporal distribution is an important first step in investigating function. Given the recent identification of >30,000 human genes either by analyses of genomic sequence or by derivation兾assembly of ESTs, automated means of discerning gene function and association with disease are critical for the efficient processing of this large volume of data. We have designed a series of computational tools to manipulate the EST sequence database (dbEST) to predict EST clusters likely representing genes expressed exclusively or preferentially in a specific tissue. We implemented this tool by extracting 40,000 human retinal ESTs and performing in silico subtraction against 1.4 million human ESTs. This process yielded 925 ESTs likely to be specifically or preferentially expressed in the retina. We mapped all retinal-specific兾predominant sequences in the human genome and produced a web-based searchable map of the retina transcriptome, onto which we overlaid the positions of all mapped but uncloned retinopathy genes. This resource has provided positional candidates for 42 of 51 uncloned retinopathies and may expedite substantially the identification of disease-associated genes. More importantly, the ability to systematically group ESTs according to their predicted expression profile is likely to be an important resource for studying gene function in a wide range of tissues and physiological systems and to identify positional candidate genes for human disorders whose phenotypic manifestations are restricted to specific tissues兾 organs兾cell types.
T
he near completion of the draft sequence of the human genome has predicted ⬎30,000 genes (1, 2), and recent data suggest that the actual number may be even higher (3, 4). Despite the partially fulfilled expectation that positional cloning efforts will be assisted by such information (5), the progression from mapping a phenotype to identifying the causative gene remains arduous, as genetic mapping typically results in critical intervals of several Mb in length that can contain ⬎100 genes. In the absence of biological clues, disease gene candidacy is often assessed by expression profiling, whereby genes expressed specifically or preferentially in the tissue(s) affected by the disorder are prioritized for screening. Expression profiling has been particularly successful in ophthalmic genetics, likely in part because 24 of the 51 cloned genes associated with pure Mendelian retinal phenotypes (RetNet: www.sph.uth.tmc.edu兾RetNet) are specifically or preferentially expressed in the retina. The observed concordance between tissuespecific expression and disease has led to targeted efforts to identify retinal-specific genes by various means, including subtractive hybridization (6), database mining of the TIGR gene index (7–9), expression profiling of custom-made retinal cDNA libraries (10, 11), or, more recently, serial analysis of gene expression (SAGE; refs. 12–14). Some of these efforts have led to the identification of retinal disease genes, such as RP1 (15), AIPL1 (16), and CRB1 (17, 18). We hypothesized that it may be possible to expedite the cloning of some of the retinopathy loci for which the gene remains elusive 14326 –14331 兩 PNAS 兩 October 29, 2002 兩 vol. 99 兩 no. 22
by using the EST databases to selectively extract novel cDNA sequences that fulfill restricted expression criteria. The human subset of EST database (dbEST) currently contains ⬎4 million sequences from ⬎100 different tissues and cell types, including the retina and other intraocular structures. We reasoned that, given this diversity and the size of dbEST, any retinal cDNA that matches ESTs from only this tissue has a higher likelihood of representing a gene that is either preferentially or specifically expressed in the retina. The combination of in silico and subsequent in vitro expression information coupled to mapping data would likely generate an enriched human retinal transcriptome map and colocalize new retinal-specific兾preferential genes to genetically defined regions of ocular disease. Although genes important to retinal function yet expressed in other tissues as well would be missed, a substantially enriched retinal-specific transcriptome would serve as a tool for expediting the identification of some 47% of uncloned human retinopathy loci. We therefore designed a series of computational manipulations to identify ESTs that fulfill preset selection criteria accurately and efficiently, followed by a series of mapping and expression analyses. We incorporated all subtraction, expression, and mapping data into an interactive database, RETBASE, through which we have identified candidate genes for 42 of 51 uncloned retinopathy loci. Methods Manipulations of dbEST. We retrieved dbEST sequence entries from
GenBank via file transfer protocol (ftp) and converted them to GenBank reports and FASTA-formatted sequence files by using the NCBI toolkit. We then extracted unique identifiers (gi numbers) of the sequences in the libraries to a table of gi number and library number. We applied REPEATMASKER (http:兾兾ftp.genome.washington.edu兾RM兾RepeatMasker.html) to remove all repeats from the collection and eliminated any ESTs that, because of either poor quality sequence (we defined the end of high-quality sequence to be 40 bp before the first ambiguous base) or repeats, contained ⬍50 bp of unique sequence. We also considered the possibility that a particular EST is part of a higher-order repeat, which would not be detected by REPEATMASKER. This possibility was assessed by performing BLASTN and BLAT searches against human genomic sequence and removing ESTs that localized to multiple independent genomic sequence segments. Subsequent to repeat analysis, we assessed which ESTs belonged to the same transcript. To minimize the potential loss of information caused by alternative splicing, partially spliced ESTs, or sequences corresponding to overlapping genes, we composed clusters whose constituent sequences exhibited ⬎98% identity to each other over 90% or more of each EST by This paper was submitted directly (Track II) to the PNAS office. Abbreviation: dbEST, database of ESTs. §To
whom correspondence should be addressed. E-mail:
[email protected].
¶To
whom computational queries should be addressed. E-mail:
[email protected].
www.pnas.org兾cgi兾doi兾10.1073兾pnas.222409099
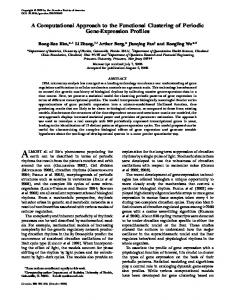
Fig. 1. Schematic representation of the in silico subtraction process. The generalized schema is shown as applied to the subtraction of retinal ESTs. Given the flexibility of altering user-defined search criteria, this generic schema can be applied to any tissue with significant representation in dbEST (minimum 5,000 clones).
Mapping. We mapped all ESTs with a combination of in vitro and in silico experiments as described (19). Because of the error rates in genome assembly, both in gross chromosomal as well as fine mapping reported by us and others (19–21), we mapped each EST against all available (public and private) human genome assemblies. We mapped ESTs to genomic sequence from the public consortium builds 27 and 28 with the BLAT (22) search engine (http:兾兾 genome.ucsc.edu兾cgi-bin兾hgBlat?db⫽hg7) and to the Celera human genome sequence by BLASTN. Any clones exhibiting discordance between any two assemblies were mapped independently in the human genome with the Genebridge 4 radiation hybrid panel and a monochromosomal hybrid panel as described (19). RETBASE. The RETBASE web site was developed in Perl by using CGI
and DBI libraries with image maps of ideograms used to display locations of markers used in the search. The RETBASE backbone is an ORACLE database containing tables for marker information, RETBASE EST information, retinopathy information, and implementation information. During the development of RETBASE, EST data files were processed by using Java, shell scripting, and XML. Expression Studies. We ascertained the expression profiles of 118 randomly selected sequences by amplifying 150–250 bp amplicons from the human multiple tissue adult cDNA panels I and II, the Katsanis et al.
human fetal cDNA panel and retina mRNA (CLONTECH). Primers were designed by using the best available sequence of each EST, as defined by the presence of the first base ambiguity in each sequence read. Primer sequences were compared with genomic sequence for uniqueness and to ensure that no sequencing errors or known polymorphisms mapped within the primer region. Results Manipulation of the EST Database. We selected suitable template
sequences for subtraction by querying dbEST and downloading all sequences that originated from retinal cDNA libraries, which led to the generation of 40,000 independent sequence files, each representing a putative transcript expressed in adult and fetal retinal. The overwhelming majority of ESTs are produced by directionally cloning cDNA, which has in turn been generated from mRNA by oligo(dT) priming. Therefore, with the exception of rare reversed clones and human error, the majority of 3⬘ end EST sequences typically encompass 3⬘ UTR and possibly a portion of the 3⬘ end of the ORF. To enrich for 3⬘ UTRs, and thus minimize the potential for mapping errors and misalignments caused by gene families, we restricted our initial subtractions to 3⬘ ESTs only to construct unique sequence clusters. In addition, we performed a series of filtering steps to eliminate redundancy, poor quality sequence, and repeats within our collection (Fig. 1, see Methods for more details).
In Silico Subtraction. We used the filtered EST set, comprised of ⬇22,000 clusters, to search by BLASTN the human subset of dbEST with a maximum acceptable cutoff P value of 1⫺10. We evaluated all BLAST output files by screening for ESTs that identified themselves and兾or other ESTs from retina but no other tissue. The only exception to this criterion was the inclusion of ESTs from pineal gland, because of the extensive transcriptional overlap between the two organs (8, 23), exemplified by genes like CRX and AIPL1 that are expressed in these two tissues and are also mutated in retinal dystrophies (16, 24). We identified 528 discrete, nonoverlapping EST clusters that fulfilled our search criteria; 340 sequences were present only once PNAS 兩 October 29, 2002 兩 vol. 99 兩 no. 22 兩 14327
GENETICS
using programs such as GAP and PILEUP from the GCG Version 9 sequence analysis package (University of Wisconsin). Although the application of a highly stringent filter was likely to introduce redundant entries of multiple clusters that represented the same gene, we predicted that this issue could be solved at the mapping stage of the analysis, as all clusters from the same transcript would align to the same genomic sequence segment. Furthermore, redundant clusters would be useful in assessing internal reproducibility as well as ensuring that the maximum sequence from any given transcript was included for analysis. Finally, we performed BLAST searches against the nonredundant subdivision of GenBank (nr) and annotated all clusters matching known retinal disease genes, because they represent an important internal control sequence set.
Table 1. Retrospective subtraction of 51 known retinal disease genes Locus LCA2, RP20, RPE65 STGD1, RP19, ABCR CRB1, RP12 USH2A EFEMP1, DHRD, MTLV MERTK ACHM2, RMCH2, CNCG3, CNGA3 SAG GNAT1 OPA1 USH3A RHO, RP4 PROML1 CSNB3, PDE6B CNGA1, CNCG, CNCG1 PDE6A RDS, RP7 ELOV4, STGD3 COD3, GCAP1, GUCA1A CNGB3 RP1 RGR RBP4 ROM1 USH1C VMD2 RDH5, RDH1 RB1 RHOK, RK NRL, RP27 RPGRIP1 NR2E3 RLBP1, CRALBP RP13 PDE6G, CSNB3 AIPL1, LCA4 CNGB1 GUCY2D, CORD6, LCA1, RETGC1 HRG4 RP11 CORD2, CRX RS1, XLRS1 RPGR, RP3 RP2 CSNB2, CSNBX2, CACNA1F NYX, CSNB1 CHM, REP1 TIMM8A NPD, EVR2 CBP, RCP CBD, GCP
GenBank accession no. XM㛭001366 NM㛭000350 NM㛭012076 AF055580 U03877 NM㛭006343 XM㛭002495 NM㛭000541 X15088 XM㛭039926 AF388366 NM㛭000539 NM㛭006017 NM㛭000283 NM㛭000087 NM㛭000440 NM㛭000322 NM㛭022726 NM㛭000409 AF228520 AF141021 NM㛭002921 NM㛭006744 L07894 NM㛭012139 NM㛭004183 U43559 NM㛭000321 U63973 U95012 AF227257 XM㛭007570 NM㛭000326 NM㛭006445 NM㛭000283 AF148864 NM㛭001297 AJ222657 U40998 NM㛭015629 NM㛭000554 AF018958 NM㛭000328 AJ007590 AJ224874 NM㛭022567 X78121 NM㛭004085 M36981 M13300 NM㛭000513
Retina EST
Other EST
Yes Yes Yes Yes Yes Yes Yes Yes Yes (90%) Yes Yes Yes Yes Yes Yes Yes (90%) Yes No Yes Yes Yes Yes Yes Yes Yes Yes Yes Yes No Yes Yes Yes Yes Yes Yes (90%) Yes Yes Yes Yes Yes Yes No Yes Yes Yes No No Yes Yes Yes Yes
No Yes Yes No Yes Yes Yes No Yes (10%) Yes No No Yes Yes Yes Yes (10%) Yes Yes No No No No Yes Yes Yes Yes Yes Yes No No Yes No Yes Yes Yes (10%) No No No Yes Yes No No Yes Yes No No Yes Yes Yes No No
Subtracted Yes
Yes
Yes Yes* Yes Yes
Yes*
Yes Yes Yes Yes
Yes Yes
Yes* Yes Yes Yes
Yes
Yes
Yes Yes
Genes are listed according to their position in the human genome. We queried whether each gene (i) was represented in dbEST as a retinal EST, (ii) matched ESTs from other tissues, and (iii) had been subtracted by our algorithms. Three genes, NYX, RHOK, and RS1, are not present at all in the nontumor portion of dbEST. An additional two genes, CHM and ELOV4, are not represented in dbEST as retinal ESTs. We were able to predict retina specificity for 22 of 51 loci; of the remaining genes missed by our prediction, only one, ABCA4, has been shown to be expressed specifically in the retina. *Note that GNAT1, PDE6A, and PDE6G were identified only after less stringent criteria were implemented whereby if 90% of matched ESTs were from retina, the query sequences were also retained.
in the database, whereas the remaining 188 sequences were present multiple times. Of these, 91 were found in at least two retinal EST libraries, thus increasing the likelihood that they represented bona fide transcripts and not library artifacts. To determine the fidelity of this process, we also examined in greater detail 1,000 random BLAST outputs of rejected clones. We observed 24 biologically illegitimate rejections caused by matches of the query sequence to ESTs of tumor origin such as those generated by the Cancer Genome Anatomy Project (CGAP) (25). Given that aberrant 14328 兩 www.pnas.org兾cgi兾doi兾10.1073兾pnas.222409099
expression is not uncommon in tumors, we postulated that sequences matching retinal ESTs as well as ESTs from tumor origin may still represent retina-specific兾predominant genes. Also, in 17 instances, ⬎90% of the BLAST ‘‘hits’’ to our query EST were to retinal ESTs, but 10% were not. Such examples are likely to represent genes preferentially but not specifically expressed in the target tissue and may thus be equally important for the development of a retinal candidate gene map. To address these issues, we repeated the analysis of the entire Katsanis et al.
Fig. 2. Examples of RT-PCR of random retinal ESTs on adult and fetal human tissues. Although a minority of ESTs were shown to exhibit a wide spatiotemporal pattern of expression, most ESTs either amplified the expected amplicon from only retina, or from retina and other developmental tissues. Of the 14 ESTs shown, only two recognize known or predicted genes in GenBank: AA054635 matches a predicted mouse gene (dj402N21.2; accession no. XM㛭139857) and AA059474 matches the hypothetical human gene LOC166538 (accession no. XM㛭093929). Note that in four examples (AA057411, AA121808, AA219176, and AA059474) a band of different size is also present in nonretinal tissues, raising the possibility that some ESTs in our collection may represent tissue-specific splice variants of known genes. BLAST collection but altered the requirements to (i) ignore matches
to sequences from tumor libraries and (ii) accept sequences for which 90% or more of matches were to retinal ESTs. At the conclusion of the modified analysis, we identified 925 nonredundant clusters.
Evaluation of the Subtraction Dataset. For any database manipula-
GENETICS
tion to be applicable to molecular biology investigations, compu-
tationally predicted data must reflect physiological reality. We therefore queried our tissue-specificity predictions by testing our dataset against known retinal genes whose expression profile and disease involvement have been determined experimentally. We hypothesized that if our approach had been successful, a substantial proportion of genes known to be specifically expressed in the retina should be identified by our subtraction, except for genes that were either not represented by ESTs, or were represented in nonretinal libraries because of artifacts, such as genomic contaminants or misannotation errors. Several lines of evidence indicate that our in silico subtraction protocol enriched substantially our EST collection for genes specifically or preferentially expressed in the retina. First, a retrospective study using all known genes associated with a retina-specific phenotype indicated significant concordance between the expected results and the computational predictions, with 22 of 51 (43%) of all retinopathy genes identified by our algorithm (Table 1). This represents 88% (22 of 25) of the known retinal disease genes with expression reportedly restricted or enriched in the retina. Of the three genes missed by our approach, RHOK and RS1 are not represented in dbEST, and ABCA4 is expressed only in the retina (26), yet our program predicts it to be expressed in other tissues because of the identification of ABCA4 ESTs from liver, heart, and testis. Second, we determined that 3,255 of the 1,502,455 ESTs in human dbEST represented retinal disease genes (1:461.5). By contrast, our collection contained 71 of 925, or 1:13. This represents an enrichment for retinal disease genes by at least a factor of 35.5, given that potentially many retinal disease genes remain to be identified among the denominator of 925. Third, periodic revisiting of GenBank identified new matches of some of our ESTs with genes that during the progress of this work had been cloned independently and shown, in some instances, to cause retinal disease (see Table 2, which is published as supporting information on the PNAS web site, www.pnas.org). Notable examples include the retina-specific gene
Fig. 3. Pictorial representation of the chromosomal localization of all retinal ESTs on a metric map of the human genome. Because of the current fluidity of genome assembly as indicated by the variation in the fine-mapping position of Mb-long segments between different builds, the metric map was constructed on a cR3000 backbone with cross-references to genomic sequence. Each blue horizontal line represents the position of a subtracted EST as determined by computational methods, hybrid mapping, or, when different versions of the human genome were discordant, both.
Katsanis et al.
PNAS 兩 October 29, 2002 兩 vol. 99 兩 no. 22 兩 14329
Fig. 4. Screenshots from RETBASE (http:兾兾hgsc.bcm.tmc.edu兾RetBase). (Upper) A map-based search on the X chromosome is shown, in which two positions have been selected with the mouse cursor. These positions have been translated into cR3000 units on the linear map (cR positions automatically inserted in the appropriate boxes). Query intervals can also be defined by centirad (cR3000) positions inserted in query boxes, microsatellite markers expressed as ‘‘D’’ numbers or Genethon ‘‘AFM’’ numbers both textually and via a drop-down list, or cytogenetically through a dynamic screen interface that permits the selection of chromosomal regions. (Lower) Sequences mapping between the defined intervals are retrieved. Data consist of EST mapping and sequence information, genomic segment accession number, and a close marker detectable by electronic PCR (ePCR). Note that overlaps between EST mapping and ocular disorders are also listed (with links to RetNet and OMIM).
MPP4 (NM㛭033066, ref. 27), recognized by our EST AA054133, and AIPL1 (NM㛭014336), identified by our EST AA457377 and causing Leber congenital amaurosis (16). Finally, we assessed experimentally the computational predictions by performing RTPCR with 118 randomly selected subtracted ESTs on 24 adult and fetal human tissues. Twenty-five percent of our sequences amplified the correct size product only from retina mRNA; an additional 50% of sequences amplified only from adult retina (and 1 or 2 more adult tissues) but were found in multiple developmental tissues and may thus be important for the development of this organ (Fig. 2). Notably, one of the ESTs from this category matches VAX2, a homeobox gene important in the establishment of the dorsoventral axis of the eye (28). Only 24% of our ESTs amplified from multiple tissues and thus likely represent genes that by chance alone were represented in the database exclusively as retinal ESTs. We also found genomic contamination to be low, because only 3% of sequences produced amplification products from genomic DNA but not mRNA. In addition to providing a measure of the robustness of the subtraction, the RT-PCR data enabled us to compare the expres14330 兩 www.pnas.org兾cgi兾doi兾10.1073兾pnas.222409099
sion profile of our EST set with their abundance and distribution in dbEST. First, all four sequences shown to be likely genomic contaminants were represented in dbEST as singletons. Second, 19 of 29 retina-specific ESTs and 34 of 59 retina兾development ESTs were represented by at least two different ESTs; 42% of the time these ESTs had been generated from different cDNA libraries. Finally, 20 of 26 sequences expressed in multiple tissues were represented in dbEST as singletons. From these data, we concluded that the most likely sources of contamination in the subtracted set are genomic contamination and incomplete representation of transcripts in dbEST. The latter could be caused by either stochastic reasons or by low levels of abundance in various tissues. The most reliable subtraction data were those in which a query sequence matched two or more retinal ESTs, preferably from multiple retinal cDNA libraries. We therefore conclude that the quality of cDNA libraries and sampling depth and breadth of dbEST are critical to the success of in silico subtraction. Therefore, given the continuous expansion of dbEST both in terms of numbers of clones sequenced from a given tissue and the increased source diversity of newly deposited cDNA libraries, we anticipate that our error rate of 25% Katsanis et al.
Identification of Positional Candidate Genes: RETBASE. To provide
positional candidates for genetic disorders of the retina, we used a combination of in vitro and in silico mapping to position all 925 human ESTs on the human genome, thus generating a retinaenriched human transcript map (Fig. 3). We integrated this map with the genetic retinopathy map, the latter providing genome positions for retinopathy linked loci for which the disease gene remains unknown. By combining information culled through our in silico subtraction algorithm that identified retinal-specific兾 enhanced ESTs with genome-mapping locations for retinopathy linked loci, we have identified positional candidate genes for 42 of 51 uncloned disorders. To search this dynamic set of data efficiently, we constructed a web-served database, RETBASE (http:兾兾hgsc.bcm. tmc.edu兾retbase), which can be used to mine this information in several ways. Accession number searches are the simplest retrieval method and are complemented by a BLAST engine. Alternatively, one can query specific chromosomal locations and retrieve all ESTs that map within an interval of interest. Finally, the published positions of all uncloned human retinopathies (and phenotypes with a retinal component, such as Usher syndrome) have been incorporated with links to RetNet and Online Mendelian Inheritance in Man (www.ncbi.nlm.nih.gov兾omim) to enable investigators interested in particular disorders to scan a genomic interval of interest (Fig. 4). As several of our ESTs have been shown independently to represent disease-causing genes, it is likely that an additional number of our sequences may prove to be associated with retinopathies. Naturally, given that more than half of the known retinal disease genes are expressed in multiple tissues, many genes important in retinal function (and dysfunction) will not be represented in our collection. Nevertheless, based on our knowledge of all known retinopathy loci, we would expect that some 20 or more unidentified retinopathy genes may also exhibit retinal-specific兾preferential expression and are likely to be identified by our approach. 1. Venter, J. C., Adams, M. D., Myers, E. W., Li, P. W., Mural, R. J., Sutton, G. G., Smith, H. O., Yandell, M., Evans, C. A., Holt, R. A., et al. (2001) Science 291, 1304–1351. 2. Lander, E. S., Linton, L. M., Birren, B., Nusbaum, C., Zody, M. C., Baldwin, J., Devon, K., Dewar, K., Doyle, M., FitzHugh, W., et al. (2001) Nature 409, 860–921. 3. Kapranov, P., Cawley, S. E., Drenkow, J., Bekiranov, S., Strausberg, R. L., Fodor, S. P. A. & Gingeras, T. R. (2002) Science 296, 916–919. 4. Hogenesch, J. B., Ching, K. A., Batalov, S., Su, A. I., Walker, J. R., Zhou, Y., Kay, S. A., Schultz, P. G. & Cooke, M. P. (2001) Cell 106, 413–415. 5. Jimenez-Sanchez, G., Childs, B. & Valle, D. (2001) Nature 409, 853–855. 6. den Hollander, A. I., van Driel, M. A., de Kok, Y. J. M., van de Pol, D. J. R., Hoyng, C. B., Brunner, H. G., Deutman, A. F. & Cremers, F. P. M. (1999) Genomics 58, 240–249. 7. Quackenbush, J., Liang, F., Holt, I., Pertea, G. & Upton, J. (2000) Nucleic Acids Res. 28, 141–145. 8. Sohocki, M. M., Malone, K. A., Sullivan, L. S. & Daiger, S. P. (1999) Genomics 58, 29–33. 9. Malone, K., Sohocki, M. M., Sullivan, L. S. & Daiger, S. P. (1999) Mol. Vis. 5, 5. 10. Mu, X., Zhao, S., Pershad, R., Hsieh, T. F., Scarpa, A., Wang, S. W., White, R. A., Beremand, P. D., Thomas, T. L., Gan, L. & Klein, W. H. (2001) Nucleic Acids Res. 29, 4983–4993. 11. Sinha, S., Sharma, A., Agarwal, N., Swaroop, A. & Yang-Feng, T. L. (2000) Invest. Ophthalmol. Vis. Sci. 41, 24–28. 12. Sharon, D., Blackshaw, S., Cepko, C. L. & Dryja, T. P. (2002) Proc. Natl. Acad. Sci. USA 99, 315–320. 13. Velculescu, V. E., Vogelstein, B. & Kinzler, K. W. (2000) Trends Genet. 16, 423–425. 14. Blackshaw, S., Fraiolli, R. E., Furukawa, T. & Cepko, C. L. (2002) Cell 107, 579–589. 15. Sullivan, L. S., Heckenlively, J. R., Browne, S. J., Zuo, J., Hide, W. A., Gal, A.,
Katsanis et al.
The process of evaluation of positional candidates will be expedited by the fact that 20% of our ESTs represent known or predicted genes (Table 2). It is notable, however, that the remaining ESTs do not have matches in REFSEQ, despite the fact that the overwhelming majority of them tested positive by RT-PCR. It is possible that part of our collection represents single-exon genes, 3⬘ terminal exons, or alternatively spliced, tissue-specific isoforms of known transcripts, which are typically predicted with lower efficiency by gene-prediction programs (29). Our data concur with recent observations that the true transcriptional activity of the genome may be an order of magnitude greater than predicted from the genome sequence (3), which raises the possibility that a significant fraction of the transcriptome may represent RNA-only species, important in numerous cellular processes (30). Database manipulations are an important tool for disease gene identification (8, 9, 16). Our approach represents a comprehensive analysis of dbEST and provides a tool for filtering generic expression databases that can achieve substantial enrichment. It is of note that comparison of our collection with SAGE tags from discrete regions and兾or cell types of the retina (12, 14) has revealed some overlap, but also substantial divergence, illustrating how complementary strategies are useful in constructing a comprehensive tissue兾organ transcriptome. In contrast to labor-intensive SAGE, however, our approach is automatable and can rapidly query the complete spectrum of tissues and cell types, the only limitation being the availability of an adequate number of ESTs in GenBank. As such, our protocols can be easily implemented to study multiple cell types and systems. In addition, the parameters of the in silico subtraction process are such that it may be possible to conduct searches to identify genes expressed in a defined range of tissues (e.g., retina and cochlea for Usher syndrome). This ability is likely to be of particular value, because most genetic disorders typically affect a discrete number of organ and cellular systems. We thank J. Fitzgibbon, J. Nathans, and D. Zack for their critical evaluation of the manuscript. We also thank P. Culpepper, P. Chen, and Z. Yang for expert programming assistance. This work was supported by the National Eye Institute of the National Institutes of Health Grants EY12666 (to N.K. and K.C.W.) and EY11780 (to J.R.L.).
16. 17. 18. 19. 20. 21. 22. 23. 24. 25. 26. 27. 28. 29. 30.
Denton, M., Inglehearn, C. F., Blanton, S. H. & Daiger, S. P. (1999) Nat. Genet. 22, 255–259. Sohocki, M. M., Bowne, S. J., Sullivan, L. S., Blackshaw, S., Cepko, C. L., Payne, A. M., Bhattacharya, S. S., Khaliq, S., Qasim Mehdi, S., Birch, D. G., et al. (2000) Nat. Genet. 24, 79–83. den Hollander, A. I., ten Brink, J. B., de Kok, Y. J. M., van Soest, S., van den Born, L. I., van Driel, M. A., van de Pol, D. J. R., Payne, A. M., Bhattacharya, S., Kellner, U., et al. (1999) Nat. Genet. 23, 17–22. den Hollander, A. I., Heckenlively, J. R., van den Born, L. I., de Kok, Y. J. M., van der Velde-Vissner, S. D., Kellner, U., Jurklies, M. J., van Schooneveld, M. J., Blankenagel, A., Rohrschneider, K., et al. (2001) Am. J. Hum. Genet. 69, 198–203. Katsanis, N., Worley, K. C. & Lupski, J. R. (2001) Nat. Genet. 29, 88–91. Bailey, J. A., Yavor, A. M., Massa, H. F., Trask, B. J. & Eichler, E. E. (2001) Genome Res. 11, 1005–1017. Semple, C. A. M., Morris, S. W., Porteus, D. J. & Evans, K. L. (2002) Genome Res. 12, 424–429. Kent, W. J. (2002) Genome Res. 12, 656–664. Lolley, R. N., Craft, C. M. & Lee, R. H. (1992) Neurochem. Res. 17, 81–89. Freund, C., Gregory-Evans, C., Furukawa, T., Papaioannou, M., Looser, J., Ploder, L., Bellingham, J., Ng, D., Herbrick, J., Duncan, A., et al. (1997) Cell 91, 543–553. Strausberg, R. L. (2001) J. Pathol. 195, 31–40. Allikmets, R., Singh, N., Sun, H., Shroyer, N. F., Hutchinson, A., Chidambaram, A., Gerrard, B., Baird, L., Stauffer, D., Peiffer, A., et al. (1997) Nat. Genet. 15, 236–246. Stohr, H. & Weber, B. H. F. (2001) Genomics 74, 377–384. Barbieri, A. M., Lupo, G., Bulfone, A., Andreazzoli, M., Mariani, M., Fougerousse, F., Consalez, G. G., Borsani, G., Beckmann, J. S., Barsacchi, G., et al. (1999) Proc. Natl. Acad. Sci. USA 96, 10729–10734. Claverie, J.-M. (2000) Genome Res. 10, 1277–1279. Huttenhofer, A., Kiefmann, M., Meier-Ewert, S., O’Brien, J., Lehrach, H., Bachellerie, J. P. & Brosius, J. (2001) EMBO J. 20, 2943–2953.
PNAS 兩 October 29, 2002 兩 vol. 99 兩 no. 22 兩 14331
GENETICS
is likely to be reduced. In addition, periodic reevaluation of predicted tissue-specific sequences is also likely to result in a substantial enhancement of the predictive power of our approach.