Robotics 2015, 4, 63-102; doi:10.3390/robotics4010063
OPEN ACCESS
robotics ISSN 2218-6581 www.mdpi.com/journal/robotics Article
A Computational Model of Human-Robot Spatial Interactions Based on a Qualitative Trajectory Calculus Christian Dondrup 1, *, Nicola Bellotto 1 , Marc Hanheide 1 , Kerstin Eder 2 and Ute Leonards 3 1
School of Computer Science, University of Lincoln, Brayford Pool, LN6 7TS Lincoln, UK; E-Mails:
[email protected] (N.B.);
[email protected] (M.H.) 2 Department of Computer Science, University of Bristol, Merchant Venturers Building, Woodland Road, Clifton, BS8 1UB Bristol, UK; E-Mail:
[email protected] 3 School of Experimental Psychology, University of Bristol, 12A Priory Road, Clifton, BS8 1TU Bristol, UK; E-Mail:
[email protected] * Author to whom correspondence should be addressed; E-Mail:
[email protected]; Tel.: +44-1522-837453. Academic Editor: Huosheng Hu Received: 31 December 2014 / Accepted: 17 March 2015 / Published: 23 March 2015
Abstract: In this paper we propose a probabilistic sequential model of Human-Robot Spatial Interaction (HRSI) using a well-established Qualitative Trajectory Calculus (QTC) to encode HRSI between a human and a mobile robot in a meaningful, tractable, and systematic manner. Our key contribution is to utilise QTC as a state descriptor and model HRSI as a probabilistic sequence of such states. Apart from the sole direction of movements of human and robot modelled by QTC, attributes of HRSI like proxemics and velocity profiles play vital roles for the modelling and generation of HRSI behaviour. In this paper, we particularly present how the concept of proxemics can be embedded in QTC to facilitate richer models. To facilitate reasoning on HRSI with qualitative representations, we show how we can combine the representational power of QTC with the concept of proxemics in a concise framework, enriching our probabilistic representation by implicitly modelling distances. We show the appropriateness of our sequential model of QTC by encoding different HRSI behaviours observed in two spatial interaction experiments. We classify these encounters, creating a comparative measurement, showing the representational capabilities of the model. Keywords: qualitative trajectory calculus; human-robot spatial interaction; qualitative spatial relations; probabilistic sequential models; proxemics
Robotics 2015, 4
64
1. Introduction Currently used research and commercial robots are able to navigate safely through their environment, avoiding static and dynamic obstacles. However, a key aspect of mobile robots is the ability to navigate and manoeuvre safely around humans [1]. Mere obstacle avoidance is not sufficient in those situations because humans have special needs and requirements to feel safe and comfortable around robots. Human-Robot Spatial Interaction (HRSI) is the study of joint movement of robots and humans through space and the social signals governing these interactions. It is concerned with the investigation of models of the ways humans and robots manage their motions in vicinity to each other. These encounters might, for example, be so-called pass-by situations where human and robot aim to pass through a corridor trying to circumvent each other given spatial constraints. In order to resolve these kinds of situations and pass through the corridor, the human and the robot need to be aware of their mutual goals and have to have a way of negotiating who goes first or who goes to which side. Our work therefore aims to equip a mobile robot with understanding of such HRSI situations and enable it to act accordingly. In early works on mobile robotics, humans have merely been regarded as static obstacles [2] that have to be avoided. More recently, the dynamic aspects of “human obstacles” have been taken into account, e.g., [3]. Currently, a large body of research is dedicated to answer the fundamental questions of HRSI and is producing navigation approaches which plan to explicitly move on more “socially acceptable and legible paths” [4–6]. The term “legible” here refers to the communicative–or interactive–aspects of movements which previously have widely been ignored in robotics research. Another specific requirement to motion planning involving more than one dynamic agent, apart from the sociability and legibility, is the incorporation of the other agent’s intentions and movements into the robot’s decision making. According to Ducourant et al. [7], who investigated human-human spatial behaviour, humans also have to consider the actions of others when planning their own. Hence, spatial movement is also about communication and coordination of movements between two agents–at least when moving in close vicinity to one another, e.g., entering each other’s social or personal spaces [8]. From the above descriptions follow certain requirements for the analysis of HRSI that need to be fulfilled in order to equip a mobile robot with such an understanding of the interaction and the intention of its counterpart. Additionally, such a representation is used to evaluate and generate behaviour according to the experienced comfort, naturalness, and sociability, as defined by Kruse et al. [9], during the interaction. Hence, the requirements for such an optimal representation are: Representing the qualitative character of motions including changes in direction, stopping or starting to move, etc. It is known that small movements used for prompting, e.g., [10], are essential for a robot to interpret the intention of the human and to react in a socially adequate way. Representing the relevant attributes of HRSI situations in particular proxemics [8] (i.e., the distance between the interacting agents), which we focus on in this paper. This is required to analyse the appropriateness of the interaction and to attribute intention of the implicitly interacting agents. Ability to generalise over a number of individuals and situations. A robot requires this ability to utilise acquired knowledge from previous encounters of the same or similar type. A qualitative framework that is able to create such a general model, which still holds enough information to
Robotics 2015, 4
65
unambiguously describe different kinds of interactions but abstracts from metric space, facilitates learning and reasoning. A tractable, concise, and theoretically well-founded model is necessary for the representation and underlying reasoning mechanisms in order to be deployed on an autonomous robot. We have laid the first foundation for such an approach in a number of previous works investigating the suitability of applying a Qualitative Trajectory Calculus (QTC) to represent HRSI [11–14]. QTC is a formalism representing the relative motion of two points in space in a qualitative framework and offers a well-defined set of symbols and relations [15]. We are building on the results from [11,12] using a Markov model and hand crafted QTC state chains which has been picked up in [13,14] and evolved into a Hidden Markov Model (HMM) based representation of learned interactions. This paper offers a comprehensive overview of the QTC-based probabilistic sequential representation utilising the HMM, and focuses on its specific adoptions for the encoding of HRSI using real-world data. In this sense, we integrate our previous findings into a more unified view and evaluate the proposed model on a new and larger data set, investigating new types of interactions and compare these results to our previous experiment [13,14]. In particular, we assessed the generality of our model by not only testing it on a single robot type, but extended the set of experiments to include data from a more controlled study using a “mock-up” robot (later referred to as the “Bristol Experiment”) in an otherwise similar setting. We argue that the proposed model is both rich enough to represent the selected spatial interactions from all our test scenarios, and that it is at the same time compact and tractable, lending itself to be employed in responsive reasoning on a mobile, autonomous robot. As stated in our requirements, social distances are an essential factor in representing HRSI situations as indicated in Hall’s proxemics theory [8] and numerous works on HRSI itself, e.g., [16]. However, QTC has been developed to represent the relative change in distance between two agents but it was never intended to model the absolute value. This missing representation deprives it of the ability to use proxemics to analyse the appropriateness of the interaction or to generate appropriate behaviour regarding HRSI requirements. To overcome this deficit and to highlight the interaction of the two agents in close vicinity to one another, we aim to model these distances using our HMM-based representation of QTC. Instead of modelling distance explicitly by expanding the QTC-state descriptors and including it as an absolute value, as e.g., suggested by Lichtenthäler et al. [17], we aim to model it implicitly and refrain from altering the used calculus to preserve its qualitative nature and the resulting generalisability, and simplicity. We utilise our HMM-based model and different variants of QTC to define transitions between a coarse and fine version of the calculus depending on the distance between human and robot. This not only allows to represent distance but also uses the richer variant of QTC only in close vicinity to the robot, creating a more compact representation and highlighting the interaction when both interactants are close enough to influence each other’s movements. We are going beyond the use of hand crafted QTC state chains and a predefined threshold to switch between the different QTC variants as done in previous work [12], and investigate possible transitions and distances learned from real world data from two spatial interaction experiments. Therefore, one of the aims of this work is to investigate suitable transition states and distances or ranges of distances, comparing results from our two experiments, for our combined QTC model. We expect these distances to loosely correlate with Hall’s personal space
Robotics 2015, 4
66
(1.22 m) from observations made in previous work [14] which enables our representation to implicitly model this important social norm. To summarise, the main contributions of this work are (i) a HMM-based probabilistic sequential representation of HRSI utilising QTC; (ii) the investigation of the possibility of incorporating distances like the crucial HRSI concept of proxemics [8] into this model; and (iii) enabling the learning of transitions in our combined QTC model and ranges of distances to trigger them, from real-world data. As a novel contribution in this paper we provide stronger evidence regarding the generalisability and appropriateness of the representation, demonstrated by using it to classify different encounters observed in motion-capture data obtained from different experiments, creating a comparative measurement for evaluation. Following our requirements mentioned above, we thereby aim to create a tractable and concise representation that is general enough to abstract from metric space but rich enough to unambiguously model the observed spatial interactions between human and robot. 2. Related Work Qualitative spatial representations like QTC are used on a large scale in many different research areas and fields [18]. In our case, a probabilistic model of QTC state chains is used to describe interactions between a human and a robot in the spatial domain, i.e., 2D navigation, which is why this section will focus on the different forms of representations used in HRSI and how they compare to the presented approach. Representing spatial interaction is an important part of HRI in general and HRSI in particular where the vast majority of publications in the field of human-aware navigation represents interactions in metric space [9]. These representations are used mainly for path planning and prediction and employ the concept of proxemics, of which examples of currently used approaches will be shown in the following sections. 2.1. Proxemics Before we go into detail on path planning and prediction we would like to introduce the concept of proxemics which is used in both experiments described in Section 5. We are adopting the definition of personal space and social space from [8]. In his work, E.T. Hall defines several distances and groups them into four different categories (in order of increasing distance between the interactants): Intimate Space, Personal Space, Social Space, and Public Space. Theses spaces are defined according to different factors, e.g., the ability to touch each other, loudness of voice while conversing, olfactory sensing, etc. Additionally, all of these spaces or distances are divided into two subgroups, i.e., the close phase and the far phase. In the following, when speaking of personal space we refer to the area described by the close phase (1.22 m to 2.1 m) of the social space and the far phase of the personal space (0.76 m to 1.22 m). Previous work [14] has shown that this is the area providing the most promising results. In this work, we are investigating this theory on a larger data set, trying to find appropriate distance ranges for our model, facilitating future learning of qualitative representations of such proxemics thresholds. Since the beginning of HRSI, the concept of proxemics is widely used and investigated in the field of social robotics. On the one hand, for human-aware navigation, many works adopt the zones defined
Robotics 2015, 4
67
by Hall [8] to achieve socially acceptable avoidance manoeuvres as can be seen from, e.g., [16] and most of the works on social cost functions listed below. On the other hand, there is the investigation of the optimal approach distance for a robot like the work by Torta et al. [19]. In their experiment, they investigate the optimal approach distance and angle for communication between a small humanoid robot [20] and a sitting person. They present an attractor based navigation framework that includes the definition for a Region of Approach which is optimal to communicate between the two agents. In the conducted experiment, Torta et al. show that an approach from the front is preferable over an approach from the side and found that the distance loosely correlates with the close phase of the social distance as defined by Hall [8]. Another example, focusing on the long-term habituation effects of approach distances is the work by Walters et al. [21]. They use a standing participant and a mobile service robot in an otherwise similar experimental setting as Torta et al. and inspect the long-term effect on the most comfortable approach distance. In our work we follow the same approach of investigating the optimal distances for our type of interaction but do not use self-assessment like Torta et al. or Walters et al. but a moving human and the recorded trajectories from our experiments. However, the presented work is meant to introduce a computational model and not to make assumptions about the quality of the actual interactions. We therefore assume that participants will keep the appropriate distance to the interaction partner and do not investigate the experienced comfort explicitly. 2.2. Path Planning Path planning for mobile robots aims at finding a safe and short path which, in the majority of cases, is done by some form of A * algorithm. HRSI, on the other hand, does not aim to find the shortest or most energy efficient path but tries to adhere to numerous social norms and conventions, like the previously introduced proxemics [8], and thereby arguably makes navigation in human-populated environments safer and more efficient. There are several forms of human-aware path planning, using different forms of interaction representations of which examples will be given in the following. One of the most common forms of representing humans in the environment is by using specific cost functions or potential fields, mainly circular or elliptical Gaussians [4,22–26]. These are used in the majority of human-aware path planners, employing a standard cost minimisation policy or more advanced planning algorithms like rapidly-exploring random trees (RRT) [25,26]. These approaches all rely on constraints or observed interactions and represent previous encounters via definitions to create or tune cost functions and potential fields rather than learning actual trajectories. Hence, they are a form of representing knowledge about human obstacles rather than representing previous interactions. This gives them the power to use generic path planners to create human-aware trajectories but deprives them of the wealth of information about the actual unfolding of such interactions stored in QTC state chains. Other, less frequently used forms of representing HRSI for path planning include Social Force Models, Trajectory Learning, Heat Maps, or Motion Primitives. Social Forces have been used to describe inter-group relations and the drive of a human or a group of humans towards a goal, passing several subgoals or avoiding obstacles [27,28] which can also be transferred to robots to create more human-like behaviour. Social forces are therefore a way of abstracting from actual trajectories, using mathematical
Robotics 2015, 4
68
formulations but is still based in metric space and does not represent previous encounters unlike the presented calculus. Trajectory learning is one of the more closely related approaches to our QTC based approach in HRSI. Feil et al. [29] used Gaussian Mixture Models created from observed trajectories to abstract from the concrete metric representation whereas Garrido et al. [30] used Hidden Markov Models and trajectory key points. Both of these approaches use different forms of abstraction to create a general model for HRSI but are still relying on a metric representation and are therefore very environment dependent. Heat Maps are another form of abstraction that still focuses on metric space. Arvunin et al. [31] used recorded trajectories of humans approaching an experimenter to create a so-called “Value Map” which can be used to represent the most commonly used paths for a specific configuration. A different form of abstraction is representing metric space via grid cells or a lattice as done by Kushleyev et al. [32], which allowed them to represent interaction in a dynamic system by a so-called time-bound lattice, using motion primitives. This interesting approach however, has only been employed for multi-robot environments and never in HRSI. All the representations previously or currently used in HRSI path planning are based on metric space and Cartesian coordinates whereas our probabilistic QTC model abstracts from the actual coordinate system, environment, and metric space by representing qualitative states that both agents passed through in order to achieve the observed interaction. This naturally allows to incorporate the humans actions into the robot’s path planning and decision making which, according to Ducourant et al. [7], is a very important factor in Human-Human Interaction. 2.3. Prediction One major advantage of having a representation of interactions between a robot and a human is to be able to predict possible interactions based on experience and not only rely on a reactive path planner. There are two major principles of prediction used in HRSI: Prediction based on reasoning and on learning [9]. Prediction based on geometric reasoning follows constraints in the usual movement of humans given a certain environment and obstacles. Tadokoro et al. [33] use grid cells with an assigned probability–according to previous observations–of possible state transitions, meaning the likelihood of a human moving from one grid cell to the other. Ohki et al. [34] presented a similar approach also based on grid cells and their transition probability derived from the personal space of the human. Both of these approaches represent HRSI via state transitions but only focus on the possible future paths of the human and not the actual interaction between the robot and the human, unlike our approach. There are many other approaches that make assumptions about the future movement of humans given obstacles or certain environments which do not focus on HRSI but on preventing it by planning routes avoiding humans and are therefore not related to the presented QTC approach and will not be mentioned here. Prediction based on learning means the collection of data and the creation of new samples from the built models which is highly related to the proposed probabilistic QTC representation but is currently almost exclusively based on map coordinates instead of abstract, qualitative states. Some of the more closely related works are on Motion Patterns, Feature Based Markov Decision Processes, and Short
Robotics 2015, 4
69
Term Trajectory Libraries. Bennewitz et al. [35,36] use motion patterns as inputs for Hidden Markov Models to not only predict the immediate future state of a human during interaction but also possible trajectories the human takes through a previously observed office environment. Ziebart et al. [37] learn cost functions of the environment that explain previously observed behaviour and employ it in a Markov Decision process which enables them to plan paths that balance time-to-goal and pedestrian disruption in known and unknown environments. This transferral of knowledge is, due to its qualitative and abstract nature, also one of the main qualities of our QTC model. Chung et al. [38] observed pedestrians and created a library of short-term trajectories which they clustered to create pedestrian movement policies to predict how humans will move to avoid obstacles or each other. All these approaches have in common that they not only map coordinates or trajectories to represent the interaction but also only represent the human side of it. Hence, all these models do not allow to predict how the robot’s behaviour could influence humans behaviour during the interaction which is a crucial factor in HRSI. In contrast to all other approaches listed in this section, the QTC-based approach presented in the following, allows to abstract from metric space completely and absolutely by employing a qualitative representation. Moreover, this model, by providing information about the movement of the two agents in relation to one another, allows to make assumptions about how their spatial behaviour might influence each other during the interaction, based on previous observations. The remainder of the paper is structured as follows. The variants of QTC used for the description of HRSI together with the multi variant QTC approach are described in Section 3. Our probabilistic sequential model utilising the described calculus is presented in Section 4. Section 5 shows the two experiments and methods used to evaluate this model, leading to the results shown in Section 6. Finally we are discussing the results in Section 7 and conclude in Section 8, showing some future work possibilities in Section 9. 3. The Qualitative Trajectory Calculus In this section we will give an overview of the Qualitative Spatial Relation (QSR) we will use for our computational model. According to Kruse et al. [9], using QSRs for the representation of HRSI is a novel concept which is why we will go into detail about the two used versions of the calculus in question and also how we propose to combine them. This combination is employed to model distance thresholds implicitly using our probabilistic representation presented in Section 4. The Qualitative Trajectory Calculus (QTC) belongs to the broad research area of qualitative spatial representation and reasoning [18], from which it inherits some of its properties and tools. The calculus was developed by Van de Weghe in 2004 to represent and reason about moving objects in a qualitative framework [15]. One of the main intentions was to enable qualitative queries in geographic information systems, but QTC has since been used in a much broader area of applications. Compared to the widely used Region Connection Calculus [39], QTC allows to reason about the movement of disconnected objects (DC), instead of unifying all of them under the same category, which is essential for HRSI. There are several versions of QTC, depending on the number of factors considered (e.g., relative distance, speed, direction, etc.) and on the dimensions, or constraints, of the space where the points move. The two most important variants for our work are QTCB which represents movement in 1D and
Robotics 2015, 4
70
QTCC representing movement in 2D. QTCB and QTCC have originally been introduced in the definition of the calculus by Van de Weghe [15] and will be described to explain their functionality and show their appropriateness for our computational model. Their combination (QTCBC ) is an addition proposed by the authors to enable the distance modelling and to highlight the interaction of the two agents in close vicinity to one another. All three versions will be described in detail in the following (an implementation as a python library and ROS node can be found at [40]). 3.1. QTC Basic and QTC Double-Cross The simplest version, called QTC Basic (QTCB ), represents the 1D relative motion of two points k and l with respect to the reference line connecting them (see Figure 1a). It uses a 3-tuple of qualitative relations (q1 q2 q3 ), where each element can assume any of the values {−, 0, +} as follows: (q1 ) movement of k with respect to l − : k is moving towards l 0 : k is stable with respect to l + : k is moving away from l (q2 ) movement of l with respect to k: as above, but swapping k and l (q3 ) relative speed of k with respect to l − : k is slower than l 0 : k has the speed of l + : k is faster than l To create a more general representation we will use the simplified version QTCB11 which consists of the 2-tuple (q1 q2 ). Hence, this simplified version is ignorant of the relative speed of the two agents and restricts the representation to model moving apart or towards each other or being stable with respect to the last position. Therefore, the state set SB = {(q1 , q2 ) : q1 , q2 ∈ {−, 0, +}} for QTCB11 has |SB | = 32 possible states and |τB | = |{s s0 : s, s0 ∈ SB ∧ s 6= s0 }| = 32 legal transitions as defined in the Conceptual Neighbourhood Diagram (CND). We are adopting the notation s1 s2 for valid transitions according to the CND from [15], shown in Figure 2. By restricting the number of possible transitions–assuming continuous observations of both agents–a CND reduces the search space for subsequent states, and therefore the complexity of temporal QTC sequences.
Robotics 2015, 4
71
l k
11111111111111111111111111111111 00000000000000000000000000000000 (a)
k
l t1
t2
t3
t2 , t3 t1
11111111111111111111111111111111 00000000000000000000000000000000 (b)
Figure 1. Example of moving points k and l. (a) The QTCC double cross. The respective QTCB and QTCC relations for k and l are (−+) and (− + − 0); (b) Example of a typical pass-by situation in a corridor. The respective QTCC state chain is (− − 0 0)t1 (− 0 0 0)t2 (− 0 + 0)t3 .
Figure 2. Conditional Neighbourhood Diagramm (CND) of QTCB11 . Given continuous observation, it is impossible to transition from moving towards the other agent to moving away from it without passing through the 0-state. Hence, whereas + and − always described intervals in time, 0 states can be of infisitinimal length. Also, note that due to the original formulation [15], there are no direct transitions in the CND between some of the states that, at a first glance, appear to be adjacent (e.g., (−0) and (0−)).
Robotics 2015, 4
72
The other version of the calculus used in our models, called QTC Double-Cross (QTCC ) for 2D movement, extends the previous one to include also the side the two points move to, i.e., left, right, or straight, and the minimum absolute angle of k, again with respect to the reference line connecting them (see Figure 1a). Figure 1b shows an example human-robot interaction in a corridor, encoded in QTCC . In addition to the 3-tuple (q1 q2 q3 ) of QTCB , the relations (q4 q5 q6 ) are considered, where each element can assume any of the values {−, 0, +} as follows: − → (q4 ) movement of k with respect to k l − → − : k is moving to the left side of k l − → 0 : k is moving along k l − → + : k is moving to the right side of k l − → (q5 ) movement of l with respect to l k: as above, but swapping k and l − → (q6 ) minimum absolute angle of k, αk with respect to k l − : αk < αl 0 : αk = αl + : αk > αl Similar to QTCB we also use the simplified version of QTCC , QTCC21 . For simplicity we will from here on refer to the simplified versions of QTC, i.e., QTCB11 and QTCC21 [15], as QTCB and QTCC respectively. This simplified version inherits from QTCB the ability to model if the agents are moving apart or towards each other or are stable with respect to the last position and in addition is also able to model to which side of the connecting line the agents are moving. The resulting 4-tuple (q1 q2 q4 q5 ) representing the state set SC = {(q1 , q2 , q4 , q5 ) : q1 , q2 , q4 , q5 ∈ {−, 0, +}}, has |SC | = 34 states, and |τC | = |{s s0 : s, s0 ∈ SC ∧ s 6= s0 }| = 1088 legal transitions as defined in the corresponding CND [41], see Figure 3. These are the original definitions of the two used QTC variants which can be used in our computational model to identify HRSI encounters as shown in previous work [13]. To model distance however, we need both, QTCB and QTCC , in one unified model. As shown in [12], QTCB and QTCC can be combined using hand crafted and simplified state chains and transitions to represent and reason about HRSIs. In the following section, however, we formalise and automatise this process, ultimately enabling us to use real world data to learn the transitions between the two variants of QTC instead of predefining them manually.
Robotics 2015, 4
73
Figure 3. CND of the simplified QTCC (image source [41]). Note that, similar to the CND for QTCB , due to the original formulation of CNDs, there are no direct transitions between some of the states that at first glance look adjacent, e.g., (− 0 + −) and (− + 0−). 3.2. Combining QTCB and QTCC As mentioned, one of the aims of the proposed computational model is the combination of the 1D representation QTCB , used when the two agents are far apart, and the 2D representation QTCC , used when the agents are in close vicinity to one another. To achieve this combination via the implicit modelling of the distance threshold used and the resulting simplification of QTC state chains for HRSI when encapsulated in our probabilistic framework, we propose the combination of QTCB and QTCC referring to it as QTCBC . The combined variants are QTCB11 and QTCC21 which results in QTCB11C21 , from here on referred to as QTCBC for simplicity. This proposed model is in principal able to switch between the fine and coarse version of QTC at will, but for the presented work we will use distance thresholds to trigger the switching. These thresholds could be social distances like the previously mentioned area of far phase personal space and close phase social space as defined by Hall [8] but could also be any other distance value. Since the actual quantitative distance threshold used is not
Robotics 2015, 4
74
explicitly included in the QTCBC tuple, it will be modelled implicitly via the transition between the two enclosed variants. The set of possible states for QTCBC is a simple unification of the fused QTC variants. In the presented case the integrated QTCBC states are defined as: SI = SB ∪ SC
(1)
with |SI | = |SB | + |SC | = 90 states. The transitions of QTCBC include the unification of the transitions of QTCB and QTCC –as specified in the corresponding CNDs (see Figures 2 and 3)–but also the transitions from QTCB to QTCC : τBC = {sb sc : sb ∈ SB , sc ∈ SC } and from QTCC to QTCB : τCB = {sc sb : sb ∈ SB , sc ∈ SC }, respectively. This leads to the definition of QTCBC transitions as: τI = τB ∪ τC ∪ (τBC ∪ τCB )
(2)
To preserve the characteristics and benefits of the underlying calculus τBC and τCB are simply regarded as an increase or decrease in granularity, i.e., switching from 1D to 2D or vice-versa. As a result there are two different types of transitions: 1. Pseudo self-transitions where the values of (q1 q2 ) do not change, plus all possible combinations for the 2-tuple (q4 q5 ): |SB | · 32 = 81, e.g., (++) (+ + −−) or (+ + −−) (++). 2. Legal QTCB transitions, plus all possible combinations for the 2-tuple (q4 q5 ): |τB | · 32 = 288, e.g., (+0) (+ + −−) or (+0 − −) (++). Resulting into: |τBC | + |τCB | = 2 · (81 + 288) = 738 transitions between the two QTC variants. This leads to a total number of QTCBC transitions of: τI = |τB | + |τC | + (|τBC | + |τCB |) = 32 + 1088 + 738 = 1858 These transitions depend on the previous and current Euclidean distance of the two points d(k, l) and the threshold ds representing an arbitrary distance threshold: τB if d(k, l)t−1 > ds ∧ d(k, l)t > ds , τ else if d(k, l)t−1 > ds ∧ d(k, l)t ≤ ds , BC (3) τI = τCB else if d(k, l)t−1 ≤ ds ∧ d(k, l)t > ds , τC otherwise These transitions, distances, and threshold ds play a vital role in our probabilistic representation of QTCBC which will be described in the following section.
Robotics 2015, 4
75
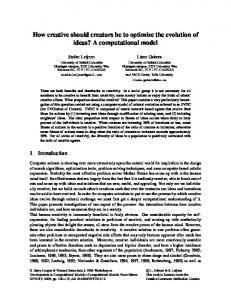
4. Probabilistic Model of State Chains After introducing our model of QTCBC in Section 3, we will describe a probabilistic model of QTCBC state chains in the following. This probabilistic representation is able to learn QTC state chains and the transition probabilities between the states from observed trajectories of human and robot, using the distance threshold ds to switch between the two QTC variants during training. This model is later on used as a classifier to compare different encounters and to make assumptions about the quality of the representation. This representation is able to compensate for illegal transitions and shall also be used in future work as a knowledge base of previous encounters to classify and predict new interactions. In previous work, we proposed a probabilistic model of state chains, using a Markov Model and QTCC to analyse HRSI [11]. This first approach has been taken a step further and evolved into a Hidden Markov Model (HMM) representation of QTCC [13]. This enables us to represent actual sensor data by allowing for uncertainty in the recognition process. With this approach, we are able to reliably classify different HRSI encounters, e.g., head-on (see Figure 4) and overtake–where the human is overtaking the robot while both are trying to reach the same goal–scenarios, and show in Section 6 that the QTC-based representations of these scenarios are significantly different from each other.
Table 1
ds ~3m
R Kitchen
Table 2
~4m
Figure 4. Left: Robot. Hight: 1.72 m, diameter: ∼ 61 cm. Right: Head-on encounter. Robot (“R”) tries to reach a table while the human (reddish figure) is trying to reach the kitchen. Experimental set-up: kitchen on the left and two tables on the right. Black lines represent the corridor. Circle around robot represents a possible distance threshold ds . To be able to represent distance for future extensions of the HMM as a generative model, to highlight events in close vicinity to the human, and to create a more concise and tractable model, we propose the probabilistic representation of QTCBC state chains, using a similar approach as in [13]. We are now modelling the proposed QTCBC together with QTCB and QTCC which allows to dynamically switch between the two combined variants or to use the two pure forms of the calculus. This results in extended transition and emission probability matrices for τI (see Figure 5, showing the transition probability matrix) which incorporate not only QTCB and QTCC , but also the transitional states defined by QTCBC .
Robotics 2015, 4
76 Start
τB
0
τBC
9x81
End
0
9x9
τCB
τC
81x81
81x9
0
1
Figure 5. The HMM transition matrix τI for QTCBC as described in Equations (2) and (3). Similar to the HMM based representation described in [13], we have initially modelled the “correct” emissions, e.g., (+−) actually emits (+−), to occur with 95% probability and to allow the model to account for detection errors with 5%. Our HMM contains |τI | + 2 · |SI | = 1858 + 2 · 90 = 2038 legal transitions stemming from QTCBC and the transitions from and to the start and end state, respectively (see Figure 5). To represent different HRSI behaviours, the HMM needs to be trained from the actual observed data (see Figure 6, showing an example of a trained state chain using pure QTCC ). For each different behaviour to be represented, a separate HMM is trained, using Baum-Welch training [42] (Expectation Maximisation) to obtain the appropriate transition and emission probabilities for the respective behaviour. In the initial pre-training model, the transitions that are valid, according to the CNDs for QTCB and QTCC and our QTCBC definition for transitions between the two, are modelled as equally probable (uniform distribution). We allow for pseudo-transitions with a probability of Ppt = 1e−10 to overcome the problem of a lack of sufficient amounts of training data and unobserved transitions therein. To create the training set we have to transform the recorded data to QTCC state chains that include the Euclidean distance between k and l and define a threshold ds at which we want to transition from QTCB to QTCC and vice-versa (setting ds = 0 results in a pure QTCB model and setting ds = inf results in pure QTCC model–identical to the definition in [13] for full backwards compatibility). Of course, the actual values for ds can be anything from being manually defined, taken from observation, or being a probabilistic representation of a range of distances at which to transition from one QTC variant to the other. For the sake of our evaluation we are showing a range of possible values for ds in Section 6 to find suitable candidates.
Robotics 2015, 4
77 S 0.17 0.34
-000 0.26
-0-0
--+0
0.39 0.30
-0+0
0.44
0.52
0.27
----
--++
0.59
0.26
0.20
0.65
00--
00++
0.39 0.32
0.30
0.29 0.47
---0
0.34
0.16
0.18
00+0 0.27
+0--
+0++
0.62
0.21 0.21
++--
0.30
00-0
0.29 0.15
0.77
0.20
0.70 0.50
++++ 0.50
+0-0
0.20 0.26
0.63 0.95
0.47
+0+0 0.93
E
1.00
Figure 6. QTCC states for pass-by situations created by the HMM representation. Edge width represents the transition probability. The colour of the nodes represents the a-priori probability of that specific state (from white = 0.0, e.g., “S”, to dark grey = 1.0, e.g., “E”). All transition probabilities below 0.15 have been pruned from the graph, only highlighting the most probable paths within our model. Due to the pruning, the transition probabilities in the graph do not sum up to 1.0. To create a state chain similar to the exemplary one shown in Figure 7, the values for the side movement (q4 q5 ) of the QTCC representation are simply omitted if d(k, l) > ds and the remaining (q1 q2 ) 2-tuple for the 1D movement will be represented by the QTCB part of the transition matrix. If the distance crosses the threshold, it will be represented by one of the τBC or τCB transitions. The full 2D representation of QTCC is used in the remainder of the cases. Afterwards, all distance values are removed from the representation because the QTC state chain now implicitly models ds , and similar adjacent states are collapsed to create a valid QTC representation (see Figure 7 for a conceptual state chain). This enables us to model distance via the transition between the QTC variants, while still using the pure forms of the included calculi in the remainder of the cases, preserving the functionality presented in [13], which will be shown in Section 6.
Robotics 2015, 4
78
(- - - -)
(0 0 - -)
(+ + - -)
(- -)
(+ +) (- - + +)
QTCB
(0 0 + +) QTCC
(+ + + +) QTCB
Figure 7. Conceptual temporal sequence of QTCBC for a head-on encounter. From left to right: approach, pass-by on the left or right side, moving away. Dashed lines represent instants where the distance threshold ds is crossed. 5. Experiments To evaluate the soundness and representational capabilities of our probabilistic model of HRSI using QTC, particularly QTCBC , state chains, we train our HMM representation using real-world data from two experiments. These HMMs are then employed as classifiers to generate a comparative measurement enabling us to make assumptions about the quality of the model and the distance thresholds ds . The two experiments both investigate the movement of two agents in confined shared spaces. The first experiment, later referred to as “Lincoln experiment”, was originally described in our previous work on QTC [13] and features a mobile service robot and a human naïve to the goal of the experiment. The tasks were designed around a hypothetical restaurant scenario eliciting incidental and spontaneous interactions between human and robot. The second experiment, later referred to as the “Bristol experiment”, features two agents (both human) passing each other in a two meter wide corridor. One of the two (the experimenter) was dressed up as a “robot”, masking her body shape, and her face and eyes were hidden behind goggles and a face mask (see Figure 8). This “fake robot” received automated instructions on movement direction and collision avoidance strategy via headphones. Similar to the “Lincoln experiment”, the other person was a participant naïve to the goal of the experiments, but has been given explicit instructions to cross the corridor with as little veering as possible, but without colliding with the oncoming agent. This second experiment does not feature a real robot but, yields similar results using our model, as can be seen in Section 6. Both experiments feature two agents interacting with each other in a confined shared space and are well suited to demonstrate the representational capabilities of our approach, showing how the approach can be effectively generalised or extended to other forms of spatial interaction.
Robotics 2015, 4
79
Figure 8. The “Bristol Experiment” set-up. Corridor from the participants perspective before the start of a trial. Middle: experimenter dressed as “robot”. The visual marker was attached to the wall behind the “robot” above her head. In the following sections we will describe the general aims and outlines of the experiments used. This is meant to paint the bigger picture of the underlying assumptions and behaviours of the robot/experimenter during the interactions and to explain some of the conditions we compared in our evaluation. Both experiments investigated different aspects of HRSI and spatial interaction in general, which created data well suited for our analysis of the presented probabilistic model utilising QTCBC and to investigate appropriate distance thresholds ds . 5.1. “Lincoln Experiment” This section presents a brief overview of the “Lincoln experiment” set-up and tasks. Note, the original aim of the experiment, besides the investigation of HRSI using an autonomous robot in general, was finding hesitation signals in HRSI [43], hence the choice of conditions. 5.1.1. Experiment Design In this experiment the participants were put into a hypothetical restaurant scenario together with a human-size robot (see Figure 4). The experiment was situated in a large motion capture lab surrounded by 12 motion capture cameras (see Figure 9), tracking the x, y, z coordinates of human and robot with a rate of 50 Hz and an approximate error of 1.5 mm∼2.5 mm. The physical set-up itself was comprised of two large boxes (resembling tables) and a bar stool (resembling a kitchen counter). The tables and the kitchen counter were on different sides of the room and connected via a ∼2.7 m long and ∼1.6 m wide artificial corridor to elicit close encounters between the two agents while still being able to reliably track their positions (see Figure 4). The length is just the length of the actual corridor, whereas the complete set-up was longer due to the added tables and kitchen counter plus some space for the robot and human
Robotics 2015, 4
80
to turn. The width is taken from the narrowest point. At the ends, the corridor widens to ∼ 2.2 m to give more room for the robot and human to navigate as can be seen in Figure 4. The evaluation however will only regard interactions in this specified corridor. For this experiment we had 14 participants (10 male, 4 female) who interacted with the robot for 6 minutes each. All of the participants were employees or students at the university and 9 of them have a computer science background; out of these 9 participants only 2 had worked with robots before. The robot and human were fitted with motion capture markers to track their x, y coordinates for the QTC representation–Figure 10 shows an example of recorded trajectories (the raw data set containing the recorded motion capture sequences is publicly available on our git repository [44]). The robot was programmed to move autonomously back and forth between the two sides of the artificial corridor (kitchen and tables), using a state-of-the-art planner [45,46]. Two different behaviours were implemented, i.e., adaptive and non-adaptive velocity control, which were switched at random (p = 0.5) upon the robot’s arrival at the kitchen. The adaptive velocity control gradually slowed down the robot, when entering the close phase of the social space [8], until it came to a complete stand still before entering the personal space [8] of the participant. The non-adaptive velocity control ignored the human even as an obstacle (apart from an emergency stop when the two interactants were too close, approx. 0.8) can be seen at 0.9 m ≤ ds ≤ 1.2 m. The third case, adaptive vs. non-adaptive robot behaviour in head-on encounters, is shown in Table 1c. This behaviour did not result in different trajectories during the interaction but only differed in the time it took the robot to traverse the corridor. Due to the definition of QTC it is not able to represent absolute time, which makes it hard to classify these two behaviours accordingly. The best results for each quantisation level were achieved at distances of QT CB ≤ ds ≤ 0.7 m, all lying on the diagonal of Table 1c. Since time is a crucial factor in this condition, it is very dependent on the right smoothing value combination. Figure 12b shows two exemplary results. The left hand side depicts the best classification result with classification rates of up to µ =0.748 for ds =0.7 m. The right hand side shows the results for a smoothing level that did not yield the best results for low but medium distance threshold of ds = 1.5 m with a classification rate of µ = 0.643.
Robotics 2015, 4
87
Table 1. Classification results “Lincoln experiment”, bold: mentioned in text. The mentioned confidence intervals represent the boundary cases and all the others can be considered lower. (a) Head-on vs. Overtake. Maximum 95% confidence intervals (p < 0.05) for min and max classification results: min: 0.0209, max: 0.0182; (b) Head-on: Left vs. Right. Maximum 95% confidence intervals (p < 0.05) for min and max classification results: min: 0.0221, max: 0.0182; (c) Head-on: Adaptive vs. Non-Adaptive. Maximum 95% confidence intervals (p < 0.05) for min and max classification results: min: 0.0202, max: 0.0251. (a)
Smoothing
0.1 s
0.2 s
0.3 s
Res.
µ
ds
µ
ds
µ
ds
1 cm
min max
0.90 0.97
0.7 QTCC
0.89 0.96
1.0 0.6
0.91 0.98
0.7 2.2
5 cm
min max
0.84 0.92
0.8 0.5
0.88 0.8 0.97 QTCB
0.87 0.94
0.7 QTCB
10 cm
min max
0.70 2.0 0.82 QTCB
0.79 0.87
0.79 0.89
0.9 0.4
1.2 0.5
(b)
Smoothing Res.
0.1 s µ
0.2 s
ds
µ
ds
0.3 s µ
ds
1 cm
min max
0.50 QTCB 0.97 1.9
0.58 QTCB 0.95 2.4
0.52 0.96
QTCB 2.3
5 cm
min max
0.41 0.90
QTCB 2.9
0.41 QTCB 0.93 2.8
0.49 0.94
QTCB 2.9
10 cm
min max
0.50 0.92
QTCB QTCC
0.43 QTCB 0.90 1.2
0.52 0.95
0.5 QTCC
(c)
Smoothing
0.1 s
0.2 s
0.3 s
Res.
µ
ds
µ
ds
µ
ds
1 cm
min max
0.46 0.66
1.4 QTCB
0.48 0.60
1.8 0.8
0.47 0.64
0.5 1.5
5 cm
min max
0.52 0.69
1.0 1.5
0.55 0.75
1.4 0.7
0.54 0.72
1.3 0.5
10 cm
min max
0.46 0.60
1.2 1.8
0.49 0.64
0.8 1.0
0.59 0.74
1.6 0.7
Classification rate
Robotics 2015, 4
88
1
1
0.8
0.8
0.6
0.6
0.4
0.4
0.2
0.2
QTCB 0.5
1.0
1.5
2.0
2.5
3.0
QTCC
QTCB 0.5
1.0
1.5
2.0
2.5
3.0
QTCC
1.0
1.5
2.0
2.5
3.0
QTCC
Threshold ds in m
Classification rate
(a) 1
1
0.8
0.8
0.6
0.6
0.4
0.4
0.2
0.2
QTCB 0.5
1.0
1.5
2.0
2.5
3.0
QTCC
QTCB 0.5
Threshold ds in m (b)
Figure 12. “Lincoln experiment” classification results. Dot: mean value, errorbar: 95% confidence interval, red line: H0 , left dashed red line: intimate space [8], right dashed red line: personal space [8]. The blue, horizontal area represents the 95% confidence interval of pure QTCC for comparison. (a) Classification results for head-on passing on the left vs. right, lowest and highest smoothing parameters (see bold entries in Table 1b for min an max results). Left 1 cm and 0.1 s smoothing, right 10 cm and 0.3 s smoothing. The yellow, vertical area shows possible ds where the left boundary represents the first distance ds at which the two classes can be distinguished reliably and the right boundary shows the first value of ds for which the classification results are not significantly different from QTCC any more; (b) Classification results for head-on adaptive vs. non-adaptive. Left: 5 cm and 0.2 s smoothing, right: 1 cm and 0.3 s smoothing. 6.2. Results “Bristol Experiment” Table 2 shows the evaluation of passing on the left vs. passing on the right using QTCBC for the “Bristol experiment”. The early condition, shown in Table 2a, shows its lowest classification rates for
Robotics 2015, 4
89
QT CB ≤ ds ≤ 0.6 m, and the first occurrence of the highest classification rates (up to 1.0) for 1.6 m ≤ ds ≤ 2.3 m. Reaching classification rates of 1.0 was made possible by the increase in training data for the “Bristol Experiment”. Similar to the early condition, the late condition, shown in Table 2b, shows its lowest classification rates for QT CB ≤ ds ≤ 0.6 m, due to the missing 2D information, and the first occurrence of the highest classification rates for 1.5 m ≤ ds ≤ 2.4 m. In both cases, 50% of the lowest classification rates have been generated using pure QTCB , whereas all of the highest classification rates have been reached without using pure QTCC . Classification rates of 1.0 with p < 0.05 are reached in 94% of the cases in the early condition and 100% in the late condition, using values of ds ≥ 1.6 m and ds ≥ 1.5 m respectively. Figure 13a shows the two unsmoothed cases for early and late. The middle condition is not shown here as it does not differ significantly from the two boundary cases. Table 2. Classification results “Bristol Experiment”: Left vs. Right, bold: mentioned in text. The mentioned confidence intervals represent the boundary cases and all the others can be considered lower. (a) Early. Maximum 95% confidence intervals (p < 0.05) for min and max classification results: min: 0.0333, max: 0.0066; (b) Late. Maximum 95% confidence intervals (p < 0.05) for min and max classification results: min: 0.0327, max: 0.0036. (a) Smoothing
0.0 s
0.02 s
0.03 s
Res.
µ
ds
µ
ds
µ
ds
0 cm
min max
0.49 1.0
0.6 2.2
0.50 1.0
0.6 2.3
0.52 1.0
QTCB 1.9
0.1 cm
min max
0.48 1.0
0.4 2.2
0.47 1.0
QTCB 1.9
0.52 1.0
QTCB 1.6
0.5 cm
min max
0.47 1.0
0.4 2.0
0.50 1.0
0.4 1.6
0.54 1.0
QTCB 1.6
1 cm
min max
0.58 0.99
0.4 2.0
0.47 1.0
QTCB 1.6
0.52 1.0
QTCB 1.7
(b) Smoothing
0.0 s
0.02 s
0.03 s
Res.
µ
ds
µ
ds
µ
ds
0 cm
min max
0.49 1.0
QTCB 2.3
0.49 1.0
QTCB 1.5
0.51 1.0
0.5 1.6
0.1 cm
min max
0.53 1.0
QTCB 2.3
0.52 1.0
0.5 2.4
0.54 1.0
0.6 1.6
0.5 cm
min max
0.56 1.0
0.5 2.0
0.51 1.0
QTCB 2.0
0.51 1.0
QTCB 1.6
1 cm
min max
0.54 1.0
0.4 2.0
0.49 1.0
QTCB 2.4
0.47 1.0
0.5 1.6
Classification rate
Robotics 2015, 4
90
1
1
0.8
0.8
0.6
0.6
0.4
0.4
0.2
0.2
QTCB 0.5
1.0
1.5
2.0
2.5
3.0
QTCC
QTCB 0.5
1.0
1.5
2.0
2.5
3.0
QTCC
2.0
2.5
3.0
QTCC
Threshold ds in m
Classification rate
(a) 1
1
0.8
0.8
0.6
0.6
0.4
0.4
0.2
0.2
QTCB 0.5
1.0
1.5
2.0
2.5
3.0
QTCC
QTCB 0.5
1.0
1.5
Threshold ds in m (b)
Figure 13. Classification results for left vs. right and early vs. late. Dot: mean value, errorbar: 95% confidence interval, red line: H0 , left dashed red line: intimate space [8], right dashed red line: personal space [8]. (a) Results for the left vs. right condition using unsmoothed data. Left: early condition, right: late condition. Significant classification results have been achieved for values ds > 0.8 m regardless of the actual condition and reach optimal results for the classification using ds ≈1.5 m, see yellow, vertical area. The artefact at 2.1 m can be explained by the physical set-up of the experiment, i.e., the corridor width. The increased confidence interval at 2.1 m is due to the “robot” getting tangled up in the curtains once. Blue, horizontal area: 95% confidence interval of pure QTCC for comparison; (b) Results for the early vs. late condition. Left: unsmoothed data, right: highest smoothing values, i.e., 1 cm and 0.03 s. Significant classification results have been achieved for values 0.8 m ≤ ds ≤ 1.3 m regardless of the actual smoothing values, see yellow, vertical area. The good classification result for QTCC with unsmoothed values might be due to artefacts from before the start or after the end of the interaction and must be very minute movements since they disappear when using even the lowest smoothing values.
Robotics 2015, 4
91
Figure 13b shows the results for the comparison of the early and late condition. As can be seen form the figure, the two conditions can be distinguished for distances of 0.8 m ≤ ds ≤ 1.3 m, regardless of the actual smoothing values used. The majority of the values are not significantly different from H0 except for the mention range of ds . The influencing factor here is the actual minimum distances the participants kept to the experimenter in either condition. Fitting a normal distribution over the minimum distances kept in the early and late condition yielded a significant difference (p < 0.05): early: 0.98 m ± 0.02, late: 0.92 m ± 0.02, but the actual total difference between the mean values in the minimum distances for early and late is only 0.06 m; the slightly increased reaction time of 1.4s in the early compared to the late condition is the determining factor for this difference. Both these facts explain the improved classification rate in the mentioned range 0.8 m ≤ ds ≤ 1.3 m. As above, the middle condition is not shown because it does not significantly differ from the two other conditions. The minimum distances kept by the participant in the middle condition are neither significantly different from the early nor the late condition. Hence, classification cannot be achieved. The results for the comparison of the indicator vs. no indicator conditions are very parameter dependent when it comes to smoothing and quantisation. Figure 14a shows the best result (left) and a typical result (right) for different smoothing and quantisation values in the late condition. The distance ds = 0.9 m represents a special case where the classification rates jump to values significantly different from H0 for all smoothing and quantisation value combinations. This can be explained by the minimum distance of 0.92 m to 0.98 m the participants kept to the robot at all times. Using a distance threshold of ds = 0.9 m therefore highlights this part of the interaction by suppressing “unnecessary” information. The early condition is shown in Figure 14b and depicts the best result (left) and a typical result (right) in our evaluation. Similar to the late condition, at ds = 0.9 the classification results typically jump to values close to QTCC . In some cases QTCBC even significantly outperforms QTCC for certain ds , see Figure 14b left. The middle condition just provides noise and is therefore unclassifiable via QTCB , QTCC , or QTCBC .
Classification rate
Robotics 2015, 4
92
1
1
0.8
0.8
0.6
0.6
0.4
0.4
0.2
0.2
QTCB 0.5
1.0
1.5
2.0
2.5
3.0
QTCC
QTCB 0.5
1.0
1.5
2.0
2.5
3.0
QTCC
1.5
2.0
2.5
3.0
QTCC
Threshold ds in m
Classification rate
(a) 1
1
0.8
0.8
0.6
0.6
0.4
0.4
0.2
0.2
QTCB 0.5
1.0
1.5
2.0
2.5
3.0
QTCC
QTCB 0.5
1.0
Threshold ds in m (b)
Figure 14. Classification results for indicator vs. no indicator. Dot: mean value, errorbar: 95% confidence interval, red line: H0 , left dashed red line: intimate space [8], right dashed red line: personal space [8]. Blue, horizontal area: 95% confidence interval of QTCC showing that QTCBC yields similar results for most values of ds and significantly better results for certain distance values. (a) Results for indicator vs. no indicator in the late condition. Left: overall best results, smoothing values: 1 cm and 0.0 s, right: typical result, smoothing values: 1 cm and 0.02 s. The overall results are very dependent on the smoothing parameters. However, a significant jump in classification rates can be observed for ds = 0.9 regardless of the actual smoothing values which can be explained by the model highlighting the distance at which the actual circumvention by the “robot” happened if there was any; (b) Results for indicator vs. no indicator in the early condition. Left: best result, smoothing values, 0.1 cm and 0.00 s, right: typical result, smoothing values 0.01 cm and 0.0 s. Results are very dependent on the smoothing parameters. Unsmoothed values contain too many artefacts to be useful for classification.
Robotics 2015, 4
93
7. Discussion In this section we focus on the interpretation of the classification results presented in Section 6. As described above, employing our probabilistic models as classifiers is used to generate a comparative measure to make assumptions about the quality of the generated representation where significant differences between the two used classes means that our model was able to reliably represent this type of interaction. We are evaluating the general quality of using QTC for the representation of HRSI and investigate the different distances or ranges of distances for the proposed QTCBC based model to find suitable regions for the switch between the two variants. Limitations A possible limitation is that the presented computational model was not evaluated in a dedicated user study but on two data sets from previous experiments. However, a model of HRSI should be able to represent any encounter between a robot and a human in a confined shared space. The two used experiments might not have been explicitly designed to show the performance of the presented approach but provide the type of interactions usually encountered in corridor type situations, which represents a major part of human-aware navigation. Additionally, the instructions given in the “Bristol Experiment”, to cross the corridor with as little veering as possible, might have also influenced the participants behaviour when it comes to keeping the appropriate distances and will therefore also have influence on their experienced comfort and the naturalness of the interaction. However, as we can see from Figure 15, the left vs. right conditions yielded similar results in both experiments which indicates that these instructions did not have a significant influence on the participants spatial movement behaviour. Future work, including the integration of this system into an autonomous robot however, will incorporate user studies in a real work environment evaluating not only the performance of the presented model but also of a larger integrated system building upon it. Our presented probabilistic QTCBC uses d(k, l)t−1 and d(k, l)t to determine if the representation should transition from QTCB to QTCC or vice-versa. This might lead to unwanted behaviour if the distance d(k, l) oscillates around ds . This has to be overcome for “live” applications, e.g., by incorporating qualitative relations with learned transition probabilities for close and far. For the following discussion, due to the experimental set-up, we can assume that this had no negative effect on the presented data. A general limitation of QTC is that actual sensor data does not coincide with the constraints of a continuous observation model represented by the CND. In the “Lincoln” data for example we encountered up to 521 illegal transitions which indicates that raw sensor data is not suitable to create QTC state sequences without post-processing. This however, was solved by using our proposed HMM based modelling adhering to the constraints defined in the CND, only producing valid state transitions. A major limitation is that important HRSI concepts such as speed, acceleration, and distance, are hard to represent using QTC. While regular QTCB is able to represent relative speeds, it is neither possible to represent the velocity nor acceleration of the robot or the human. Therefore, QTC alone is not very well suited to make statements about comfort, naturalness, and sociability, as defined by Kruse et al. [9], of a given HRSI encounter. We showed that, using implicit distance modelling is able to enrich QTC with such concepts but many more are missing.
Robotics 2015, 4
94
Classification rate
1 0.9 0.8 0.7 0.6 Lincoln Mean Lincoln Bristol Mean Bristol
0.5
QTCB
0.5
1.0
1.5
2.0
2.5
3.0
Threshold ds in m Figure 15. Comparing “Lincoln” and “Bristol” experiment results: Passing on the left vs. passing on the right. The blue curve represents the “Lincoln” experiment classification rates using the lowest smoothing values and the green curve represents the unsmoothed classification rate for the “Bristol” experiment, respectively. The curve has been obtained using a smoothing spline [47] with a p-value of p = 0.99. Red line: H0 , left dashed red line: intimate space [8], right dashed red line: personal space [8], yellow area: maximum interval for QTCBC transitions. The better results for the “Bristol” experiment can be explained by the larger amount of training data. Another limitation of QTC is the impossibility to infer which agent executes the actual circumvention action in the head-on scenario. When interpreting the graph in Figure 6, we are not sure if the human, the robot, or both are circumventing each other. We just know that the human started the action but we do not know if the robot participated or not. This could eventually be countered by using the full QTCC approach including the relative angles. Even then, it might not be possible to make reliable statements about that and it would also complicate the graph and deprive it of some of its generalisation abilities. Head-on vs. Overtake The presented classification of head-on vs. overtaking (see Table 1a) shows that QTCB , QTCC , and QTCBC , regardless of the chosen ds , are able to reliably classify these two classes. We have seen that there are cases where pure QTCB outperforms pure QTCC . This is not surprising because the main difference of overtaking and head-on lies in the (q1 q2 ) 2-tuple of QTCB , i.e., both agents move in the same direction, e.g., (−+), vs. both agents are approaching each other (−−). The 2D (q4 q5 ) QTCC information can therefore be disregarded in most of the cases and only introduces additional noise. This indicates that QTCB would be sufficient to classify head-on and overtaking scenarios but would of course not contain enough information to be used as a generative model or to analyse the interaction. QTCBC allows to incorporate the information about which side robot and human should use to pass each other and the distance at which to start circumventing. Additionally, QTCBC also allows to disregard information for interactants far apart, only employing the finer grained
Robotics 2015, 4
95
QTCC where necessary, i.e., when close to each other. Since all of the found classification results were significantly different from p = 0.5–the Null Hypothesis (H0 ) for a two class problem–this distance can be freely chosen to represent a meaningful value like Hall’s personal space 1.22 m [8]. By doing so, we also create a more concise and therefore tractable model as mentioned in our requirements for HRSI modelling. Left vs. Right The comparison of left vs. right pass-by actions in both experiments shows that using pure QTCB does, not surprisingly, yield bad results because the most important information–on which side the robot and the human pass by each other–is completely omitted in this 1-dimensional representation. Hence, all the classification results show that an increase in information about the 2-tuple (q4 q5 ) representing the 2D movement increases the performance of the classification. On the other hand, the results of both experiments show that the largest increase in performance of the classifier happens at distances of ds ≥ 0.7 m and that classification reaches QTCC quality at ds ≥ 1.5 m (see yellow area in Figures 12a, 13a and 15), which loosely resembles the area created by the far phase of Hall’s personal space and the close phase of the social space [8]. These results could stem from the fact that the personal space was neither violate by the robot–be it fake or real–nor the participant. Judging from our data, the results indicate that information about the side (q4 q5 ) is most important if both agents enter, or are about to enter, each others personal spaces as can be seen from the yellow areas in Figures 12a, 13a and 15. The information before crossing this threshold can be disregarded and is not important for the reliable classification of these two behaviours. As mentioned in our requirements, recognising the intention of the other interactant is a very important factor in the analysis of HRSI. Reducing the information about the side constraint and only regarding it when close together, allows to focus on the part of the interaction where both agents influence each others paths and therefore facilitates intention recognition, based on spatial movement. Figure 15 shows that our model gives consistent results over the two experiments in the left vs. right condition which is the only one we could compare in both. The blue curve shows the classification results for the “Lincoln experiment” whereas the green curve shows the results for the “Bristol experiment”. Both curves show the same trends of significantly increasing classification results from 0.7 m ≤ ds ≤ 1.5 m reaching their pinnacle at 1.5 m ≤ ds ≤ 2.0 m. This implies that our model is valid for this type of interaction regardless of the actual environment set-up and that the fact that we used an autonomous robot in one of the experiments and a “fake robot” in the other does not influence the data. More importantly, it also shows a suitable distance range for this kind of HRSI that also encloses all the other found distance ranges from the other conditions and is therefore a suitable candidate for QTCBC transitions. Adaptive vs. Non-Adaptive Velocity Control Using a probabilistic model of pure QTCC (as attempted in [13]), it was not possible to reliably distinguish between the two behaviours the robot showed during the “Lincoln experiment”, i.e., adaptive vs. non-adaptive velocity control. We investigated if QTCBC would sufficiently highlight the part of the interaction that contains the most prominent difference between these two classes to enable a correct classification. Indeed, the results indicate that using a very low distance threshold ds enables QTCBC to distinguish between these two
Robotics 2015, 4
96
cases for some of the smoothing levels. In Figure 12b on the left side you can see the results from our previous work (using only pure QTCC ) [13] visualised by a horizontal blue area. The Figure also shows that some of the QTCBC results are significantly different from QTCC . Like for head-on vs. overtake, the main difference between the adaptive and non-adaptive behaviour seems to lie in the (q1 q2 ) 2-tuple, i.e., both approach each other (−−) vs. human approaches and robot stops (−0). On the other hand, the classification rate drops to p ≈ 0.5 (H0 ) at ds = 1.3 m most likely due to the increase in noise. Nevertheless, apart from these typical results, there is also an interesting example where this does not hold true and we see a slight increase in classification rate at ds = 1.5 m which was the stopping distance of the robot (see Figure 12b, right). This shows that, even with QTCBC , the results for adaptive vs. non-adaptive seem to be very dependent on the smoothing parameters (see Table 1c) and therefore this problem still cannot be considered solved. Incorporating another HRSI concept, i.e., velocity or acceleration, might be able to support modelling of these kind of behaviours. Early vs. Late Looking at the data gathered in the “Bristol experiment”, we also evaluated early vs. late (see Figure 13b) avoidance manoeuvres. Just to recapitulate, early means the “robot” executed the avoidance manoeuvre 700 ms before the indicator and in the late condition 700 ms after. The data shows that our model is able to represent this kind of interaction for distances of 0.8 m ≤ ds ≤ 1.3 m. This is the distance the participants kept to the robot/experimenter in both experiments and loosely resembles Hall’s personal space [8]. In this regard these results are consistent with the other described interactions showing that participants tried to protect their personal/intimate space. Except for the unsmoothed evaluation, we only achieved reliable classification using QTCBC inside the mentioned range of 0.8 m ≤ ds ≤ 1.3 m. QTCB or QTCC alone did not highlight the meaningful parts of the interaction and did not yield reliable results. Regarding the unsmoothed case, the fact that all the smoothing levels resulted in a significantly worse QTCC classification than in the unsmoothed case shows that the unsmoothed result is most likely caused by artefacts due to minute movements before the start or after the end of the experiment. These movements cannot be regarded as important for the actual interaction and must therefore be considered unwanted noise. Indicator vs. No Indicator The “Bristol experiment” also used indicators (be it flashing lights or cartoon eyes) to highlight the side the “robot” would move to. In the control condition no indicators were used. Modelling these two conditions we can see from the late condition that for ds ≥ 0.9 m, which resembles the mean minimum distance kept by the participant, we can reliably distinguish the two cases. The classification rate does not improve significantly for greater distances or pure QTCC but we are always able to reliably classify these two conditions. Compared to QTCBC at ds ≥ 0.9 m, pure QTCC shows worse results for some of the smoothing levels. This indicates that the most important part of the interaction happens at close distances (the mean minimum distance of both agents ds ≈ 0.9 m) and adding more information does not increase the accuracy of the representation or even decreases it.
Robotics 2015, 4
97
8. Conclusions In this work we presented a HMM-based probabilistic sequential representation of HRSI utilising QTC, investigated the possibility of incorporating distances like the concept of proxemics [8] into the model, and learned transitions in our combined QTC model and ranges of distances to trigger them, from real-world data. The data from our two experiments provides strong evidence regarding the generalisability and appropriateness of the representation, demonstrated by using it to classify different encounters observed in motion-capture data. We thereby created a tractable and concise representation that is general enough to abstract from metric space but rich enough to unambiguously model the observed spatial interactions between human and robot. Using two different experiments, we have shown that, regardless of the modelled interaction type, our probabilistic sequential model using QTC is able to reliably classify most of the encounters. However, there are certain distances after which the “richer” 2D QTCC encoding about the side constraint does not enhance the classification and thereby becomes irrelevant for the representation of the encounter. Hence, QTCB ’s 1D distance constraint is sufficient to model these interactions when the agents are far apart. On the other hand, we have seen that there are distances at which information about the side constraint becomes crucial for the description of the interaction like in passing on the left vs. passing on the right. Thus, we found that there are intervals of distances between robot and human in which a switch to the 2-dimensional QTCC model is necessary to represent HRSI encounters. These found distance intervals resemble the area of the far phase of Hall’s personal space and the close phase of the social space, i.e., 0.76 m to 2.1 m [8] (see Figure 15). Therefore, our data shows that using the full 2D representation of QTCC is unnecessary when the agents are further apart than the close phase of the social space (≈2.1 m) and can therefore be omitted. This not only creates a more compact representation but also highlights the interaction in close vicinity of the robot, modelling the essence of the interaction. Our results indicate that this QTCBC model is a valid representation of HRSI encounters and reliably describes the real-world interactions in the presented experiments. As a welcome side effect of modelling distance using QTCBC , our results show that the quality of the created probabilistic model is, in some cases, even increased compared to pure QTCB or QTCC . Thereby, besides allowing the representation of distance and the reduction of noise, it also enhances the representational capabilities of the model for certain distance values and outperforms pure QTCC . This shows the effect of reducing noise by filtering “unnecessary” information and focusing on the essence of the interaction. Coming back to the four requirements to a model of HRSI stated in the introduction which were to Represent the qualitative character of motions to recognise intention, represent the main concepts of HRSI like proxemics [8], be able to generalise to facilitate knowledge transfer, and devise a tractable, concise, and theoretically well-found model, we have shown that our sequential model utilising QTCBC is able to achieve most of these. We exclusively implemented proxemics in our model which leaves room for improvement, incorporating other social norms, but shows that such a combination is indeed possible. Additionally, our representation is not only able to model QTCB and QTCC but also the proposed combination of both, i.e., QTCBC , which relies on the well founded original variants of the calculus. Therefore, the
Robotics 2015, 4
98
probabilistic sequential model based on QTCBC allows to implicitly represent one of the main concepts of HRSI, distances. We do so by combining the different variants of the calculus, i.e., the mentioned QTCB and QTCC , into one integrated model. The resulting representation is able to highlight the interaction when the agents are in close vicinity to one another, allowing to focus on the qualitative character of the movement and therefore facilitates intention recognition. By eliminating information about the side the agents are moving to when far apart, we also create a more concise and tractable representation. Moreover, the model also inherits all the generalisability a qualitative representation offers. This is a first step to employ learned qualitative representations of HRSI for the generation and analysis of appropriate robot behaviour. Concluding from the above statements, the probabilistic model of QTCBC is able to qualitatively model the observed interactions between two agents, abstracting from the metric 2D-space most other representations use, and implicitly incorporates the modelling of distance thresholds which, from the observations made in our experiments, represent one of the main social measures used in modern HRSI, proxemics [8]. 9. Future Work This research was undertaken as part of an ongoing project (the STRANDS project [48]) for which it will be used to generate appropriate HRSI behaviour based on previously observed encounters. The presented model will therefore be turned into a generative model to create behaviour as the basis for an online shaping framework for an autonomous robot. As part of this project, the robot is going to be deployed in an elder care home and an office building for up to 120 days continuously, able to collect data about the spatial movement of humans in real work environments. To represent the interesting distance intervals we found in a more qualitative way, we will investigate possible qualitative spatial relations, e.g., close and far, ranging over the found interval of distances, instead of fixed thresholds. This will also be based on a probabilistic model using increasing transition probabilities depending on the current distance and the distance interval used. For example transitioning from QTCB to QTCC would be more likely the closer the actual distance is to the lower bound of the learned interval and vice-versa. In a generative system this will introduce variation and enables the learning of these distance thresholds. To further improve this representation, we will work on a generalised version of our presented QTCBC to deal with different and possibly multiple variants of QTC, which are not restricted to QTCB and QTCC , based also on other metrics beside Hall’s social distances to allow behaviour analysis and generation according to multiple HRSI measures. The experiments we used were originally meant to investigate different aspects of HRSI and not to evaluate our model explicitly. Some of the more interesting phenomena in the experiments, especially the “Bristol Experiment”, like if the indicators had an effect on the interaction between the two agents or if the timing was important for the use of the indicators, will be investigated in more psychology focused work.
Robotics 2015, 4
99
Acknowledgments The research leading to these results has received funding from the European Community’s Seventh Framework Programme under grant agreement No. 600623, STRANDS. The Bristol study was supported by an equipment grant from the Wellcome Trust (WT089367AIA) to set up the laboratory, and Brett Adey was supported by a Summer Vacation Scholarship, also by the Wellcome Trust. Alice Haynes was supported by an EPSRC Vacation Bursary. The authors would also like to thank Brett Adey and Alice Haynes for conducting the “Bristol experiment”. Author Contributions Kerstin Eder and Ute Leonards conceived and designed the “Bristol” experiment; Christian Dondrup and Marc Hanheide conceived and designed the “Lincoln” experiment; Christian Dondrup performed the “Lincoln” experiment; Christian Dondrup analyzed the data of both experiments; Marc Hanheide and Nicola Bellotto contributed analysis tools; Marc Hanheide contributed the initial implementation of a Hidden Markov Model for the Qualitative Trajectory Calculus state chains; Nicola Bellotto contributed the correct definitions of QTCB and QTCC ; Christian Dondrup contributed the definition of QTCBC ; Christian Dondrup contributed the implementation of the unified Hidden Markov Model of QTCB , QTCC , and QTCBC state chains; Christian Dondrup wrote the paper. Conflicts of Interest The funding sponsors had no role in the design of the study; in the collection, analyses, or interpretation of data; in the writing of the manuscript, and in the decision to publish the results. References 1. Steinfeld, A.; Fong, T.; Kaber, D.; Lewis, M.; Scholtz, J.; Schultz, A.C.; Goodrich, M. Common metrics for human-robot interaction. In Proceeding of the 1st ACM SIGCHI/SIGART Conference on Human-Robot Interaction-HRI ’06, Salt Lake City, UT, USA, 2–3 March 2006; p. 33. 2. Borenstein, J.; Koren, Y. Real-time obstacle avoidance for fast mobile robots. IEEE Trans. Syst. Man Cybern. 1989, 19, 1179–1187. 3. Simmons, R. The curvature-velocity method for local obstacle avoidance. In Proceeding of the IEEE International Conference on Robotics and Automation, Minneapolis, MN, USA, 22–28 April 1996; Volume 4, pp. 3375–3382. 4. Sisbot, E.; Marin-Urias, L.; Alami, R.; Simeon, T. A Human Aware Mobile Robot Motion Planner. IEEE Trans. Robot. 2007, 23, 874–883. 5. Yoda, M.; Shiota, Y. Analysis of human avoidance motion for application to robot. In Proceeding of the 5th IEEE International Workshop on Robot and Human Communication, RO-MAN’96, Tsukuba, Japan, 11–14 November 1996; pp. 65–70. 6. Feil-Seifer, D.J.; Matari´c, M.J. People-Aware Navigation For Goal-Oriented Behavior Involving a Human Partner. In Proceedings of the International Conference on Development and Learning, Frankfurt am Main, Germany, 24–27 August 2011.
Robotics 2015, 4
100
7. Ducourant, T.; Vieilledent, S.; Kerlirzin, Y.; Berthoz, A. Timing and distance characteristics of interpersonal coordination during locomotion. Neurosci. Lett. 2005, 389, 6–11. 8. Hall, E.T. The Hidden Dimension; Anchor Books: New York, NY, USA, 1969. 9. Kruse, T.; Pandey, A.K.; Alami, R.; Kirsch, A. Human-aware robot navigation: A survey. Robot. Auton. Syst. 2013, 61, 1726–1743. 10. Peters, A. Small movements as communicational cues in HRI. In Proceeding of the 6th ACM SIGCHI/SIGART Conference on Human-Robot Interaction-HRI ’11, Lausanne, Switzerland, 6–9 March 2011; pp. 72–73. 11. Hanheide, M.; Peters, A.; Bellotto, N. Analysis of human-robot Spatial behaviour applying a qualitative trajectory calculus. In Proceeding of the RO-MAN, Paris, France, 9–13 September 2012; pp. 689–694. 12. Bellotto, N.; Hanheide, M.; van de Weghe, N. Qualitative Design and Implementation of Human-Robot Spatial Interactions. In Proceeding of the International Conference on Social Robotics (ICSR), Bristol, UK, 27–29 October 2013. 13. Dondrup, C.; Bellotto, N.; Hanheide, M. A Probabilistic Model of Human-Robot Spatial Interaction using a Qualitative Trajectory Calculus. In Proceeding of the 2014 AAAI Spring Symposium Series, Palo Alto, CA, USA, 24–26 March 2014. 14. Dondrup, C.; Bellotto, N.; Hanheide, M. Social distance augmented qualitative trajectory calculus for Human-Robot Spatial Interaction. In Proceeding of the 23rd IEEE International Symposium on Robot and Human Interactive Communication, 2014 RO-MAN, Edinburgh, UK, 25–29 August 2014; pp. 519–524. 15. Van de Weghe, N. Representing and Reasoning about Moving Objects: A Qualitative Approach. Ph.D. Thesis, Ghent University, Ghent, Belgium, 2004. 16. Pacchierotti, E.; Christensen, H.I.; Jensfelt, P. Evaluation of Passing Distance for Social Robots. In Proceeding of the 15th IEEE International Symposium on Robot and Human Interactive Communication, RO-MAN 2006, Hafield, UK, 6–8 September 2006; pp. 315–320. 17. Lichtenthäler, C.; Peters, A.; Griffiths, S.; Kirsch, A. Social Navigation-Identifying Robot Navigation Patterns in a Path Crossing Scenario; In Social Robotics; Springer International Publishing, Switzerland, 2013; pp. 84–93. 18. Cohn, A.G.; Renz, J. Chapter 13 Qualitative Spatial Representation and Reasoning. In Handbook of Knowledge Representation; van Harmelen, F., Lifschitz, V., Porter, B., Eds.; Elsevier: Amsterdam, The Netherlands, 2008; Volume 3, pp. 551–596. 19. Torta, E.; Cuijpers, R.H.; Juola, J.F.; van der Pol, D. Design of robust robotic proxemic behaviour. In Social Robotics; Springer: Berlin Heidelberg, Germany, 2011; pp. 21–30. 20. Aldebaran Robotics. NAO robot: intelligent and friendly companion. Available online: https://www.aldebaran.com/en/humanoid-robot/nao-robot (accessed on 18 March 2015). 21. Walters, M.L.; Oskoei, M.A.; Syrdal, D.S.; Dautenhahn, K. A Long-Term Human-Robot Proxemic Study. In Proceeding of the 20th IEEE International Symposium on Robot and Human Interactive Communication, Atlanta, GA, USA, 31 July–3 August 2011; pp. 137–142. 22. Tranberg Hansen, S.; Svenstrup, M.; Andersen, H.J.; Bak, T. Adaptive human aware navigation based on motion pattern analysis. In Proceeding of the 18th IEEE International
Robotics 2015, 4
23.
24. 25.
26.
27.
28.
29.
30.
31.
32.
33.
34.
101
Symposium on Robot and Human Interactive Communication, RO-MAN 2009, Toyama, Japan, 27 September–2 October 2009; pp. 927–932. Kirby, R.; Simmons, R.; Forlizzi, J. COMPANION: A Constraint-Optimizing Method for Person-Acceptable Navigation. In Proceeding of the 18th IEEE International Symposium on Robot and Human Interactive Communication, Toyama, Japan, 27 September–2 October 2009; pp. 607–612. Lu, D.V.; Allan, D.B.; Smart, W.D. Tuning Cost Functions for Social Navigation. In Social Robotics; Springer International Publishing: Switzerland, 2013; pp. 442–451. Scandolo, L.; Fraichard, T. An anthropomorphic navigation scheme for dynamic scenarios. In Proceeding of the 2011 IEEE International Conference on Robotics and Automation (ICRA), Shanghai, China, 9–13 May 2011; pp. 809–814. Svenstrup, M.; Bak, T.; Andersen, H.J. Trajectory planning for robots in dynamic human environments. In Proceeding of the 2010 IEEE/RSJ International Conference on Intelligent Robots and Systems (IROS), Taipei, Taiwan, 18–22 October 2010; pp. 4293–4298. Martinez-Garcia, E.A.; Akihisa, O.; Yuta, S. Crowding and guiding groups of humans by teams of mobile robots. In Proceeding of the 2005 IEEE Workshop on Advanced Robotics and its Social Impacts, Nagoya, Japan, 12–15 June 2005; pp. 91–96. Tamura, Y.; Dai Le, P.; Hitomi, K.; Chandrasiri, N.P.; Bando, T.; Yamashita, A.; Asama, H. Development of pedestrian behavior model taking account of intention. In Proceeding of the 2012 IEEE/RSJ International Conference on Intelligent Robots and Systems (IROS), Vilamoura, Algarve, Portugal, 7–12 October 2012; pp. 382–387. Feil-Seifer, D.; Mataric, M. People-aware navigation for goal-oriented behavior involving a human partner. In Proceeding of the 2011 IEEE International Conference on Development and Learning (ICDL), Frankfurt am Main, Germany, 24–27 August 2011; Volume 2, pp. 1–6. Garrido, J.; Yu, W. Trajectory generation in joint space using modified hidden Markov model. In Proceedingof the 23rd IEEE International Symposium on Robot and Human Interactive Communication, Edinburgh, UK, 25–29 August 2014; pp. 429–434. Avrunin, E.; Simmons, R. Socially-appropriate approach paths using human data. In Proceeding of the 23rd IEEE International Symposium on Robot and Human Interactive Communication, Edinburgh, UK, 25–29 August 2014; pp. 1037–1042. Kushleyev, A.; Likhachev, M. Time-bounded lattice for efficient planning in dynamic environments. In Proceeding of the IEEE International Conference on Robotics and Automation, ICRA’09, Kobe, Japan, 12–17 May 2009; pp. 1662–1668. Tadokoro, S.; Hayashi, M.; Manabe, Y.; Nakami, Y.; Takamori, T. On motion planning of mobile robots which coexist and cooperate with human. In Proceeding of the 1995 IEEE/RSJ International Conference on Intelligent Robots and Systems 95. Human Robot Interaction and Cooperative Robots, Pittsburgh, PA, USA, 5–9 August 1995; Volume 2, pp. 518–523. Ohki, T.; Nagatani, K.; Yoshida, K. Collision avoidance method for mobile robot considering motion and personal spaces of evacuees. In Proceeding of the 2010 IEEE/RSJ International Conference on Intelligent Robots and Systems (IROS), Taipei, Taiwan, 18–22 October 2010; pp. 1819–1824.
Robotics 2015, 4
102
35. Bennewitz, M. Mobile robot navigation in dynamic environments. Ph.D. Thesis, University of Freiburg, Freiburg, Germany, 2004. 36. Bennewitz, M.; Burgard, W.; Cielniak, G.; Thrun, S. Learning motion patterns of people for compliant robot motion. Int. J. Robot. Res. 2005, 24, 31–48. 37. Ziebart, B.D.; Ratliff, N.; Gallagher, G.; Mertz, C.; Peterson, K.; Bagnell, J.A.; Hebert, M.; Dey, A.K.; Srinivasa, S. Planning-based prediction for pedestrians. In Proceeding of the IEEE/RSJ International Conference on Intelligent Robots and Systems, IROS 2009, St. Louis, MO, USA, 11–15 October 2009; pp. 3931–3936. 38. Chung, S.Y.; Huang, H.P. A mobile robot that understands pedestrian spatial behaviors. In Proceeding of the 2010 IEEE/RSJ International Conference on Intelligent Robots and Systems (IROS), Taipei, Taiwan, 18–22 October 2010; pp. 5861–5866. 39. Randell, D.A.; Cui, Z.; Cohn, A.G. A spatial logic based on regions and connection. In Proceedings of the 3rd International Conference on Principles of Knowledge Representation and Reasoning (KR’92), Cambridge, MA, 25–29, 1992; pp. 165–176. 40. Strands EU FP7 Project, No. 600623. Qualitative Spatial Representations Library. Available online: https://github.com/strands-project/strands_qsr_lib (accessed on 18 March 2015). 41. Delafontaine, M. Modelling and Analysing Moving Objects and Travelling Subjects: Bridging Theory and Practice. Ph.D. Thesis, Department of Geography, Ghent University, Ghent, Belgium, 2011. 42. Fink, G.A. Markov Models for Pattern Recognition; Springer-Verlag: Berlin Heidelberg, Germany, 2008. 43. Dondrup, C.; Lichtenthäler, C.; Hanheide, M. Hesitation signals in human-robot head-on encounters: A pilot study. In Proceedings of the 2014 ACM/IEEE International Conference on Human-Robot Interaction, ACM, Bielefeld, Germany, 3–6 March 2014; pp. 154–155. 44. Lincoln Centre for Autonomous Systems Research. Raw Study Data. Available online: https://github.com/LCAS/data (accessed on 18 March 2015). 45. Fox, D.; Burgard, W.; Thrun, S. The dynamic window approach to collision avoidance. IEEE Robot. Autom. Mag. 1997, 4, 23–33. 46. Thrun, S.; Burgard, W.; Fox, D. Probabilistic Robotics; MIT Press: Cambridge, MA, USA, 2005. 47. De Boor, C. A Practical Guide to Splines; Springer: New York, NY, USA, 1978. 48. Strands EU FP7 Project, No. 600623. The STRANDS Project. Available online: http://strands-project.eu (accessed on 18 March 2015). c 2015 by the authors; licensee MDPI, Basel, Switzerland. This article is an open access article
distributed under the terms and conditions of the Creative Commons Attribution license (http://creativecommons.org/licenses/by/4.0/).