Deixis and Gaze in Collaborative Work at a Distance (over a shared map): a Computational Model to Detect Misunderstandings Mauro Cherubini∗
Marc-Antoine N¨ussli† ´Ecole Polytechnique F´ed´erale de Lausanne CRAFT, Station 1, CH-1015 Lausanne, Switzerland
Pierre Dillenbourg‡
Abstract
proposed less invasive solutions allowing the user to choose when to display deixis to the partner (e.g., M¨ulpfordt [2005]).
This paper presents an algorithm that detects misunderstandings in collaborative work at a distance. It analyses the movements of collaborators’ eyes on the shared workspace, their utterances containing references about this workspace, and the availability of ’remote’ deictic gestures. This method is based on two findings: 1. participants look at the points they are talking about in their message; 2. their gazes are more dense around these points compared to other random looks in the same timeframe. The algorithm associates the distance between the gazes of the emitter and gazes of the receiver of a message with the probability that the recipient did not understand the message.
However, these sorts of virtual gestures might differ greatly from an actual movement of the finger over a map while face-to-face. In presence, deixis is always used in conjunction with eye gazing while this is not possible at distance, at least not with commonly available technology. The speaker who decides to use a deictic gesture can verify with his/her own gaze whether or not the listener has seen this gesture. In the same way, the listener also visually perceives communicative gestures. Gaze has, therefore, a double nature: it is both a perceptual and a communicative device. Along this line, other solutions have been proposed to visualize and continuously share the position of the eyes of remote collaborators on a shared workspace (e.g., the GAZE groupware system [Vertegaal 1999]). More sophisticated solutions employed ad-hoc devices, like the ClearBoard system [Ishii and Kobayashi 1992], or the gaze awareness display system proposed by Monk and Gale [2002]). It is a shared conviction that eye-based interfaces offer enormous potential for efficient human-computer interaction, but also that the challenges for a proficient use of this technology lie in the difficulty of interpreting eye movements accurately. Just as it is difficult to infer comprehension from users’ speech, eyemovement data analysis requires a fine mapping between the observed eye movements and the intentions of the user that produced them [Salvucci 1999]. Pursuing this research direction, we argue that by combining multi-modalities of communication, such as deixis and gaze, we can build efficient solutions to support collaborative work at a distance without the burden of continuously displaying virtual finger or eye movements when they might not be relevant. An example of this approach is the RealTourist application proposed by Qvarfordt [2005].
CR Categories: H.5.3 [Information interfaces and presentation (e.g., HCI)]: Group and organizational intefaces—collaborative computingcomputer-supported collaborative work; Keywords: Computer-Supported Collaborative Work, Remote Deixis, Remote Collaborative Tasks, Focus of Attention, Spatial Cognition
1 Introduction When collaborators are not co-located, their ability to work together is reduced. During the last three decades, many solutions have been proposed to improve the efficiency of work at distance. The main philosophy of many of these was to increase bandwidth so as to better emulate a face-to-face interaction [Whittaker et al. 1993]. This approach is limited, because an increase of bandwidth is not always possible [Nardi 2005], fruitful [Kraut et al. 2003], or advisable (e.g., air traffic control). The issue is to find valid alternatives for communication mechanisms that are effective in presence but not available in remote collaboration settings.
In this paper, we propose an algorithm which combines a language analysis of spatial expressions with gaze movements and virtual deictic gestures (see section 4). We report the results of an experimental study where we analyzed performance and processes of teams who had to organize a music festival on their university campus. They collaborated at a distance using a chat tool and a shared map. We compared experimental conditions where participants could link messages to the map against a control setup where participants could not create these links (see section 3.6).
One of the communicative devices that is seamlessly used by teams interacting face-to-face is deixis. Pointing to an object in space leads the conversation participants to focus attention on that object, with a consequent disambiguation of context, and an economy of words used. A handful of solutions have been envisioned to overcome the lack of deixis at a distance. Early attempts consisted in continuously showing the mouse pointer of a collaborator on the partner’s workspace [Gutwin and Greenberg 2004], or through videoconference systems [Bauer et al. 1999]. Recently, researchers
2 Background When people interact to solve a problem, they need a shared language to coordinate their ideas and actions. They use multimodal signals to communicate their intentions to their partners, monitor the status of the collaboration and repair misunderstandings. Clark developed a theory describing how conversational partners develop a shared understanding, by building shared knowledge or common ground [Clark 1996]. Clark defined the process of reaching this common ground, called grounding, as the effort of conversational partners to share their attitudes, beliefs, expectations and mutual knowledge [Clark and Shaefer 1989], and showed how this effort is highly dependent on the media participants use to communicate. However, this linguistic theory analyses conversation on a micro
∗
[email protected] †
[email protected] ‡
[email protected]
Copyright © 2008 by the Association for Computing Machinery, Inc. Permission to make digital or hard copies of part or all of this work for personal or classroom use is granted without fee provided that copies are not made or distributed for commercial advantage and that copies bear this notice and the full citation on the first page. Copyrights for components of this work owned by others than ACM must be honored. Abstracting with credit is permitted. To copy otherwise, to republish, to post on servers, or to redistribute to lists, requires prior specific permission and/or a fee. Request permissions from Permissions Dept, ACM Inc., fax +1 (212) 869-0481 or e-mail
[email protected]. ETRA 2008, Savannah, Georgia, March 26–28, 2008. © 2008 ACM 978-1-59593-982-1/08/0003 $5.00
173
or ‘utterance’ level and is not developed to describe the macro or ‘knowledge’ level, which is associated with learning or with the collaboration process. While the micro level focuses on the dialogue interchange occurring between two or more interlocutors, the macro level refers to the shared understanding that is constructed as a consequence of that exchange.
2.1
gestural and verbal deixis efficiently to focus their partner’s attention during a bicycle repair task. In situations of collaborative work at distance, gaze, and deixis, are usually not transferred between peers. However, specific interface design might permit the users to communicate their deictic gestures or share their eye movements. In this case we will talk of Explicit Referencing [Cherubini and Dillenbourg 2007] and Full Gaze Awareness [Monk and Gale 2002], respectively.
Deixis and Gaze at the Linguistic Level
A handful of researchers from different fields have investigated the effects of referencing with virtual gestures on collaborative work at a distance: the more the objects the conversation refers to are visible and shared by the communication peers, the better the performance in the collaboration [Fussell et al. 2004]. Similarly, Kirk et al. [2007] demonstrated that performance improvements still occurred when the remote gestures format was altered from a digital sketch to an unmediated representation of hands.
Communication is naturally multimodal. Interlocutors use all available channels to convey their meanings and monitor their partners’ understanding. Having different signaling options is particularly useful when the content of a message might become ambiguous in certain contexts. In these cases, people will tend to minimize their grounding effort [Clark and Brennan 1991], mixing modalities instead of offering redundant verbal information. In face-to-face interactions, disambiguation is often performed with a simple referencing gesture. Sometimes however, referencing is implicit in the language interchange (e.g., if after visiting an art gallery, interlocutors comments intensively on an astonishing painting, the use of the expression “that painting”, will not result in ambiguity). Additionally, deictic gestures are naturally intertwined with gazing. Through gaze, we monitor whether our conversational partner has perceived our gesture.
Brennan [1990] devised an experimental task where two participants had to coordinate their actions over a shared map in order to park two icon-cars in the same spot. The author varied the availability of visual information and the knowledge of the physical site the map was representing. People were slower but more precise in the matching task when ‘the helper’ did not have visual evidence of the actions of ‘the worker’. These results suggest that the use of Explicit Referencing pushes the collaborators to focus their gaze, and therefore their attention, on each other’s contributions. Thus, it is logical to expect that better coordinated attention results in better interaction. Indeed, Richardson and Dale [2005] found that the higher the degree of eye movement coupling between a listener and a speaker, the better the listener comprehension.
Clark [2003] explained that communication is ordinarily anchored to the material world and that one way it gets anchored is through pointing. Indicating has fundamentally to do with creating indexes for things. Every indication must establish an intrinsic connection between the signal and its object. The more transparent this connection is, the more effective is the act of communication. That is why we cannot use the indication to an object without the originating signal. Finally, indicating an object in space must also lead the participants to focus attention, and therefore gaze, on that object.
Similar results were also obtained by Ishii and Kobayashi [1992]. They designed a system called ClearBoard where remote collaborators could see video images of each other through a shared drawing board. They showed that preserving the relative position of the participants and their gaze direction could be beneficial for cooperative problem solving. A similar setup was proposed by Monk and Gale [2002]. Their findings demonstrate a reduction of speech quantity and ambiguity. However, they did not find an improvement of performance over a control condition. We can hypothesize that the positive effects on language might be annihilated by a negative impact of displaying continuously irrelevant or intrusive information on the position of the partner’s eyes.
This implies that effective indicating gestures should attract eye movements. However, gazing is not just a perception device. Clark and Krych [2004] highlighted how speakers monitor their own speech and how gazing is a communication device used to designate the person or things the speaker is attending to. These authors also showed how gaze is used to monitor the addressees’ understanding while one is speaking, with the aim of altering the speaker’s utterances midcourse in case of evidence of miscomprehension. Similarly, Richardson and Dale [2005] demonstrated how the eye movements of a listener following a speaker monologue were significantly related to the eye movements of the speaker over the same visual scene. The authors argue that by moving the eyes closely in step with a speaker, the listener does not perceive new visual data, but s/he organizes information in the same way as the speaker. Similarly in this paper, we hypothesize that the speaker also uses gaze to verify the correctness of utterances s/he is producing and particularly those containing references to the shared workspace. This hypothesis was proven to be true in a research conducted by Griffin and Bock [2000], which showed that speech production is always preceded by gazes at the referenced object. These results have been obtained from a task involving oral conversations but we could speculate that a similar process is also at work in written communication.
2.2
2.3
Hypotheses
The background discussion reported above suggests the hypothesis that message emitters will tend to look at the objects they are referring to in their utterances. Also, it highlights the importance of coordinating eye-movements for collaborative work (here called gaze convergence, with gaze divergence being its antonym), as being an indication of alignment of cognitive representation of the problem at hand. We thus produced the following hypotheses: H1 When collaborators write, or read, utterances containing references to a shared map, they look at the points of the map they are talking about. H2 Participant pairs using a tool supporting Explicit Referencing produce communication episodes with more convergent gazes.
Deixis and Gaze at the Collaborative Level
H3 For a given utterance, gaze divergence on the shared map results in verbal repair acts.
Deixis is a fundamental component of communication in face-toface interactions. It has been demonstrated to have great effects on comprehension in collaborative tasks [Kraut et al. 2002]. Particularly, Kraut et al. [2003] showed how co-located collaborators use
H4 Pairs which account for higher gaze convergence should reach higher performance.
174
3
Methodology
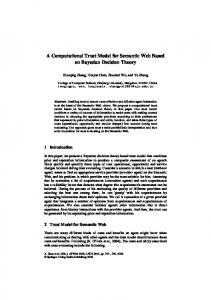
Participant pairs had to collaborate remotely using a chat tool and a map to organize a festival on their university campus. Completing the task required deciding which parking lots to use, where to position the three stages of the event and how to allocate six artists to the three available stages. They therefore had to perform a number of optimizations, such as minimizing the distance between the chosen parking areas to the initial stage and between stages, according to the schedule of the events. Additionally each parking lot had a different rental price that was somewhat proportional to its capacity. One of the constraints was to minimize the budget for the concert. Finally, as setting up a concert on a stage required appropriate “sound checks”, subjects had to choose the order of the concerts so as to minimize the waiting time of the spectators, and an appropriate distance among the stages so as to minimize the disturbance of sound checks on running concerts. To perform the task, the subjects had to position a series of icons on a campus map: a number of ‘P’ signs to mark the active parking lots, three stage icons and six small circled numbers, one for each event to be allocated (part (b) of figure 1). The positions of these icons were not synchronized across the participants’ displays: each subject could not see where the other would position his/her icons. The fact that the two displays were not synchronized forced the participants to coordinate explicitly about icon locations and enabled us to detect misunderstandings as they arose. This design was also chosen so to eliminate the effect of the feedthrough (the mechanism of determining a person’s interactions through the sights of artifacts) on the team’s performance [Gutwin and Greenberg 1998].
3.1
Participants
60 students from our university volunteered to participate in the experiment. They were selected based on their mother language, course year, faculty and finally on their knowledge and use of computers and, in particular, chat applications. They were all native French speakers. We did not recruit participants in the first or the second year of their program as this could have an effect on the level of their knowledge of the campus site and in turn on the task performance.
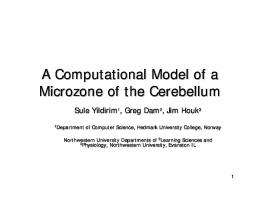
Figure 1: Experiment setup in the two conditions: (a) feedback tool; (b) icons used during the task; (c) MSN chat message window; (d) reminder of the task goals; (e) map window; (g) ConcertChat chat message window; (k) example of how a stage icon is positioned and two concerts are assigned to that stage; (v) score button and countdown timer; (z) in ConcertChat it is possible to connect the message window to the point of reference with an arrow.
The subjects did not know each other and were randomly matched from different faculties. Students from Architecture or Civil Engineering were excluded as they could have biased the results as they are more used to working with maps. They were recruited using an e-mail based call for participation and a short telephone interview, which helped to ascertain that they regularly used a chat application and that they did not had any ocular disabilities (e.g., colorblindness). Each participant was remunerated 30 Swiss Francs for the participation (approx. 18.30 EUR or 24.85 USD). Participants were randomly assigned to 30 dyads. Fifteen dyads were assigned to each of the two conditions described in 3.5 below.
3.2
3.3
Procedure
On arrival, participants were given an instruction sheet containing the rules they had to respect in placing the elements on the map, information on how to evaluate their solution, and the principles behind the calculation of the score. Next, they were asked to watch a short video summarizing the instructions and explaining the particular communication tool they had to use in order to collaborate. Prior to starting the task, the participants could ask the experimenter questions if they had any doubt about the instructions they were given or which they had understood from the video.
Apparatus
The participants of a pair were each seated in front of identical desktop computers with 17-inch LCD eye-tracker displays (maker: Tobii, model: 1750), and located in two different rooms. The settings of the rooms, the working table and the light conditions were identical. Participants sat unrestrained approximately 60 cm (approx. 24 inches) from the screen. The tracker captured the position of both eyes every 20 ms. The participants went through a 5-point calibration routine.
During the task, each participant had at his/her disposal: a feedback tool (part (a) of figure 1), a map of the campus (part (e) of figure 1) and a chat application to communicate with the partner. The feedback tool offered a score button (part (v) of figure 1), the pressing of which would force the display of a number between 0
175
and 100 assigned comparing the proposed solution with the optimal solution that was calculated once for all the experiments by the machine. This tool presented also four sub-scores one for each goal and the combined team-score. Each graph presented a horizontal red line, representing the maximum score that could be achieved and a vertical red line marking the time limit of the task. The tool also showed the remaining time to complete the task in the bottomleft corner (part (v) of figure 1).
Task Indipendent
A Message is analyzed
Spatial lexicon
Aggregate emitter gazes
The task lasted 45 minutes, while the briefing session lasted 15 minutes. As the task required multiple optimizations, we allowed each pair to submit multiple solutions to solve the task, ultimately selecting the best score for each team. Pairs were instructed to find the configuration leading to the highest score and to follow a collaborative paradigm, minimizing the position mistakes between the icons on the two machines. They were also advised to take advantage of the feedback tool and the available time to test the maximum number of different configurations.
3.4
Start/ Message
B Emitter fixation clustering
Task lexicon
C Match map model
Semantic Map
Measures
Aggregate receiver gazes
Task Dependent
We used the maximum score achieved during the 45 minutes as the measure of task performance. Most of the analyses presented in section 5 were performed at the utterance level, with the exception of the results in section 5.3, for which we averaged these episodic measures for each experiment. The variables that we studied were:
ET logs & chat logs
B Receiver fixation clustering
out: emitterreceiver gaze distance
1. The distance between the gaze on the shared workspace and the point(s) named in messages containing references to the map;
D Infer overlap
Stop
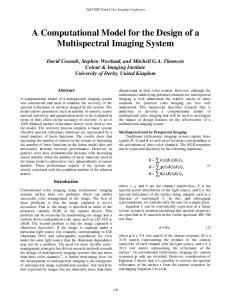
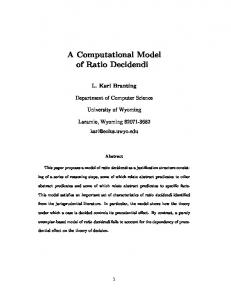
2. The distance between the gaze of the emitter of a message and the gaze of the recipient on the shared workspace; Figure 2: Algorithm proposed in this paper to detect misunderstandings
3. A post-hoc split dichotomous variable, showing the presence of repair acts in the 5 next messages following the message under exam containing a reference to the map;
3.5
Independent Variables
in the produced message. Then, it outputs a score describing how closely the recipient has looked at the same points while the message was red and until his/her next action. Figure 2 describes the modules of this algorithm. Each important block is marked with a letter and will be detailed below.
We varied the communication tool used by the participants during the experiment. In this way, we manipulated the availability of the Explicit Referencing mechanism. The design was therefore a standard 2 factorial design, where Explicit Reference (ER vs. noER) was a between-subjects factor.
3.6
(A) The linguistic model Each message was parsed to detect and extract references to the shared workspace through a series of steps. Two main class of elements were automatically extracted: the Referent(s) (the intended point(s) on the plan, e.g., “Parking 250”), and the Relatum(s) (the point used to identify the Referent, e.g., “The green space on the right of parking 250”), if any. When a relatum was present, we also extracted the Relation (the spatial correspondence between the Relatum and the Referent, e.g., “on the right of”). To accomplish this extraction process, we first removed typos using a collection of common typing errors in French. Then we looked for the Relation extracting prepositional phrases (e.g., “on the right hand-side of the parking lot”, “below the ‘H’-shaped building”, etc.), and deictic expressions (e.g., “I placed the second concert here”, or “move your icon there”). Matching was based on a task independent lexicon containing spatial referential expressions and it was adapted from Vandeloise [Vandeloise 1991]. A second lexicon (task dependent) contained references to movable objects (e.g., ‘the stage’, ‘the concert’). Finally, a third lexicon (also task dependent) contained references to fixed landmarks (e.g., “P200”, “chemistry building”). These last expressions enriched our ‘semantic map’ of the university, a lexicon aggregating linguistic expressions pointing to specific polygons of our model of the campus. They were used to extract the interest polygons used by the emitter (e.g., “I want to use
Technical Setup
c We used two different chat applications: MICROSOFT MSN is a standard chat application, while ConcertChat was developed at Fraunhofer-IPSI, in Germany [M¨uhlpfordt and Wessner 2005]. In ConcertChat, the user can visually join a message to a specific location on the shared workspace. Connections to map locations are made by arrows connecting the message from the history panel to the map point (part (z) of figure 1), or to other messages in the history pane. Lines are refreshed as utterances move up in the chat history (part (g) of figure 1).
4
Detecting Misunderstanding
At a distance, cues normally used by conversants to infer misreadings are not available. The aim of the algorithm presented in this work is to offer computational support to compensate for this lack by detecting misunderstandings between collaborators. It uses the movements of collaborators’ eyes on a shared plan and a linguistic model describing the content of their messages. It operates by associating the emitter’s fixations on points of the map to those named
176
parking 200” was associated to a polygon labeled P200). (B) Fixation clustering This step consisted in aggregating the gaze data in order to infer zones attracting users’ attention over a certain time period. The eye-trackers recorded the position of the eyes every 20 ms. A common way for aggregating such raw gaze data is to extract fixations which are defined by a very small position change between temporally continuous data. In our case, we needed a more general measure of the zone of interest over a rather long time (5-30 s.) compared to common fixation duration(