the controller with a dual-duct air-handling unit. INTRODUCTION. Heating, ventilating, and air-conditioning (HVAC) systems are typically controlled using ...
A CONTROLLER FOR HVAC SYSTEMS WITH FAULT DETECTION CAPABILITIES BASED ON SIMULATION MODELS T. I. Salsbury Lawrence Berkeley National Laboratory Berkeley, California 94709, USA proposed fault detection and diagnosis schemes based on the use of models. The main trade-off with model-based schemes is configuration effort versus model accuracy. Generally, the greater the potential accuracy of the models, the greater the effort required to configure the models for operation. The models in the proposed controller have therefore been selected to be configurable from performance information typically available during a system life cycle. Although model accuracy and fault sensitivity are sacrificed to a certain extent, the paper demonstrates that the proposed scheme is capable of detecting two important faults in the air-handling unit tested.
ABSTRACT This paper describes a control scheme with fault detection capabilities suitable for application to HVAC systems. The scheme uses static simulation models of the system under control to generate feedforward control action, which acts to supplement a conventional PI(D) feedback loop. The feedforward action reduces the effect of plant non-linearity on control performance and provides more consistent disturbance rejection as operating conditions change. In addition to generating feedforward control action, the models act as a reference of correct operation. Faults that occur in the HVAC system under control cause the PI(D) controller to provide a greater than normal control action to compensate for faultinduced inaccuracies in the feedforward models. The controller monitors the level of feedback compensation and generates alarms when thresholds are exceeded. The paper presents results from testing the controller with a dual-duct air-handling unit.
DESCRIPTION OF THE CONTROLLER Figure 1 shows the control and fault detection scheme. A conventional PI(D) feedback loop generates control action (uPI) based on the error between the setpoint and the controlled variable. This feedback control action is then supplemented by a control signal (uFF) generated by a simulation model, which is an inverse representation of the system. The model is in static form and produces a control action appropriate for the current setpoint and measured disturbances. The control scheme is similar to that proposed by Hepworth and Dexter (1994), which used an adaptive neural network as the inverse system model.
INTRODUCTION Heating, ventilating, and air-conditioning (HVAC) systems are typically controlled using proportional plus integral (and sometimes plus derivative) PI(D) control law. In practice, HVAC systems exhibit nonlinear operating characteristics, which causes control performance to vary when operating conditions change. Poor control performance can lead to occupant discomfort in a building, greater energy consumption, and increased wear on controlled elements, such as actuators, valves, and dampers.
disturbances Inverse System Model
u FF
setpoint
In a conventional PI(D) feedback loop, the controller does not contain much information about the process it is controlling. Faults that lead to performance deterioration or a change in system behavior are often masked within a feedback loop. The control scheme described in this paper uses a model of the correctly operating system to supplement a conventional PI(D) feedback loop. The model is used as part of a feedforward control regime in order to reduce the effects of plant non-linearity on control performance. In addition, the model acts as a reference of correct behavior, which facilitates the detection of faults that develop in the controlled system.
+
error -
PI Controller
u PI
+
Threshold
+
u PI+FF
System
controlled variable
fault detection
Figure 1: The control and fault detection scheme The inverse model acting in isolation of the feedback loop would produce responses equivalent to the open loop dynamics of the system. The feedback loop serves to speed the response time of the controller and eliminate offsets resulting from model inaccuracies and unmeasured disturbances. If the application allows the assumption to be made that the effect of unmeasured disturbances is small, the (steady-state) feedback control action (uPI) serves as an indication of the model/system mismatch. By
Several researchers (e.g. Gertler, 1998; Glass et al., 1994; Isermann, 1995; Patton et al., 1995) have
1
The latter simplification is made because characterization of this non-linearity requires parameters that are not easily obtainable or reliable, such as those related to valve and damper inherent characteristics and authorities. Although linear behavior is rarely achieved in practice, the simplification is reasonable, as this is one of the goals of the design and commissioning processes. Although the model simplifications reduce potential accuracy and performance of the scheme, a major advantage is that the model parameter values may be obtained from typical available information, rather than requiring training data and additional tuning effort.
configuring the model to represent a correctly operating system, the level of uPI acts as an indication of fault development. Faults occurring in the system, which change its behavior or performance, thus create a mismatch between the model and system leading to an increase in feedback control action. The control scheme incorporates a procedure for monitoring the feedback action so that an alarm is generated if uPI exceeds a threshold for a sustained period.
APPLICATION SYSTEM The control scheme is evaluated using a simulation of an air-handling unit developed in the MATLAB environment using component models adapted from HVACSIM+ (Clark, 1985). The unit is modeled on a real system, which is installed in a large federal building in downtown San Francisco, USA. Figure 2 depicts the air-handling unit, which is a dual-duct type having three thermal subsystems: mixing box, cooling coil, and heating coil. The air-handling unit has the capacity to deliver 74kg/s of air and provide 850kW of heating and 1260kW of cooling.
Table 1: Configuration parameters PARAMETER/DESIGN SPECIFICATIONS HEATING/COOLING COIL Heat transfer rate Cold fluid inlet air temperature Cold fluid mass flow rate Hot fluid inlet temperature Hot fluid mass flow rate MIXING BOX Minimum fractional outside air flow
Each thermal subsystem has its own controller. The mixing box controller modulates three sets of dampers in sequence to maintain a mixed air setpoint. There is a minimum outside-air requirement based on damper position (20% minimum outside-air by position) and a temperature economizer. The hot duct houses a steam-to-air heating coil regulated by a two-port valve, and there is a water-to-air cooling coil having a three-port valve in the cold duct. In the real system, the fan speed is varied according to load changes in the zones in a conventional VAV arrangement whereby a constant duct static pressure is maintained. In the simulated system, artificial step changes in airflow rate were applied in order to maintain excitation but avoid the need for modeling the zones and VAV boxes.
UNITS kW ºC kgs-1 ºC kgs-1 %
Table 1 lists the parameters required by the controller and Table 2 lists the required sensor measurements/variables. Note that in the dual-duct air handling unit, air temperatures and flow rates are required before the coils in both the hot and cold ducts. Table 2: Required sensor signals/variables SENSOR SIGNAL Return air temperature Outside air temperature Air flow rates Pre-coil air temperatures Setpoints
SIMULATION MODELS USED IN THE FEEDFORWARD CONTROLLER
UNITS ºC ºC kgs-1 ºC kgs-1
TEST RESULTS
The models used in the feedforward controller are simplified versions of the models in the simulation. Three separate models are employed; one in each of the three separate control-loops in the air-handler: mixing box, heating coil, and cooling coil. Details of the model equations can be found in (Salsbury, 1998). The models used in the feedforward controller differ from the models used in the simulation in several respects. In particular, the controller models do not treat: x variations in coil thermal conductance with fluid flow rates; x dehumidification in the cooling process; x non-linearity for variations in control signal when all other operating conditions are fixed.
The control scheme is evaluated in two respects: x setpoint tracking performance; x ability to detect faults in the three thermal subsystems. Twelve hours of test data, sampled at 5-second intervals are used to evaluate the control scheme. The test data contain real measurements of ambient and return air temperatures from the real building. Airflow rate is artificially varied in a sequence of arbitrary steps and ramps. The setpoints for each of the three subsystems are also varied artificially in order to facilitate a rigorous assessment of the controllers.
2
No Fault Condition The control scheme is tested firstly using the system in its correctly operating condition. Figure 5 shows the indices associated with the fault detection. The top graph shows the control signals generated by the three feedback loops in the air-handler. If the models used in the controller were perfect representations of the system under control, these control signals would asymptotically approach zero following each disturbance.
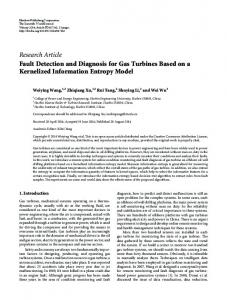
Control Performance This section compares the performance of the feedforward controller with the performance of a PI controller acting in isolation. Each of the PI control loops was tuned using the Zeigler-Nichols open loop test procedure making use of the highest gains exhibited in the range of conditions in the test data. Figure 3 shows the performance of the PI controller when subjected to the test data. The upper graph shows the three controlled variables and setpoints. The middle graph shows the ambient and return air temperatures and the air flow rate (right axis scale), and the lower graph shows the control signals to each of the subsystems. For these conditions, the PI controller provides satisfactory performance for the test data. Control performance is characterized by the sum of the mean absolute errors (MAE), listed in Table 3.
Figure 5 shows that there are modeling errors in each of the models. The errors vary during the data due to transient effects and because the models approximate the system better in certain parts of the operating range than in others. The cooling coil exhibits the greatest level of inaccuracy during the test data; this most likely being due to the extra simplifications in this model, such as non-treatment of dehumidification. The heating coil model appears to represent the system well, with the feedback contribution being the lowest of the three subsystems. Correlating Figure 5 with Figure 4, shows that the greatest errors in the mixing box model are in the mid-range of operation, this being due to the simplification of linearity between the two extreme load points.
Figure 4 shows the performance of the same PI controllers, but this time with the inclusion of supplemental feedforward action. The graphs show minor improvements in the responses to the disturbances. This is particularly evident for the heating coil control-loop, which shows tighter control toward the end of the test data. Table 3 lists the mean absolute errors in each control loop over the period of the data. There is little change in the performance of the mixing controlloop, which shows only a 4% improvement. This is due to the ambient air temperature not varying significantly during the test data leading to a reasonably invariant gain in this subsystem. In practice, variations in ambient air temperature directly affect the mixing box gain and lead to instability in this loop. Previous work has shown that the feedforward controller can significantly improve the mixing box control-loop in the face of highly variable environmental conditions (Salsbury, 1998). The cooling coil control performance improves by 18%, while the heating coil shows the greatest improvement of 52%.
The bottom three graphs in Figure 5 show the fault detection output for each loop. A fault is deemed to have occurred if the feedback control signal rises above the threshold and stays above the threshold for a sustained period (30 minutes). The selection of a threshold is fundamental to the performance of the fault detection scheme. The threshold was selected here based only on the maximum feedback control actions exhibited for the correctly operating data. In practice, the most reliable way in which to establish thresholds would be to perform closed loop tests on the subsystems during the commissioning process. These tests could be set up so that selected setpoints exercise the systems at strategic points in their operating ranges. Alternatively, thresholds could be identified during an on-line learning phase, whereby maximum feedback action is monitored over an assigned period. Another possibility would be to determine default threshold values for particular classes of HVAC systems based on statistically significant tests on similar equipment.
Table 3: Comparative performance of controllers PROCESS PI control in isolation PI + feedforward control Improvement (%)
COOL 0.22 0.18 18
MAE (K) MIX HEAT 0.45 0.25 0.43 0.12 4 52
Valve Leakage Leakage through the control valve of a heat exchanger is a common fault in HVAC systems, which often persists unnoticed due to feedback masking and compensatory actions of other systems. This fault can lead to wastage of energy, not only in the subsystem where the fault occurs, but also in the other systems forced to provide compensatory action.
FAULT DETECTION PERFORMANCE The ability of the control scheme to detect faults is evaluated using the same test data used in the control performance evaluation.
3
In this test, the cooling coil valve model in the simulation is amended so that it leaks by 20% of maximum flow when the valve is supposed to be closed.
CONCLUSIONS This paper has demonstrated the potential for using simplified simulation models as part of an HVAC control scheme. The tests results presented in the paper showed that the scheme was able to improve control performance and detect two different types of faults in the considered air-handling unit.
Figure 6 shows the behavior of the control scheme for the leakage fault. The 20% leakage causes the cooling coil to provide too much cooling during most of the test data, which makes the feedback control saturate the control signal at zero. The setpoint is only attained when a high cooling demand is needed during the middle of the data.
The performance of the control scheme and its ability to detect faults in the controlled process depends on the accuracy of the models. Realizable accuracy is limited by errors in the structural formulation of the model, selection of correct parameter values, and by the reliability of the sensor signals used by the models. More research is needed to ascertain the optimum model complexity for particular fault detection applications.
Figure 7 shows the fault detection indicators for the leakage fault case. The top graph shows that the feedback loop control action exceeds the threshold for a large portion of the day. Correspondingly, the mixing process graph (second from bottom in the figure) indicates a fault for much of the data. The feedback error is largest when the cooling coil control signal is zero due to this being the part of the operating range where the fault is most evident. When the coil operates at a higher load, the feedback compensation drops below the threshold. The scheme therefore only detects faults when the considered subsystem is operating at a point where the effects of the fault are evident.
Thresholds need to be related to model accuracy, which, under ideal conditions, should be established through rigorous testing on the application system. There is a trade-off between the time invested in establishing thresholds, and the reliability of the scheme. In the paper, a threshold was established heuristically based on one set of correct operation data. In practice, data of this sort may be to costly to obtain. Other means of ascertaining thresholds, such as on-line learning, or the use of default values may be more practical alternatives.
Stuck Return Air Damper A stuck damper in the mixing box is another common fault in HVAC systems. This fault can be due to various causes, such as a failed actuator, damper obstruction, de-coupled linkage, etc. The fault is difficult to detect in practice as it does not cause failure of the mixing process but instead alters its characteristics and restricts the operating range. Figure 8 shows the performance of the controller when the re-circulation damper is stuck at 50% open. The fault is masked for the majority of the test data with the fault condition only affecting control performance in the middle of the day when the controller demands 100% outside air.
ACKNOWLEDGEMENTS This work was supported by the Assistant Secretary for Energy Efficiency and Renewable Energy, Office of Building Technology and Community Systems, and the Federal Energy Management Program, of the US Department of Energy under Contract No. DEAC03-76SF00098.
REFERENCES Clark, R. C. 1985. “HVACSIM+ Building Systems and Equipment Simulation Program Reference Manual”. Published by the U.S. Department of Commerce, Gaithersburg, MD 20899.
Figure 9 shows the fault indicator variables for the stuck damper condition. The feedback control action to the mixing box increases during the periods when the dampers are supposed to be providing 100% outside air. Unwanted re-circulation through the mixing box reduces its operating range so that setpoints close to the ambient air temperature become unattainable. The fault is less apparent in the parts of the range where setpoints are closer to the return air temperatures. The fault proves difficult to detect and the threshold is only exceeded for a short time around nine hours into the test data. However, the period over which the feedback action remains above the threshold is sufficient to trigger an alarm for the mixing box. Note that 30 minutes is set as the time limit for a threshold transgression in order to trigger an alarm.
Gertler, J. 1988. “Survey of Model-Based Failure Detection and Isolation in Complex Plants”. IEEE Control Systems Magazine. Number 6. Volume 8. Page 3. Glass, A. S., P. Gruber, M. Roos, and J. Tödtli. 1994. “Preliminary Evaluation of a Qualitative ModelBased Fault Detector for a Central Air-Handling Unit”. Proceedings of 3rd IEEE Conference on Control Applications, Glasgow. Hepworth, S. J., A . L. Dexter. 1994. “Neural Network Control of a Non-Linear Heater Battery”. Building Services Engineering Research and Technology. Volume 15. Number 3. Page119.
4
Salsbury, T. I. 1998. “A Temperature Controller for VAV Air-Handling Units Based on Simplified Physical Models”. ASHRAE HVAC&R Research Journal. Volume 4. Number 3.
Isermann, R. 1995. “Model-Based Fault Detection and Diagnosis Methods”. Proceedings of the American Control Conference, Seattle, Washington, USA. Page 1605. Patton, R. J. J. Chen, S. B. Nielsen. 1995. “ModelBased Methods for Fault Diagnosis: Some Guidelines”. Transactions of the Institute of Measurement and Control. Volume 17. Number 2. Page 73.
T
Return Air
H
Exhaust Air
setpoint
setpoint
Economizer Controller
Fan Controller -
T Outside Air
T
H
setpoint
H
+
setpoint
H
P
T
Supply Air (to TerminalUnits)
Cold-Duct Controller
H
P
T
Hot-Duct Controller
Temperatures (degC)
Figure 2: Schematic of the dual-duct air-handling unit. MAE: cool=0.22 mix=0.45 heat=0.25 40 30
HEAT
20
MIX
10
COOL
50
AFLOW
20
TRET TAMB
10
0 U (-)
1
HEAT
0.5
MIX
COOL
0 0
2
4
6 Time (Hours)
8
10
Figure 3: Performance of the feedback PI controller acting in isolation
5
12
(kgs-1)
(degC)
0
Temperatures (degC)
MAE: cool=0.18 mix=0.43 heat=0.12 40 30
HEAT MIX
20 10
COOL
50
AFLOW
20
TRET
(kgs-1)
(degC)
0
TAMB
10
0
U (-)
1
HEAT
0.5
MIX
COOL
0 0
2
4
6 Time (Hours)
8
10
12
Figure 4: Performance of the PI controller supplemented with feedforward control action
Figure 5: Diagnostic indicator variables – no fault condition
6
Temperatures (degC)
MAE: cool=3.21 mix=0.43 heat=0.12 40 30
HEAT MIX
20 COOL
10
50
AFLOW
20
TRET
(kgs-1)
(degC)
0
TAMB
10
0
U (-)
1
HEAT
MIX
0.5 COOL
0 0
2
4
6 Time (Hours)
8
10
Figure 6: Control behavior when the cooling coil control valve is leaking by 20%
Figure 7: Fault indicator variables – leaking cooling valve fault
7
12
Temperatures (degC)
MAE: cool=0.18 mix=0.99 heat=0.12 40 30
HEAT MIX
20 10
COOL
50
AFLOW
20
(kgs-1)
(degC)
0
TRET TAMB
10
0
U (-)
1
MIX
HEAT
0.5
COOL
0 0
2
4
6 Time (Hours)
8
10
Figure 8: Control behavior when the return air damper is stuck at 50%
Figure 9: Fault indicator variables - return air damper stuck at 50%
8
12