A Cultural Sensitive Agent for Human-Computer Negotiation Galit Haim
Ya’akov (Kobi) Gal
Bar Ilan University, Israel
Ben-Gurion University of the Negev, Israel
[email protected]
[email protected] Michele Gelfand
∗
Sarit Kraus
Bar Ilan University, Israel
[email protected]
University of Maryland, USA
[email protected] ABSTRACT People’s cultural background has been shown to affect the way they reach agreements in negotiation and how they fulfill these agreements. This paper presents a novel agent design for negotiating with people from different cultures. Our setting involved an alternating-offer protocol that allowed parties to choose the extent to which they kept each of their agreements during the negotiation. A challenge to designing agents for such setting is to predict how people reciprocate their actions over time despite the scarcity of prior data of their behavior across different cultures. Our methodology addresses this challenge by combining a decision theoretic model with classical machine learning techniques to predict how people respond to offers, and the extent to which they fulfill agreements. The agent was evaluated empirically by playing with 157 people in three countries—Lebanon, the U.S., and Israel—in which people are known to vary widely in their negotiation behavior. The agent was able to outperform people in all countries under conditions that varied how parties depended on each other at the onset of the negotiation. This is the first work to show that a computer agent can learn to outperform people when negotiating in three countries representing different cultures.
Categories and Subject Descriptors I.2.11 [Distributed Artificial Intelligence]
General Terms Experimentation
Keywords Human-robot/agent interaction, Negotiation
1.
INTRODUCTION
The dissemination of technology across geographical and ethnic borders is opening up opportunities for computer ∗also affiliated with the University of Maryland Institute for Advanced Computer Studies. Appears in: Proceedings of the 11th International Conference on Autonomous Agents and Multiagent Systems (AAMAS 2012), Conitzer, Winikoff, Padgham, and van der Hoek (eds.), June, 4–8, 2012, Valencia, Spain. c 2012, International Foundation for Autonomous Agents and Copyright Multiagent Systems (www.ifaamas.org). All rights reserved.
agents to negotiate with people of diverse cultures and backgrounds. For example, electronic commerce (e.g., ebay), crowd-sourcing (e.g., Amazon Turk) and deal-of-the-day applications (e.g., Groupon) already involve computer agents that make decisions together with people from different countries. People’s cultural background has been shown to be a key determinant of the way they make and keep their agreements with others [7]. It is thus important for agent designers to model how people from various cultures respond to different kinds of decision-making behavior employed by others. To succeed in such settings computer agents need to adapt to the culture and particular behavior of the individual they interact with. This paper presents a novel agent-design for settings in which participants repeatedly negotiate over the exchange of scarce resources, and agreements are not binding. Such settings characterize the real-world applications shown above, in that participants make commitments to purchasing items or carrying out tasks, they can choose whether and how to fulfill these commitments, and these decisions affect their future interactions with the other participants. For example, a seller that delivers an item very late to a buyer, or does not deliver an item at all, may be negatively reciprocated by the buyer in a future transaction. Prior work has addressed some of the computational challenges arising in repeated negotiation between people and computer agents [6, 11]. However, additional challenges arise when designing agents that adapt to different cultures. First, agents need to adopt a separate strategy in each culture, requiring large amounts of data to be collected of people’s play in the different cultures. Second, people’s individual behavior within a culture displays wide variance, as people’s strategies are inconsistent and prone to noise [7]. Thus, a computer agent needs to adapt quickly to the individual strategy of its negotiation partner over time. To address the first challenge, we combined a decision-theoretic model with classical machine learning techniques to model human behavior in different cultures. The decision-theoretic model used an influence diagram to efficiently represent and reason about the negotiation process. The learning techniques were based on features that represent players’ states in the negotiation, as well as social factors that reflect their generosity and reliability over time. To address the second challenge, we collected data in three different countries in which people are known to exhibit distinct cultural differences in their
negotiation behavior (Israel, Lebanon and the U.S). In order to boost the amount of data available for learning, we trained the model of people’s play with baseline computer agents as well as other people. Our proposed agent incorporated the learned models of people’s play and solved the influence diagram to make decisions in the game. We evaluated this agent when negotiating with new people in each of the three countries. Our results show that the agent was able to outperform people in all three countries, and in conditions varying how participants depended on each other’s resources during negotiation. The agent learned to adapt to the behavior of its negotiation partner over time in each of the cultures, and used a general model of their behavior when little or no history of play was available. These results demonstrate the need for agentdesigners to model the effects of culture on human behavior when agents are deployed globally or in multi-cultural settings. It is the first work to show that a computer agent can learn to outperform people when negotiating in three different cultures. There is a body of work in the psychological and social sciences that investigates cross-cultural behavior among human negotiators [2]. However, there are scant computational models of human negotiation behavior that reason about cultural differences. Past work in AI has used machine learning and opponent modeling approaches toward building computer agents that negotiate with people. [13].Jonker et al. [10] designed an agent architecture that used concession strategies to avoid impasses in the negotiation. Byde et al. [1] constructed agents that bargain with people in a market setting by modeling the likelihood of acceptance of a deal and allowing agents to renege on their offers. Oshrat et al. [12] have used learning techniques to model the extent to which people exhibit different social preferences when they accept offers in one-shot and multiple interaction scenarios. To date, all work on human-computer negotiation assumes that agreements are binding and have relied on prior data of people’s negotiation behavior. A notable exception is the work by Gal et al. [5] that proposed an agent for negotiating with people in the U.S. and Lebanon using the same protocol and setting as this work. However, this agent used handdesigned rules of behavior and did not model its partner in a formal way. This agent was able to outperform people in the U.S. but not in Lebanon, whereas our learned agent was able to outperform people in the U.S., Lebanon and Israel. Thus, our work is novel in showing that combining decision theory and machine learning is a better approach towards building agents in the same settings they considered.
2.
IMPLEMENTATION: COLORED TRAILS
Our empirical setting consisted of a game that interleaved negotiation to reach agreements and decisions of whether and how much to fulfil the agreement. The game was configured using the Colored Trails (CT) game [4] and played on a 7x5 board of colored squares. One square on the board was designated as the goal square. Each player’s icon was initially located in one of the non-goal positions, eight steps away from the goal square. To move to an adjacent square, a player needed to surrender a chip in the color of that square. At the onset of the game, one of the players was given the role of proposer, while the other was given the role of responder. The interaction proceeded in a recurring sequence of phases, using an alternating offers protocol. In the “nego-
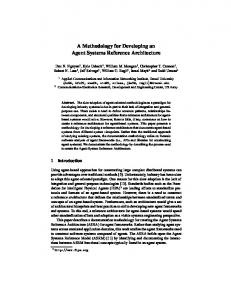
Figure 1: An example of a CT Board
tiation phase”, the player designated as the proposer could make an offer to the other player, who was designated the responder. In turn, the responder could accept or reject the offer. If the offer was rejected, then players switched roles: the responder became the proposer and the proposer became the responder. After the counter offer was accepted or rejected by the responder, the game moved to the next phase. In the “transfer phase” both players could choose chips to transfer to each other. The transfer action was done simultaneously, such that neither player could see what the other player transferred until the end of the phase. A player could choose to transfer more chips than it agreed to, or any subset of the chips it agreed to, including transferring no chips at all. In the “movement phase” both players could move their icons on the board one step towards the goal square, provided they had the necessary chip. Players alternated their roles, such that the first proposer in the previous negotiation phase was designated as a responder in the next negotiation phase, and vice versa. These phases repeated until the game ended, which occurred when one of the following conditions held: (1) at least one of the participants reached the goal square; or (2) at least one of the participants remained dormant and did not move for three movement phases. When the game ended, both participants were automatically moved as close as possible to the goal square, and their score was computed as follows: 100 bonus points for getting to the goal square, 5 bonus points for any chip left in a player’s possession; a 10 point penalty for each square left in the path from a player’s final possession to the goal square. These parameters were chosen so that getting to the goal was by far the most important component, but if a player could not get to the goal it was preferable to get as close to the goal as possible. Note that players had full view of the board and each others’ chips, and thus they had complete knowledge of the game situation at all times during the negotiation process. An advantage of using CT is that it provides a realistic analog to task settings, highlighting the interaction among goals, tasks required to achieve these goals and resources needed for completing tasks. In CT, chips correspond to agent capabilities and skills required to fulfill tasks. Different squares on the board represent different types of tasks. A player’s possession of a chip of a certain color corresponds to having the skill available for use at that time.
We used two different types of boards in the study to represent different dependency relationships between players. In one of the boards, neither player could reach the goal given its initial chip allocation, and there existed at least one exchange such that both players could reach the goal. We referred to players in this game as task co-dependent. In the other board type, one of the players, referred to task independent, possessed the chips it needed to reach the goal, while the other player, referred to as task dependent, required chips from the task-independent player to get to the goal. An example of the co-dependent board used in our study is shown in Figure 1. In this game both the “me” icon and “square” icon players were missing three chips to get to the goal: The “me” player was missing three yellow chips whereas the “square” player was missing three gray chips. The relevant path from the point of view of the “me” player is outlined.
3.
A DYNAMIC MODEL OF INTERACTION
In this section we describe an agent-design termed the Personality Adaptive Learning (PAL) agent. Before describing the decision theoretic model used by PAL, we make the following definitions. Let n denote an arbitrary negotiation phase in the game. For any two participants i and j, let cn i denote the set of chips in possession of i at phase n in the n game. Let on = (on i , oj ) denote a proposal at round n in n is the set of chips that i sends to j, and on ⊆ c which on j is i i the set of chips that j sends to i. Note that the proposal on can be made by either player i or player j. Let an denote the other player’s response to on whether to reject or accept n the proposal. Let tn i ⊆ ci be the set of chips transferred by n i following the response, and let tn j ⊆ cj be the set of chips transferred by j. The protocol allows participants to transfer chips regardless of whether or not an offer is accepted. The current score for i at round n measures the score in 1 n the game given its chips cn i . This is defined as ui (ci ). Given a proposal on at round n, the promised score to player i at round n measures the score in the game that i would receive in the case that j was fully reliable and sent on j promised chips to player i. The reliability measure of player j at round n, denoted rjn , reflects the extent to which j fulfilled its commitment to send on j chips to i. It is defined as the ratio between the current score to i after j transferred chips and the promised score to i. A reliability measure of 1 means that player j transferred all of its promised chips to i; the extent to which the reliability measure is lower than 1 represents the degree to which the player did not fulfill its commitment for a given agreement, as defined below. rjn =
n ui (cn i ∪ ti ) n ui (ci ∪ on j)
(1)
Note that the reliability measure of j only depends on the chips it sent to i, and does not depend on the chips sent by i to j. The reliability of player i is defined symmetrically, and omitted for brevity. PAL uses an influence diagram [9] to efficiently represent and reason about its decisions over time. An influence diagram is a directed acyclic graph containing three kinds of nodes: chance nodes denoted by ellipses, decision nodes de1
The score in the game also depends on players’ positions on the board and the board layout, which we omit for expository convenience.
sn
sn+1
on+1 P
onP
tnP
tn+1 H
G
fP (sn+2 , G)
an+1 H
anH
tnH
sn+2
tn+1 P
Figure 2: An Influence Diagram for two rounds of interaction in the CT game.
noted by gray rectangles, and utility nodes denoted by diamonds. Each chance node has an associated conditional probability distribution (CPD). A utility node has an associated deterministic function from values of its parents to the real numbers. The parents of a decision node represent information that is known to the decision maker at the time of making the decision, and are called informational parents. Each decision and utility node is associated with a particular agent. An influence diagram representing two rounds of interaction in the game is shown in Figure 2. Each decision node is labeled with the corresponding decision for PAL in the game and appears in gray background. The decision n nodes on P and tP represent the proposal made by PAL and the chips it decides to transfer at round n. Similarly, the n+1 decision node oP and tn+1 represent the proposal made P by PAL and the chips that it decides to transfer at round n + 1. The person’s decisions in the influence diagrams are modn+1 represent the eled as chance nodes. The nodes an H and aH person’s response to the proposal made by PAL in rounds n+1 represents the person’s n and n + 1. The node tn H and tH decision to transfer chips at round n + 1. The node sn represents the state of the game at round n. This node is a parent of all decisions made by both participants in round n. This represents the fact that the state is observed by the participants in the game when making their decisions in each round. The state encapsulates the history of the game into a tuple that contains relevant information about the game, as well players’ reliability measures in the game. The domain relevant information includes players’ positions on the board, their chips, and the number of dormants rounds already played in the game. The reliability measure for each player is rn , as computed in Equation 1. The decisions at each round n depend only the state sn and not on the history of past play. This violates the traditional “no-forgetting” rule that requires each decision to depend on all of the previous decisions, but is an acceptable assumption in repeated negotiation settings [6]. After players make their decisions in round n, the state sn+1 is updated for both players at each round to reflect the evolution of the game. This is represented by the edges from the decisions of both participants in the game at state sn to node sn+1 , shown in dashed outline. In this process, the domain dependent information is updated to reflect players’ positions and chips in round n. Also the reliability of the
person in round n is aggregated using a weighted average: n n−1 n rH = (1 − α) · rH + α · rH
(2)
where α is a decaying constant that weighs the past reliability, and is tuned empirically, as we explain in the next section. The state information sn+2 is updated to reflect the decisions of participants in round sn+1 in a similar way. In this section we will assume the existence of the probn n n ability distribution P (tn H | o , a , s ) modeling how people transfer chips following proposal on and response an at state sn , and the probability distribution P (an | on , sn ) modeling how people respond to a proposal on in game at round n (we also assume the existence of the corresponding probability distributions for modeling people’s play in round n + 1). We detail how we learn these models in the next Section. A key challenge to designing strategies for PAL in the game is how to assign credit to intermediate states in the game. Due to the scarcity of human data, the prediction accuracy of people’s behavior decreases for later stages of the game, and constructing an influence diagram that spans the entire game is not feasible. Thus, PAL uses a heuristic value function to assign utilities to intermediate states. The value function is an estimate of the score that PAL will receive at the end of the game. This estimate is based on whether PAL gets to the goal, its score as computed by the CT scoring function described in Section 2, and game-relevant information such as the dependency relationship between players at the current state. Specifically, let sm denote an intermediate state in the game. The node G equals true if PAL will reach the goal in the future, given that its current state is sm . The value function is denoted fP (sm , G) and equals PAL’s score in the game given that its chip set is modified by a constant factor as follows: If PAL can get to the goal independently of the other participant, this constant is large. If PAL is dependent on the other player to get to the goal, this constant is smaller, and depends on the extent to which PAL is dependent on the other. Solving the influence diagram shown in Figure 2, sn+2 is chosen to be the final state and the utility node fP (sn+2 , G) represents the value function at that state. Lastly, as can be seen in the influence diagram, the PAL agent is assumed to be the proposer in both rounds n and n + 1. This significantly facilitated inference in the decision tree, because we did not need to learn a model of people’s proposals. Given that there were 24 chips given to each player (see Figure 1 for an example of a board game), considering every possible proposal is infeasible. This protocol is correct for half of the game instances we collected in our setting (when PAL makes a counter proposal and is chosen to make the proposal in the next round). As we show in the Empirical section, this assumption did not impede the agent’s performance. Solving the influence diagram provides a strategy for PAL for any of its decisions given that final state is sm . To this end, the influence diagram is converted to a decision tree and solved using backward induction. The results of this process are as follows. In the final state sm , PAL’s utility is computed using the value function fP (G, sm ) given the probability distribution P (G | sm ) (whether PAL reaches the goal) ESP (. | sm ) = P (G | sm )·fP (G, sm )+P (G | sm )·fP (G, sm ) (3)
For any state n < m, we list the equations that correspond to solving the influence diagram for each of PAL’s decisions. Suppose that PAL’s decision is how many chips to transfer at round n after proposal on and response an . The expected score to PAL from transferring tn P chips is n n n denoted ESP (tn P | o , a , s ) and depends on its model n n P (tn H | o , s ) of people’s reliability. X n n n n n ESP (tn P (tn P | o ,a ,s ) = H | oP , s )· tn ⊆on H
| sn+1 ) max ESP (o∗,n+1 P
(4)
∗,n+1
oP
where sn+1 is the updated state that realizes players’ chips given that PAL transferred tn P chips and the human trans∗,n+1 ferred tn | sn+1 ) is the score to PAL H chips, and ESP (oP from the best proposal to make in the next state sn+1 . Suppose that PAL’s decision is what proposal to make at round n. The expected score to PAL from making a n n proposal on depends on its model P (an H | o , s ) of how people respond to proposals. The expected utility to PAL n from proposal on is denoted ESP (on P | s ) and computed as X n n n ESP (on P (an P | s ) = H | oP , s )· an ∈yes,no H n n | on max ESP (t∗,n P , aH , s ) P
(5)
∗,n tP ⊆cn P
n where an H is the response of the person in round n, cP is ∗,n the set of chips in PAL’s possession, and tP is the set of chips that PAL transfers that maximize its expected utility n n ESP (t∗,n | on P , aH , s ) defined in Equation 4. P Lastly, suppose that PAL’s decision is whether to accept a proposal on H from the person at round n. The expected score to PAL of its response an P to the proposal is denoted n n ESP (an P | oP , s ) and is computed as n ∗,n n ESP (an | on , a∗,n P | s ) = maxt∗,n ⊆cn ESP (tP P ,s ) P
P
(6)
t∗,n P
where is the set of chips that PAL transfers that maxn n imize its expected utility ESP (t∗,n | on P , aP , s ) defined in P Equation 4.
4.
LEARNING PEOPLE’S BEHAVIOR
In this section we describe how we constructed probabilistic models of people’s behavior from data collected in the game. We defined a set of features representing aspects of the game as well as players’ reliability measures. We trained classifiers for predicting people’s behavior using the subset of features that performed well on a held-out set of data instances, and maximized the likelihood of the training set. These classifiers were incorporated into the influence diagram described in the last section and used by PAL to adapt to people’s negotiation behavior in each country. Past work on human-computer negotiation trained predictive models of human behavior based on their play with other people [12, 6]. There were several challenges to using this methodology in our work. First, it is logistically difficult to collect data in three countries representing different cultures under identical laboratory conditions. In particular, access to subjects in Lebanon was extremely limited. Second, the repeated nature of the game and the relatively complex rules required a session of 70-80 minutes to collect a single game instance. (We expand on the instructions given
to subjects in Section 5.) The combination of these two factors made it difficult to obtain sufficient data instances to train classifiers from each country. Third, collectivist societies such as Lebanon are more homogeneous and display less variance in the extent to which they fulfill commitments [8]. This made it difficult to predict how this population would respond to a computer player whose strategies differed from the general population. To meet these challenges we used three sources of data to train our classifiers. First, we used the 222 game instances consisting of people playing the hand-designed agent used by Gal et al. [5]. In addition, in the U.S. and in Israel, we were also able to collect 112 game instances of people playing other people. Lastly, in Lebanon, we collected 64 additional games in which people played a variant of the agent used by Gal et al. that was programmed to be significantly less reliable when fulfilling its agreement. In this way, we were able to collect data of people’s reactions to more diverse negotiation behavior in the game. We defined a general set of salient features that describe people’s behavior and various aspects of the game. The features are described below from the point of view of a general player i at round n in state sn . We first describe features based on the terms defined in Section 3. The current score to i at state sn ; the Previous Reliability of i at round n − 1, as measured by the reliability measure of Equation 1; the Aggregate Reliability at round n, as measured by the weighted average reliability of Equation 2. We further define the following additional features: the Offer Generosity of player i, which measured the difference between the number of chips offered by i and requested by i in a proposal; the Role of player i, (whether proposer or responder); the number of Dormant Rounds in which i did not move in the game. (Similar features were defined from the point of view of the other player j.) We constructed the following probabilistic models of a general player i using the data described above. The proban n n bility P (an i | o , s ) that i accepts a proposal oj made by the n n n n other player j at state s ; the probability P (tn i | o ,a ,s ) n that player i transfers chips tn after proposal o and rei sponse an at state sn . (Note that the proposal on can be made by either player i or j); the probability P (G | sn ) that i will get to the goal when it is in state sn . We trained multi-layered neural network classifiers to implement the various models described above using the WEKA framework.2 We selected the features for each learning task based on their performance (measured by mean-square classification error) on a held-out set of instances as well as measuring the likelihood of the models on the training set. The best performance for predicting people’s reliability and proposal acceptance measures was obtained in Israel and in Lebanon. To explain this, we observe that the reliability of people in the data collected in Lebanon (0.67) was significantly higher than the reliability of people in the U.S. (0.289) and in Israel (0.46). This aligns with past studies showing that people care more about honor in the Middle East and are thus more reliable than in the U.S. [8].
5. 2
EMPIRICAL METHODOLOGY
http://www.cs.waikato.ac.nz/ml/weka/. The continuous measure of people’s reliability was discretized to facilitate learning.
This Section describes the evaluation of PAL’s performance when playing against new people in the game. To make decisions, PAL used the influence diagram described in Section 3, together with the machine learning models and the training data described in Section 4. To evaluate PAL we recruited 157 subjects from the three countries. These included 48 students studying in the Beirut area, 46 students from greater Boston area, and 63 students from universities in Israel. Each participant played a single game with the PAL agent, making a total of 157 games. At least 14 games were played in each of the dependency relationships in each country. Each participant was given an identical 30 minute tutorial on CT, consisting of a written description of the CT game, as well as an 8-minute movie that explained the rules of the game using a board that was different than those boards used in the actual study. Participants were seated in front of terminals for the duration of the study, and could not speak to each other or see their terminals. To standardize conditions with the experiments for collecting the data for learning, all participants played one game with the PAL agent, and were told they would be playing with different people.3 All results reported to be significant have been tested for significance in the p < 0.05 range using statistical ANOVA tests. We list the following three implementation details: First, the decay parameter for weighting players’ reliability measures in Equation 2 was set to 0.3. This weight was tuned empirically by comparing the performance of the PAL agent on the same held-out set of instances used to evaluate the learning models in Section 4. Second, PAL chose proposals within a 10-point interval of its maximal expected score (defined in Equation 5) with uniform probability. This “trembling-hand” randomization to PAL’s behavior, follows results demonstrating the benefit of randomization and unpredictability in human negotiation [3]. Third, to increase its likeness to human play, PAL did not make offers that were not present in its training set.
5.1
Comparison of Performance
Table 1 (on the following page) reports performance (in average score per game) for each of the countries and for each dependency condition. As shown by the Table, PAL was able to outperform people in all dependency conditions and in all countries: On average, PAL achieved 192.6 points in the U.S. (right-hand column in boldface), compared to 75.77 points for people; 132.6 points in Lebanon, compared to 94.86 points for people; and 152.75 points in Israel, compared to 97.85 points for people. As shown in Figure 3, PAL was also able to reach the goal significantly more often than people in all dependency conditions and in all countries. The best performance for PAL and the worst performance for people occurred in the U.S: As Table 1 shows, PAL’s average performance in the U.S. (192.6 points) was significantly higher than its performance in Lebanon (152.75 points) and Israel (132.6 points points), while people’s average performance in the U.S. (75.77 points) was significantly lower than in Lebanon (94.86 points) and Israel (97.85 points). As shown in Figure 3, these results are also supported when analyzing the number of times PAL got to the goal: For all dependency conditions, PAL was able to get to the goal significantly more often in the U.S. than in Lebanon and 3 All procedures involving people were authorized by the ethics review board of the relevant institutions.
$" !#," !#+" !#*" !#)" 9:/;02"?428"
!#("
@AB23";02"?428" Co-Dependent Independent PAL People PAL People 107 73 212.18 196.3 188 47 226.25 171.56 123 78 207.5 182.5
!#'" !#&"
Leb. U.S. Isr
!#%" !#$" !" -#."
/012343"
567208"
Dependent PAL People 79.3 15.3 163.75 8.75 127.77 33.05
Average PAL People 132.6 94.86 192.6 75.77 152.75 97.85
Table 1: Performance comparison for each condition and country $" !#," !#+" !#*" !#)" !#(" !#'" !#&" !#%" !#$" !"
!#,$" !#)("
!#('" !#&,"
!#&("
!#'$"
/012343" 9:/"
Dependent PAL People 0.89 0.69 0.375 0.312 0.90 0.46
567208"
@AB23"
Figure 3: Getting to the Goal (in percentage of games)
Israel, and people were able to reach the goal significantly less often in the U.S. than in Lebanon and Israel. The rest of this Section explains how PAL was able to succeed in the various conditions given this information.
Analysis of PAL Behavior
From observing PAL’s play in many games, we were able to identify several rules of behavior used by PAL that were consistent across the various dependency conditions. (1) PAL based its initial reliability measure in the games in the evaluation set (hence referred to as “evaluation games”) on people’s behavior in the game instances in the data used to train the models (hence referred to as “training games”). When people’s reliability in the training games was consistently very low or consistently very high, it commenced the evaluation games with a low reliability measure in fulfilling its agreements. In these clear-cut situations, it makes sense for PAL to adopt a low reliability. When people’s reliability measure in the training games was moderate, PAL adopted a higher reliability measure. (2) PAL was significantly less reliable when it became independent and did not depend on the other participant to reach the goal (or if it was already independent at the onset of the game). (3) PAL was significantly more reliable in games that lasted for many rounds. This caused PAL to establish reciprocal relationships with the other parties. (4) PAL was significantly less likely to fulfill agreements that allowed people to get to the goal. In the following sections, we will use these rules to analyze PAL’s performance in the various dependency relationships in each country.
5.2.1
Independent PAL People 0 0.64 0.07 0.1 0.55 0.46
Table 3: Learned and Adapted Reliability -#."
5.2
Leb. U.S. Isr
Co-Dependent PAL People 0.8 0.7 0.29 0.456 0.55 0.46
Task Co-Dependent Condition
As shown in Table 1, the highest performance of PAL in the co-dependent condition (188 points, left-hand column in boldface) occurred in the U.S. In addition, PAL got to the goal significantly more often in the U.S. (92%) than in Lebanon (35%) and in Israel (44%) in this condition. Table 2 reports the average reliability of participants in each of the conditions. As shown in the Table, the reliability of PAL was significantly lower in the U.S. (0.19) than in Israel (0.35) and in Lebanon (0.50). Also shown in the Table is that people’s
reliability in the U.S. (0.52) was lower than their reliability in Lebanon (0.63). To explain PAL’s success in the U.S. in light of the low reliability measures exhibited by both PAL and people, we need to analyze the evolution of PAL’s behavior over time. We begin by describing PAL’s reliability at the onset of the game. Table 3 shows people’s average reliability in the games in the training games in each country, and PAL’s adopted reliability measure after the first agreement in the games in the evaluation games. As shown by the Table, people’s reliability in the training games in Lebanon (0.7) were significantly higher than their reliability in the U.S. (0.456) and in Israel (0.46). Therefore, by learned rule (1), PAL’s initial reliability in Lebanon (0.8) was significantly higher than in the U.S. (0.29) or in Israel (0.55). To explain the difference between PAL’s initial reliability in the U.S. and in Israel, we need to distinguish those proposals that offered people to get to the goal, referred to as “Task Independent (TI) proposals for people”. Not shown in the table, is that over 77% of the first offers made in games in the U.S. were task TI offers for people, compared to 23% of first offers made in Lebanon, and 12% of first offers made in Israel. By learned rule (3), PAL was significantly less reliable when fulfilling TI proposals for people. This is supported by Table 4, which presents the percentage of TI proposals for people in the game (out of the entire set of proposals made in the game) and the reliability of PAL when fulfilling TI offers for people. As shown by the Table, in the co-dependent condition in the U.S., the reliability of PAL when fulfilling TI offers for people (0.05, in boldface) was significantly lower than its reliability when fulfilling TI offers in Lebanon (0.14) and in Israel (0.1). Next, we analyze PAL’s behavior during the game in the co-dependent condition. We refer to those proposals that offered PAL to get to the goal as “Task Independent proposals for PAL”. Table 5 shows the percentage of TI proposals for PAL in the game (out of the entire set of proposals made in the game) and the reliability of people when fulfilling TI offers for PAL. As shown in the Table the reliability of people in the U.S. when fulfilling TI offers for PAL was 0.45 (in boldface). But recall that Table 4 shows that the reliability of PAL in the U.S. when fulfilling TI offers for people was 0.05. This means that in the U.S. PAL was much less likely to fulfill its commitments than were people. Further analysis revealed that the vast majority of proposals in the U.S. (93%) occurred after PAL became independent and did not need the other player to get to the goal
Leb. U.S. Isr
Co-Dependent PAL People 0.50 0.63 0.19 0.52 0.35 0.45
Independent PAL People 0.08 0.82 0.05 0.69 0.22 0.55
Dependent PAL People 0.59 0.60 0.48 0.62 0.81 0.52
Average PAL People 0.39 0.69 0.19 0.6 0.38 0.5
Table 2: Reliability Measures for Participants
Leb. U.S. Isr.
Co-Dependent TI ratio PAL’s reliability 1.05 0.14 4.7 0.05 3.07 0.1
Dependent TI ratio PAL’s reliability 1.53 0 4.5 0.02 4.5 0.015
Table 4: Analysis of TI offers for people
Leb. U.S. Isr.
Co-Dependent TI ratio People’s reliability 0.94 0.4 1.64 0.45 1.7 0.25
Dependent TI ratio People’s reliability 0.73 0.37 1.56 0.496 0.72 0.54
Table 5: Analysis of TI offers for PAL
(not shown in the table). This means that PAL was able to reach the goal in early stages of the game in the U.S. According to learned rule (2), PAL was not reliable when it was independent. These findings explain how PAL was able to succeed in the U.S. while adapting a generally low reliability towards people. In contrast to the U.S., only 26% of proposals in Lebanon were made after PAL became task independent, which explains why PAL’s average reliability measure in the co-dependent condition in Lebanon (0.39), shown in Table 2 was higher than its reliability in the U.S. (0.19). To illustrate how PAL adapted its behavior in different countries the co-dependent condition, we include two examples of the evaluation games in Israel and Lebanon. In the Lebanon example, PAL began by accepting a 2-chipfor-2-chip proposal and transferring both chips following the agreement. The next agreement offered PAL the chips to get to the goal. As shown in Table 3, from the training games PAL learned that people in Lebanon were highly reliable. Therefore, PAL did not send any chips to the person following this agreement. In contrast, the person sent its promised chips to PAL, allowing PAL to get to the goal. This game was typical of Lebanon, in that games were relatively short, and people were generally reliable. In Israel, games were longer, and people were less reliable in the training games than in Lebanon. Specifically, in our example in Israel, PAL was fully reliable following the first two agreements, while the person did not send any of its promised chips. As a result, PAL did not send any chips for the third and fourth agreements. In the fifth agreement (a 1-chip-for-1-chip proposal), PAL was fully reliable. Lastly, for the sixth agreement (a 1-chip-per-3-chip proposal), which allowed PAL to get to the goal, the human was fully reliable, while PAL did not send any of its three promised chips. This example demonstrates PAL’s ability to establish a reciprocal relationship with its partner. Lastly, we explain the difference in PAL’s performance across countries. As shown in Table 5, the ratio of TI offers
for PAL in the U.S. (1.64, in boldface) was almost twice as high as the ratio of TI offers for PAL in Lebanon (0.94). Thus, there were significantly more proposals that allowed PAL to reach the goal in the U.S. than in Lebanon. In contrast, the ratio of TI offers for PAL in Israel (1.7) was as high in the U.S. However, as the Table also shows, people’s reliability following TI offers for PAL in Lebanon (0.4) and in the U.S. (0.45) was significantly higher than their reliability following TI offers for PAL in Israel (0.25). As a result, PAL was more likely to reach the goal in the U.S.
5.2.2
Task Dependent Condition
As shown by Table 1, the best performance for PAL in the task dependent condition was in the U.S. (163 points, in boldface). Table 2 shows that the lowest reliability exhibited by PAL (0.48, column “dependent”), was obtained in the U.S. In addition, PAL’s reliability measure in the task dependent condition in the U.S. (0.48) was lower than that of its reliability measure in Lebanon (0.59) and Israel (0.81). These results are similar to those reported for the task codependent condition. However, participants’ roles were not symmetric in the board games in the task dependent conditions. Specifically, in the games in which PAL was task dependent, people were task independent (and vice versa). Thus there were different factors that contributed to PAL’s success in the task dependent condition. We first observe Table 3, which shows that in the task independent condition, people’s reliability in the training games in Israel (0.46) and in Lebanon (0.64) was higher than their reliability in the U.S. (0.1). Therefore, by learned rule (1), PAL commenced the evaluation games with a higher reliability in the task dependent condition in Israel (0.9) and in Lebanon (0.89) than in the U.S. (0.375). As shown by Table 2, people’s average reliability in the task independent condition in the evaluation games in the U.S. (0.69) was significantly higher than their reliability in the training games (0.1, previously shown in Table 3). As a result, PAL increased its reliability in the evaluation games in the U.S. from 0.375 (shown in Table 3, dependent column) to 0.48 (shown in Table 2, dependent column). The difference between people’s reliability in the evaluation games in Lebanon and the U.S. compared to their reliability in the training games was not statistically significant. In addition, the evaluation games in Lebanon (3 rounds) were shorter than the evaluation games in Israel (6 rounds). Following learned rule (3), PAL dropped its reliability in Lebanon from 0.89 (shown in Table 3) to 0.59 (Table 2), and to a lesser extent in Israel from 0.9 to 0.81. To illustrate PAL’s strategy in the task-dependent condition, we bring an example of its play in the U.S. As shown in Table 3, from the training games PAL learned that people in the U.S. were not reliable. Therefore PAL does not send any of its chips after the first agreement (a 4-chip-per-3-chip proposal). In contrast, the person sends two of its promised 3 chips to PAL. PAL responds to this by being fully reliable
and sending all of its promised chips in the second agreement. However, the person did not send any of its promised chips to PAL in this agreement. In the third agreement (a 2-chip-per-1-chip proposal), PAL sent only one of its two promised chips to the person. The person sent PAL the chip it needs to get to the goal. As the example shows, it made sense for PAL to be partially reliable when the person is task independent at the onset of the game. To explain PAL’s success in the task dependent condition across all countries, we use Table 5, which analyzes the TI offers for PAL. As shown in the Table, the ratio of TI offers in the U.S. (1.56, in boldface) was more than twice that in Lebanon (0.73) and in Israel (0.72). This means there were significantly more offers made in the U.S. that allowed PAL to get to the goal. In addition, the reliability of people following TI offers for PAL in the task dependent condition in U.S. (0.496), shown in Table 5 was significantly higher than the reliability of PAL following TI offers for people in the task dependent condition in the U.S. (0.02), shown in Table 4. This is because when people were task dependent, PAL was task independent, and by learned rule (2), PAL was not reliable when it was independent.
5.2.3
Task Independent Condition
Recall that players in the task independent condition already possessed the necessary chips to get to the goal, and in addition could help their partners get to their own goal. As we expected, Table 1 shows that both the scores for PAL and people in this condition were higher than their scores in the task dependent and task co-dependent conditions. Similarly to the task co-dependent condition, Table 1 shows that the highest performance by PAL and the worst performance for people were obtained in the U.S. Table 2 shows that the reliability of PAL in the task independent condition was significantly lower for each country than its reliability in the other conditions. This can be explained by rule (2), in that PAL was far less likely to fulfill agreements when it did not need its partner to get to the goal. Interestingly, the Table also shows that the reliability of people in the task independent condition was significantly higher than their reliability in the other conditions. To explain this discrepancy, we observe that in the games in which people were task independent, PAL was task dependent. As shown by Table 2, the reliability of PAL in the task dependent condition was significantly higher in each country than its reliability in all of the other conditions. We thus attribute people’s high reliability measures when task independent to people’s reciprocity to the high reliability exhibited by PAL.
6.
CONCLUSIONS AND FUTURE WORK
This paper proposed a novel agent design for humancomputer negotiation in different cultures. It focused on settings where participants engage in repeated rounds of negotiation and agreements are not binding. To succeed in such settings agents need to reason about the effects of their negotiation behavior over time, and to adapt to people’s reaction to their behavior in different cultures. The proposed agent design combined a decision theoretic approach with classical machine learning techniques to model people’s behavior. This agent was evaluated empirically by playing with 157 people in three countries—Lebanon, the U.S., and Israel. The results show that the agent was able to outperform people in all countries and when varying how parties
depended on each other in the negotiations. The agent based its initial strategy on a general model of the population in each culture, and adapted its behavior to its particular partner over time. We are currently investigating the use of Markov Chain Monte Carlo sampling techniques for more efficient inference in the game.
7.
ACKNOWLEDGMENTS
This work is supported in part by the following grants: Marie Curie #268362, ERC grant #267523, ARO grants W911NF0910206, W911NF1110344 and U.S. Army Research Lab and Research Office grant MURI W911NF0810144. Thanks to Louise Hindal for her help with data collection in the U.S.
8.
REFERENCES
[1] A. Byde, M. Yearworth, K. Chen, C. Bartolini, and N. Vulkan. Autona: A system for automated multiple 1-1 negotiation. In Proceedings of EC, 2003. [2] C. De Dreu and P. Van Lange. The impact of social value orientations on negotiator cognition and behavior. Personality and Social Psychology Bulletin, 21:1178–1188, 1995. [3] R. Fisher and W. Ury. Getting to yes. Penguin Books New York, 1991. [4] Y. Gal, B. Grosz, S. Kraus, A. Pfeffer, and S. Shieber. Agent decision-making in open mixed networks. Artificial Intelligence, 174(18):1460–1480, 2010. [5] Y. Gal, S. Kraus, M. J. Gelfand, H. Khashan, and E. Salmon. Negotiating with people across cultures using an adaptive agent. ACM Transactions on Intelligent Systems and Technology, 3(1), 2012. [6] Y. Gal and A. Pfeffer. Modeling reciprocity in human bilateral negotiation. In AAAI’07, 2007. [7] M. J. Gelfand and S. Christakopoulou. Culture and negotiator cognition: Judgment accuracy and negotiation processes in individualistic and collectivistic cultures. Organizational Behavior and Human Decision Processes, 79(3):248–269, 1999. [8] M. J. Gelfand, G. Shteynberg, T. Lee, J. Lun, S. Lyons, C. Bell, J. Chiao, C. Bruss, M. Al Dabbagh, Z. Aycan, et al. The cultural contagion of conflict. Philosophical Transactions of the Royal Society B: Biological Sciences, 367(1589):692–703, 2012. [9] R. A. Howard and J. E. Matheson. Influence diagrams. In Readings on the Principles and Applications of Decision Analysis, pages 721–762, 1984. [10] C. Jonker, V. Robu, and J. Treur. An agent architecture for multi-attribute negotiation using incomplete preference information. Autonomous Agents and Multi-Agent Systems, 15(2):221–252, 2007. [11] S. Kraus, P. Hoz-Weiss, J. Wilkenfeld, D. Andersen, and A. Pate. Resolving crises through automated bilateral negotiations. Artificial Intelligence, 172(1):1–18, 2008. [12] Y. Oshrat, R. Lin, and S. Kraus. Facing the challenge of human-agent negotiations via effective general opponent modeling. In AAMAS, pages 377–384, 2009. [13] A. Rosenfeld and S. Kraus. Using aspiration adaptation theory to improve learning. In AAMAS, 2011.