Hindawi Publishing Corporation Mathematical Problems in Engineering Volume 2014, Article ID 362061, 12 pages http://dx.doi.org/10.1155/2014/362061
Research Article A Fast Acquisition Algorithm Overcoming Fuzz Problems for TDDM Spread Spectrum Signal Fang Liu and Yongxin Feng School of Information Science and Engineering, Shenyang Ligong University, Shenyang 110159, China Correspondence should be addressed to Yongxin Feng; onceowned
[email protected] Received 4 February 2014; Revised 9 April 2014; Accepted 5 May 2014; Published 28 May 2014 Academic Editor: Wang Xing-yuan Copyright © 2014 F. Liu and Y. Feng. This is an open access article distributed under the Creative Commons Attribution License, which permits unrestricted use, distribution, and reproduction in any medium, provided the original work is properly cited. TDDM (time division data modulation) technique will be used in the next generation GNSS (global navigation satellite system) to improve processing performance and to reduce inter-GNSS interference; however, the emergence of TDDM signal causes the estimation frequency and message reversal fuzz problems in the acquisition process of a GNSS receiver. At present, the traditional acquisition methods have some limitations and shortcomings. Therefore, aiming at the unique characteristics of TDDM signal, a fast acquisition algorithm is proposed to overcome these fuzz problems in this paper. In the proposed algorithm, three stages are obtained by some key technologies, which are the I-Q frequency compensation, superposition processing, subsection processing, and reversion position estimation. Besides, the algorithm is simulated from carrier frequency error, code phase error, message inversion error, and processing speed. Theoretical and simulation results show that the new algorithm can quickly overcome the fuzz problems, and the new algorithm is better than the existing algorithm in the speed and accuracy, which demonstrates that this new algorithm is an effective search scheme for the next generation GNSS signals.
1. Introduction GNSS (global navigation satellite system) [1] with the advantages of high accuracy, high speed, and low cost has become the most widely used application of spread spectrum communication technology [2, 3]. At the same time, TDDM (time division data modulation) [4] technique will be used in the next generation GNSS (global navigation satellite system) to improve processing performance and to reduce inter-GNSS interference. The mechanisms of TDDM modulation are a new spread spectrum technology using long-period code parity. Therefore, the TDDM signal has not only the characteristics of long codes but also the unique characteristics of this modulation method. In the spread spectrum communication technology research, the signal synchronization research plays a more and more important role in a receiver. Only by owning the signal synchronization ability, we can achieve the purpose of expectant measure, investigation, communication, navigation, and so on. So some synchronization acquisition algorithms are proposed, such as the long code acquisition algorithms [5–7] and the relevant algorithms based on FFT
[8, 9]. At the same time, many fast acquisition algorithms [10–13] are also proposed from the perspective of processing speed, and some improved XFAST algorithms [14, 15] have been proposed. Furthermore, some new studies on analysis of the signal synchronization are proposed, such as activation feedback control synchronization scheme [16] and projective synchronization scheme [17]. These algorithms and schemes can reach effective synchronization purpose. However, considering some synchronization problems, especially acquisition fuzz problems, are caused just because of the TDDM signal comprehensive properties, the above algorithms and schemes cannot solve the acquisition fuzz problems for TDDM signal. At present, the two-channel algorithm [18] is proposed to solve the fuzz problems of TDDM signal. Although the algorithm can deal with fuzz problems, the algorithm precision is not enough, and the processing speed is slow. In summary, according to the TDDM signal characteristics, combined with the existing research methods, a fast acquisition algorithm is proposed to overcome the fuzz problems for TDDM signal in this paper.
2
Mathematical Problems in Engineering ×105
5000 Correlation peak (dimensionless value)
Correlation peak (dimensionless value)
2.5
2
1.5
1
0.5
0
0
0.005
0.01
0.015
0.02
Accumulation time (s) (a) The theoretical correlation result
4500 4000 3500 3000 2500 2000 1500 1000 500 0
0
0.005
0.01 0.015 Accumulation time (s)
0.02
(b) The acquisition result
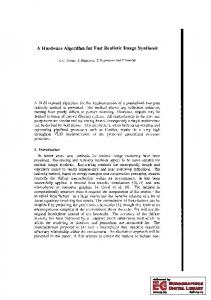
Figure 1: The correlation results in the condition of 20 ms accumulation time.
2. The Fuzz Problems of TDDM Signal Acquisition 2.1. The Fuzz Problem Caused by External Factors. Evident frequency error will appear due to relative motion when the signal arrives at the receiver, so the frequency mixing technology of multiple channels is usually used in traditional acquisition algorithms to overcome this problem. However, the residual frequency exists in the mixing signal, which will affect the correlation result. And if the residual frequency satisfies the following equation, the maximum error [19] will appear in the correlation result. Consider 𝑡 × Δ𝑓 =
1 ×𝑛 2
(𝑛 = 1, 2 ⋅ ⋅ ⋅ + ∞) ,
(1)
where 𝑡 is the accumulation time, Δ𝑓 is the residual frequency, and 𝑛 is a positive integer. Because the residual frequency is periodic function, the maximum error will appear in the correlation result when the single cycle of residual frequency satisfies the following equation: 𝑓𝑒 =
1 , 2𝑡
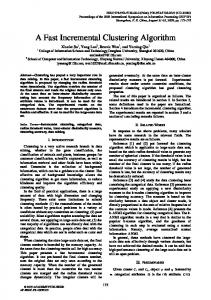
2.2. The Fuzz Problem Caused by Internal Factors. In TDDM spread spectrum processing, the odd code of PN code is modulated by message, but the even code of PN code is not modulated by message. If the message sign in the received signal is positive and there is no sign inversion, the correct acquisition result can be gotten in the traditional methods. However, if the message sign in the received signal is negative and there is no sign inversion, the test result of traditional acquisition method is shown in Figure 2. If the message sign in the received signal is not only positive but also negative, the test result of traditional acquisition method is shown in Figure 3. These test results showed that the TDDM mechanism caused the acquisition fuzz problems.
(2)
where 𝑓𝑒 is a cycle of the residual frequency. Now, the effect of residual frequency is verified by an example. In the condition of 20 ms accumulation time, the theoretical correlation result is shown in Figure 1(a). When the other conditions are the same, but the residual frequency is 25 Hz, the acquisition result was shown in Figure 1(b). These test results show that the correlation result cannot correctly be gotten when the residual frequency satisfies (2). Therefore, the influence of residual frequency is very great which causes fuzz problems of leakage acquisition.
3. The Fast Acquisition Algorithm Overcoming Fuzz Problems Currently, the two-channel algorithm [19] is an effective algorithm for TDDM signal. Firstly, the local code is divided into two channels in the two-channel algorithm. Then, circular correlation operations are completed between each channel signal and received signal of frequency compensation. Finally, each channel maximum peak is calculated, and the message reversion position is calculated. In the process of acquisition, the two-channel algorithm is suitable for the TDDM signal without message inversion, while it is not suitable for the TDDM signal with message inversion. Therefore, this algorithm cannot solve well the fuzz problems caused by TDDM modulation mechanism, and it cannot solve the fuzz problems caused by frequency compensation because the residual frequency influence has not been considered. Through the above analysis, we can see that the fuzz problems are caused by residual frequency and TDDM mechanism in the process of TDDM signal acquisition. At the same time, the existing algorithm has the limitations
Mathematical Problems in Engineering
3
4000 Correlation peak (dimensionless value)
Correlation peak (dimensionless value)
×104 6
5 4 3 2 1 0
0
0.002
0.004 0.006 Accumulation time (s)
0.008
3500 3000 2500 2000 1500 1000 500 0
0.01
0
0.002
0.004
0.006
0.008
0.01
Accumulation time (s)
(a) The theoretical correlation result
(b) The acquisition result
Figure 2: The test results in the condition of negative message sign.
5000 Correlation peak (dimensionless value)
Correlation peak (dimensionless value)
×104 6
5 4 3 2 1 0
0
0.002
0.004
0.006
0.008
0.01
Accumulation time (s) (a) The theoretical correlation result
4500 4000 3500 3000 2500 2000 1500 1000 500 0
0
0.002
0.004 0.006 Accumulation time (s)
0.008
0.01
(b) The acquisition result
Figure 3: The test results in the condition of positive and negative message sign.
of leakage acquisition and erroneous acquisition. Therefore, a fast acquisition algorithm overcoming fuzz problems is proposed, aiming at the unique characteristics of TDDM signal. 3.1. General Scheme. The new algorithm mainly includes search stage, coarse acquisition stage, and precise acquisition stage, and this algorithm general scheme is shown in Figure 4. In the search stage, the search speed is the key problem because of the bigger error, so the 𝐼-𝑄 frequency compensation processing is employed to overcome the frequency fuzz problem; the superposition processing of local code square
wave modulation and original code is employed to overcome message reversal fuzz problem. Further, the search speed is enhanced by subsection processing. In the coarse acquisition stage, the signal phase and frequency error are quickly determined by removing subsection processing and further 𝐼-𝑄 frequency compensation processing. In the precise acquisition stage, the received signal and local code are divided into two sections, and the length of each section is equal to the duration of half message code. If there is sign reversion in one section of received signal, there is surely no sign reversion in another section.
4
Mathematical Problems in Engineering
Received signal accumulation Received signal
I channel frequency compensation
Search stage +
Q channel frequency compensation
First segment ···
Original code
Local code accumulation
Square wave modulation
Local code
+
> threshold?
+
··· Nth segment
I channel maximum proportion peak calculation
·· ·· ·· Circular correlation
Maximum proportion peak calculation
Y
N
Coarse acquisition stage
I channel frequency compensation
Circular correlation
Received signal Q channel frequency compensation
Q channel maximum proportion peak calculation
Circular correlation First segment ·· ·· ·· ··· Circular ··· correlation mth segment
Frequency and code phase calculation
Maximum proportion peak calculation
Circular correlation
Coarse acquisition started
Original code +
Local code Square wave modulation
First half of signal Maximum result calculation
Received signal Second half of signal Parameter transfer
∑
X
Original code First half of sequence Square wave modulation
∑
X
Inversion position calculation
Local code ∑
X
Original code Second half of sequence Precise acquisition stage
Square wave modulation
X
Minimum result calculation
∑
Figure 4: The general scheme of the fast acquisition algorithm.
So the technology is used to find reversion section and combined with four channel correlation results to calculate message reversion position. 3.2. Algorithm Principle. The TDDM spread spectrum process is shown in (3), where 𝑑(𝑛) is the message code, 𝐶(𝑛) is the PN code, 𝑆𝑁(𝜔𝑆 𝑛) is the square wave, and 𝜔𝑆 is the frequency of square wave. If the message sign is positive in accumulation time, the TDDM spread spectrum result is equivalent to the product of message code and PN code. If the message sign is negative, the TDDM spread spectrum result is multiplied by the square wave. Further, the received signal
is shown in (4), where 𝜔𝑅 is the intermediate frequency and 𝜑𝑅 is the carrier phase. Consider 𝐶TDDM (𝑛) = (𝑑 (𝑛) 𝐶 (𝑛))|𝑇 ={
𝑑 (𝑛) 𝐶 (𝑛) , 𝑑 (𝑛) 𝐶 (𝑛) 𝑆𝑁 (𝜔𝑆 𝑛) ,
𝑑 (𝑛) = 1 𝑑 (𝑛) = −1
(3)
𝑆𝑅 (𝑛) = 𝐴𝐶TDDM (𝑛) cos (𝜔𝑅 𝑛 + 𝜑𝑅 ) (4) = 𝐴 (𝑑 (𝑛) 𝐶 (𝑛))|𝑇 cos (𝜔𝑅 𝑛 + 𝜑𝑅 ) .
Mathematical Problems in Engineering
5 + 𝐶𝑌∗ (((𝑖 − 1) 𝑁 + 𝑚 − 𝑛))𝑁
Firstly, the received signal is transmitted into the search stage. In this stage, the parallel 𝐼-𝑄 frequency compensation processes are employed, and the processes are expressed as
× 𝑆𝑁((𝜔𝑆 (𝑚 − 𝑛)))𝑁)
𝑆𝐼 (𝑛) = 𝑆𝑅 (𝑛) cos (𝜔𝑏 𝑛 + 𝜙𝑏 )
𝑚
+ 𝑆𝑄 (𝑚) (∑ 𝐶𝑌∗ (((𝑖 − 1) 𝑁 + 𝑚 − 𝑛))𝑁
= 𝐴 (𝑑 (𝑛) 𝐶 (𝑛))|𝑇 cos (Δ𝜔𝐼 𝑛 + Δ𝜑) 𝑆𝑄 (𝑛) = 𝑆𝑅 (𝑛) cos ((𝜔𝑏 +
𝜔𝑒 ) 𝑛 + 𝜑𝑏 ) 2
𝑖=1
(5)
+ 𝐶𝑌∗ (((𝑖 − 1) 𝑁 + 𝑚 − 𝑛))𝑁 × 𝑆𝑁((𝜔𝑆 (𝑚 − 𝑛)))𝑁)}]
= 𝐴 (𝑑 (𝑛) 𝐶 (𝑛))|𝑇 cos (Δ𝜔𝑄𝑛 + Δ𝜑) , where 𝜔𝑏 is the basal frequency, 𝜑𝑏 is the basal carrier phase, 𝜔𝑒 is the residual frequency, Δ𝜑 is the phase after frequency compensation, and Δ𝜔𝐼 and Δ𝜔𝑄 are the frequency of 𝐼 channel and 𝑄 channel, respectively. At the same time, 𝑚 segments local codes are accumulated; each segment length is equal to the length of the received signal, and then the local original code and its square wave modulation results are added, and the process is expressed as
𝑁
≈ ∑ 𝐴𝑑 (𝑚) cos (Δ𝜔min 𝑚 + Δ𝜑) 𝑚=0
4𝑚−1 𝑁
+ ∑ ∑ 𝐴𝑑 (𝑚) 𝐶 (𝑚) 𝐷𝑗 (𝑚) 𝑗=1 𝑚=0
× cos (Δ𝜔other 𝑚 + Δ𝜑)
𝐺𝑖 (𝑛) = 𝐶𝑌 ((𝑖 − 1) 𝑁 + 𝑛) + 𝐶𝑌 ((𝑖 − 1) 𝑁 + 𝑛) 𝑆𝑁 (𝜔𝑆 𝑛) ,
× 𝑅𝑁 (𝑛)
(𝑖 = 1, 2 ⋅ ⋅ ⋅ 𝑚) , (6)
where 𝑁 is the point number of correlation processing. Each segment superposition result is expressed as 𝑚
𝐺𝑋 (𝑛) = ∑𝐺𝑖 (𝑛) 𝑖=1 𝑚
= ∑ 𝐶𝑌 ((𝑖 − 1) 𝑁 + 𝑛)
(7)
𝑖=1
𝑁
4𝑚−1
𝑚=0
𝑗=1
≈ ∑ 𝐴𝑑 (𝑚) cos (Δ𝜔min 𝑚 + Δ𝜑) + ∑ 𝜆 𝑗 , (8) ∗ where 𝑅𝑁(𝑛) is the rectangle sequence, 𝐺𝑋 ((𝑚 − 𝑛))𝑁 is the result of conjugate and circular shifting for 𝐺𝑋 (𝑛), and 𝐷𝑗 (𝑚) is the other PN code. Because there is no correlation between 𝐷𝑗 (𝑚) and the received signal, the correlation result of 𝐷𝑗 (𝑚) and the received signal is equivalent to noise, and the noise is expressed as 𝜆 𝑖 . The maximum proportion peak is calculated using the correlation results, and the process is expressed as
+ 𝐶𝑌 ((𝑖 − 1) 𝑁 + 𝑛) 𝑆𝑁 (𝜔𝑆 𝑛) . Then, the circular correlation operation is completed by using the results of (5) and (7), and the process is expressed as 𝑁
∗ 𝑋 (𝑛) = [ ∑ (𝑆𝐼 (𝑚) + 𝑆𝑄 (𝑚)) 𝐺𝑋 ((𝑚 − 𝑛))𝑁] 𝑅𝑁 (𝑛) 𝑚=0 𝑁
∗ ∗ = [ ∑ 𝑆𝐼 (𝑚) 𝐺𝑋 ((𝑚 − 𝑛))𝑁 + 𝑆𝑄 (𝑚) 𝐺𝑋 ((𝑚 − 𝑛))𝑁] 𝑚=0
× 𝑅𝑁 (𝑛)
𝑃𝑉 =
𝑁 ⋅ max [𝑋 (𝑛)] ∑𝑁 𝑛=1 [𝑋 (𝑛)]
.
(9)
The frontal operations are redone using new received signal if 𝑃𝑉 cannot meet the threshold; otherwise, the received signal is transmitted in the coarse acquisition stage. In the coarse acquisition stage, the estimated frequency value 𝜔𝑑 is calculated by using the channel of 𝑃𝑉, and the 𝐼-𝑄 frequency compensation processes for received signal are done anew; they are expressed as 𝑆𝐼 (𝑛) = 𝑆𝑅 (𝑛) cos (𝜔𝑑 𝑛 + 𝜙𝑑 )
𝑁
= [ ∑ {𝑆𝐼 (𝑚) 𝑚=0
𝑚
× (∑ 𝐶𝑌∗ (((𝑖 − 1) 𝑁 + 𝑚 − 𝑛))𝑁 𝑖=1
= 𝐴 (𝑑 (𝑛) 𝐶 (𝑛))|𝑇 cos (Δ𝜔𝐼 𝑛 + Δ𝜑) 𝑆𝑄 (𝑛) = 𝑆𝑅 (𝑛) cos ((𝜔𝑑 +
𝜔𝑒 ) 𝑛 + 𝜑𝑑 ) 2
𝑛 + Δ𝜑) . = 𝐴 (𝑑 (𝑛) 𝐶 (𝑛))|𝑇 cos (Δ𝜔𝑄
(10)
6
Mathematical Problems in Engineering
The circular correlation between 𝑆𝐼 (𝑛), 𝑆𝑄 (𝑛), and 𝐺𝑖∗ ((𝑚 − 𝑛))𝑁 is expressed as 𝑁
is transmitted into the precise acquisition stage to estimate message inversion position. Consider 𝑃𝐼𝑖 =
𝑋𝐼𝑖 (𝑛) = [ ∑ 𝑆𝐼 (𝑚) 𝐺𝑖∗ ((𝑚 − 𝑛))𝑁] 𝑅𝑁 (𝑛) 𝑚=0 𝑁
𝑃𝑄𝑖 =
= [ ∑ {𝑆𝐼 (𝑚) (𝐶𝑌 (((𝑖 − 1) 𝑁 + 𝑚 − 𝑛))𝑁 𝑚=0
𝑁 ⋅ max [𝑋𝐼𝑖 (𝑛)] ∑𝑁 𝑛=1 [𝑋𝐼𝑖 (𝑛)]
𝑁 ⋅ max [𝑋𝑄𝑖 (𝑛)] ∑𝑁 𝑛=1
(12)
[𝑋𝑄𝑖 (𝑛)]
𝑃𝑋𝑖 = max {max [𝑃𝐼𝑖 ] , max [𝑃𝑄𝑖 ]} .
+ 𝐶𝑌 (((𝑖 − 1) 𝑁 + 𝑚 − 𝑛))𝑁 ×𝑆𝑁((𝜔𝑆 (𝑚 − 𝑛)))𝑁)} ] 𝑅𝑁 (𝑛) 𝑁
≈ ∑ (𝐴𝑑 (𝑚) cos (Δ𝜔𝐼 𝑚 + Δ𝜑))
In the acquisition stage, the received signal is divided into two sections, in which each section’s length is equal to the duration of half message code. The frequency compensation of each section is processed by using the result of coarse acquisition stage, and the processes are expressed as
𝑚=0
𝑆1 (𝑛) = 𝐴 (𝑑 (𝑛) 𝐶 (𝑛))|𝑇 cos (𝜔𝑅 𝑛 + 𝜑𝑅 ) cos (𝜔𝑔 𝑛 + 𝜑𝑔 )
4𝑚−1 𝑁
+ ∑ ∑ (𝐴𝑑 (𝑚) 𝐶 (𝑚) 𝐷𝑗 (𝑚)
= 𝐴 (𝑑 (𝑛) 𝐶 (𝑛))|𝑇 cos (Δ𝜔𝑔 𝑛 + Δ𝜑𝑔 ) ,
𝑗=1 𝑚=0
(𝑛 = 1, 2 ⋅ ⋅ ⋅ 𝐿) ,
× cos (Δ𝜔𝐼 𝑚 + Δ𝜑)) 𝑁
4𝑚−1
𝑚=0
𝑗=1
𝑆2 (𝑛) = 𝐴 (𝑑 (𝑛) 𝐶 (𝑛))|𝑇 cos (𝜔𝑅 𝑛 + 𝜑𝑅 ) cos (𝜔𝑔 𝑛 + 𝜑𝑔 )
≈ ∑ 𝐴𝑑 (𝑚) cos (Δ𝜔𝐼 𝑚 + Δ𝜑) + ∑ 𝜆 𝑗
= 𝐴 (𝑑 (𝑛) 𝐶 (𝑛))|𝑇 cos (Δ𝜔𝑔 𝑛 + Δ𝜑𝑔 ) ,
𝑁
𝑋𝑄𝑖 (𝑛) = [ ∑ 𝑆𝑄 (𝑚) 𝐺𝑖∗ ((𝑚 − 𝑛))𝑁] 𝑅𝑁 (𝑛)
(𝑛 = 𝐿 + 1, ⋅ ⋅ ⋅ 2𝐿) , (13)
𝑚=0 𝑁
= [ ∑ {𝑆𝑄 (𝑚) (𝐶𝑌 (((𝑖 − 1) 𝑁 + 𝑚 − 𝑛))𝑁 𝑚=0
+ 𝐶𝑌 (((𝑖 − 1) 𝑁 + 𝑚 − 𝑛))𝑁 ×𝑆𝑁((𝜔𝑆 (𝑚 − 𝑛)))𝑁)} ] 𝑅𝑁 (𝑛)
where Δ𝜔𝑔 is the frequency error and 𝐿 is the sampling point. Then, the local code is generated anew according to the result of coarse acquisition stage, and it is also divided into two sections. The first half of sequence is expressed as in (14) and the second half of sequence is expressed as in (15). Consider 𝐺1 (𝑛) = 𝐶𝑌 (𝑛) ,
𝑁
≈ ∑ (𝐴𝑑 (𝑚) cos (Δ𝜔𝑄 𝑚 + Δ𝜑))
(𝑛 = 1, 2 ⋅ ⋅ ⋅ 𝐿)
𝐺1 (𝑛) = 𝐶𝑌 (𝑛) 𝑆𝑁 (𝜔𝑆 𝑛) ,
𝑚=0
𝐺2 (𝑛) = 𝐶𝑌 (𝑛) ,
4𝑚−1 𝑁
+ ∑ ∑ (𝐴𝑑 (𝑚) 𝐶 (𝑚) 𝐷𝑗 (𝑚)
4𝑚−1
𝑚=0
𝑗=1
(𝑛 = 𝐿 + 1, 𝐿 + 2 ⋅ ⋅ ⋅ 2𝐿) .
(15)
Furthermore, the correlation process is expressed as
𝑚 + Δ𝜑)) × cos (Δ𝜔𝑄 𝑁
(14)
(𝑛 = 𝐿 + 1, 𝐿 + 2 ⋅ ⋅ ⋅ 2𝐿)
𝐺2 (𝑛) = 𝐶𝑌 (𝑛) 𝑆𝑁 (𝜔𝑆 𝑛) ,
𝑗=1 𝑚=0
(𝑛 = 1, 2 ⋅ ⋅ ⋅ 𝐿)
𝐿
𝑋1 = ∑ 𝐺1 (𝑛) 𝑆1 (𝑛)
𝑚 + Δ𝜑) + ∑ 𝜆 𝑗 . ≈ ∑ 𝐴𝑑 (𝑚) cos (Δ𝜔𝑄
𝑛−1
(11) Further, the maximum proportion peaks are calculated using the above results, as (12). The final estimated frequency is calculated using the channel number of 𝑃𝑋𝑖 , and the code phase is calculated using the position of 𝑃𝑋𝑖 . Through the above operations, the carrier frequency and code phase can be controlled in a certain range. However, the message inversion fuzz problem still exists, so the received signal
𝐿
𝑋1 = ∑ 𝐺1 (𝑛) 𝑆1 (𝑛) 𝑛−1 2𝐿
𝑋2 = ∑ 𝐺2 (𝑛) 𝑆2 (𝑛) 𝑛=𝐿+1 2𝐿
𝑋2 = ∑ 𝐺2 (𝑛) 𝑆2 (𝑛) . 𝑛=𝐿+1
(16)
Mathematical Problems in Engineering
7
The maximum of four correlation results is expressed as in (17), and the minimum is expressed as in (18). Consider 𝑋max = max [𝑋1 , 𝑋1 , 𝑋2 , 𝑋2 ]
(17)
𝑋min = max [𝑋1 , 𝑋1 , 𝑋2 , 𝑋2 ] .
(18)
Let 𝑋Δ be an intermediate variable; the process methods in the channel of 𝑋Δ and 𝑋max are the same; 𝑋Δ and 𝑋max are in different section; let 𝜉 be the estimated inversion position of each section. If the sign of received signal is positive and local signal is PN code itself, then 𝑍 is used to express the correlation coefficient. If the sign of received signal is negative and local signal is the modulation result of PN code and square wave, then 𝐹 is used to express the correlation coefficient. 𝑍 is used to express the correlation coefficient in other conditions. If inversion position is in the first section and the sign is from positive to negative, (19) is established, and then it is derived as (20). Furthermore, (21) is established, due to 𝑋max = 𝑋2 , 𝑋min = 𝑋2 , and 𝑋Δ = 𝑋1 . Consider 𝑋1 = 𝜉 ⋅ 𝑍 + (𝐿 − 𝜉) ⋅ 𝐹 𝑋1
= 𝜉 ⋅ 𝐹 + (𝐿 − 𝜉) ⋅ 𝑍
𝑋2 = 𝐿 ⋅ 𝐹
(19)
𝑋2 = 𝐿 ⋅ 𝑍 , 𝜉= 𝜉=
−
𝑋1 )
𝑋2
− 𝑋2
⋅𝐿
,
(𝑋max − 𝑋Δ ) ⋅ 𝐿 . 𝑋max − 𝑋min
(20)
𝑋1 = 𝜉 ⋅ 𝑍 + (𝐿 − 𝜉) ⋅ 𝐹
𝜉=
(𝑋2 − 𝑋1 ) ⋅ 𝐿 𝑋2 − 𝑋2
𝜉=
(𝑋max − 𝑋Δ ) ⋅ 𝐿 𝑋max − 𝑋min
𝑋1 = 𝐿 ⋅ 𝑍
𝜉=
𝜉=
(𝑋2 − 𝑋1 ) ⋅ 𝐿 𝑋1 − 𝑋1
, (24)
(𝑋Δ − 𝑋min ) ⋅ 𝐿 𝑋max − 𝑋min
(25)
𝑋1 = 𝐿 ⋅ 𝐹 𝑋1 = 𝐿 ⋅ 𝑍 𝑋2 = 𝜉 ⋅ 𝐹 + (𝐿 − 𝜉) ⋅ 𝑍 𝑋2 = 𝜉 ⋅ 𝑍 + (𝐿 − 𝜉) ⋅ 𝐹 𝜉=
(𝑋2 − 𝑋1 ) ⋅ 𝐿 𝑋1 − 𝑋1
(26)
,
(𝑋Δ − 𝑋min ) ⋅ 𝐿 . 𝑋max − 𝑋min
(27)
Finally, it can be derived from (21), (23), (25), and (27) that the message inversion position is (𝑋max − 𝑋Δ ) ⋅ 𝐿 { , (𝑋max ⊂ (𝑋2 , 𝑋2 )) { { { 𝑋max − 𝑋min 𝜉={ { { {𝐿 + (𝑋Δ − 𝑋min ) ⋅ 𝐿 , (𝑋 max ⊂ (𝑋1 , 𝑋1 )) . 𝑋max − 𝑋min {
(28)
4. Simulation and Analysis
𝑋1 = 𝜉 ⋅ 𝐹 + (𝐿 − 𝜉) ⋅ 𝑍
𝑋2 = 𝐿 ⋅ 𝐹,
𝑋2 = 𝜉 ⋅ 𝐹 + (𝐿 − 𝜉) ⋅ 𝑍 ,
(21)
In the same ways, if inversion position is in the first section and the sign is from negative to positive, (22) and (23) are established. If inversion position is in the second section and the sign is from positive to negative, (24) and (25) are established. If inversion position is in the second section and the sign is from negative to positive, (26) and (27) are established. Consider
𝑋2 = 𝐿 ⋅ 𝑍
𝑋2 = 𝜉 ⋅ 𝑍 + (𝐿 − 𝜉) ⋅ 𝐹
𝜉=
(𝑋2
𝑋1 = 𝐿 ⋅ 𝐹
(22)
(23)
The new algorithm is simulated and analyzed based on MATLAB simulation platform. The basic parameters are as follows: message rate of 100 Hz, PN code rate of 1 MHz, carrier frequency of 3 MHz, and sampling frequency of 12 MHz. 4.1. Algorithm Simulation. The simulation parameters in the first example are as follows: carrier frequency offset is 845 Hz, PN code offset is 42 ms, accumulation time is 10 ms, SNR is −12 dB, and the message sign is always positive. The simulation parameters in the second example are as follows: carrier frequency offset is 1190 Hz, PN code offset is 24 ms, accumulation time is 10 ms, signal to noise ratio is −12 dB, message sign is from negative to positive, and reversion position is 26.5 ms. The simulation results of search stage are shown in Figures 5 and 6, and the proportion peak results are shown in Figures 7 and 8. Figures 5 and 7 show that the proportion peak of the ninth channel is maximum value, thus preliminarily estimating carrier frequency as 800 Hz in the first example. Figures 6 and 8 show that the proportion peak of the 13th channel is maximum value, thus preliminarily estimating carrier frequency as 1200 Hz in the second example.
8
Mathematical Problems in Engineering 18
6
5 4 3 2 1 0 ×104 15 Sam 10 plin g
5 nts
poi
0 0
5
20 15 rs 10 b um e nel n Chan
Proportion peak (dimensionless value)
Correlation peak (dimensionless value)
×104
25
Figure 5: The simulation result of search stage in the first example.
16 14 12 10 8 6 4
0
5
10
15
20
25
×104 8
Figure 8: The proportion peak result of search stage in the second example.
6 4 2
0 ×104 15
Sam 10 plin g
5 nts
poi
0 0
5
20 15 s 10 b m er nel nu Chan
25
Figure 6: The simulation result of search stage in the second example.
Proportion peak (dimensionless value)
12 11
Maximum proportion peak (dimensionless value)
Correlation peak (dimensionless value)
Channel numbers
50 45 40 35 30 25 20 15 10 5 0
1
2
10
3
4 5 Segment numbers
6
7
8
I channel Q channel
9
Figure 9: The maximum proportion peak of coarse acquisition stage in the first example.
8 7 6 5
0
5
10 15 Channel numbers
20
25
Figure 7: The proportion peak result of search stage in the first example.
In the coarse acquisition stage, the maximum proportion peak results of 𝐼 channel and 𝑄 channel are shown in Figures 9 and 10. Figure 9 shows that the maximum proportion peak of 𝑄 channel is greater than 𝐼 channel; thus further estimated carrier frequency is 825 Hz in the first example. Figure 10 shows that the maximum proportion peak of 𝐼 channel is
greater than 𝑄 channel, thus estimating carrier frequency as 1200 Hz in the second example. At the same time, the PN code offset is estimated as 42 ms by the position of maximum proportion peak in the first example, and it is shown in Figure 11. The PN code offset is estimated as 24 ms in the second example, and it is shown in Figure 12. Four correlation peaks in the precise acquisition stage are used in (28); thus the message sign is estimated as positive in the first example. The message sign is estimated from negative to positive, and the estimated reversion position is 26.58 ms in the second example. All simulation results of the first example show that the frequency error is 20 Hz, the PN code phase error is 0, and the message reversion error is 0. The second example results
9 ×10⁴ 3.5
40 35 Correlation peak (dimensionless value)
Maximum proportion peak (dimensionless value)
Mathematical Problems in Engineering
30 25 20 15 10 5
1
2
3
4 5 Segment numbers
6
7
8
3 2.5 2 1.5 1 0.5 0
0
0.01
0.02
I channel Q channel
Figure 10: The maximum proportion peak of coarse acquisition stage in the second example.
0.03 0.04 0.05 0.06 Accumulation time (s)
0.07
0.08
Figure 12: The final estimated PN code offset result in the second example.
16000 14000
Proportion peak (dimensionless value)
Correlation peak (dimensionless value)
18000
12000 10000 8000 6000
120 100
4000 2000 0
0
0.01
0.02
0.03 0.04 0.05 0.06 Accumulation time (s)
0.07
80 60 40 20 0 30 Ch 20 ann el n u
0.08
Figure 11: The final estimated PN code offset result in the first example.
10 mb ers
5
0 0
Seg
15 10 bers num ment
20
Figure 13: The relationship between the segment number and the proportion peak in search stage.
4.2. Performance Analysis. This chapter aims to analyze this new algorithm adaptability and validity from diverse angles. The effects of Doppler and message inversion on the search stage are not obvious because this stage is the initial acquisition stage. Therefore, the effects of the segment number selection and SNR are analyzed in this stage. The relationship between the segment number selection and the proportion peak is shown in Figure 13, which shows that the proportion peak decreases gradually along with the increase in segment number. The relationship between SNR and the proportion peak is shown in Figure 14, which shows that the proportion peak decreases gradually along with the decrease of SNR. Because the proportion peak will not meet
Proportion peak (dimensionless value)
show that the frequency error is 10 Hz, the PN code phase error is 0, and the message reversion error rate is 0.8%. 100 80 60 40 20 0 30 Ch 20 ann el n u
10 mb ers
0 0
5
20 15 10 ) (−dB SNR
25
Figure 14: The relationship between the SNR and the proportion peak in search stage.
10
Mathematical Problems in Engineering 1.5
90 Estimation inversion rate error (%)
Proportion peak (dimensionless value)
100
80 70 60 50 40 30
1
0.5
20 10
0
0
5
10 15 SNR (−dB)
20
0
25
60
80
100
Positive to negative Negative to positive Theory value
Figure 15: The relationship between the SNR and the proportion peak in coarse acquisition stage.
Figure 17: The estimation inversion rate error in precise acquisition stage.
100
2.5
90
2 Estimation inversion rate error (%)
Estimation inversion rate (%)
40
Inversion rate (%)
Q channel I channel
80 70 60 50 40 30 20
1.5 1 0.5 0 −0.5 −1 −1.5 −2
10 0
20
0
20
40 60 Inversion rate (%)
80
100
Positive to negative Negative to positive Theory value
Figure 16: The estimation inversion rate result in precise acquisition stage.
the threshold requirement when SNR reaches −25 dB, the adaptation SNR of this algorithm is not less than −25 dB. The effect of SNR in the coarse acquisition stage is obvious, and the relationship between SNR and the proportion peak is shown in Figure 15, which shows that the proportion peak decreases gradually along with the decrease of SNR. The proportion peak of 𝑄 channel is always greater than 𝐼 channel, so the compensation frequency of 𝑄 channel is more close to the real value in this condition.
−2.5
0
10
20
−1 dB −5 dB −10 dB
30
40 50 60 70 Inversion rate (%)
80
90
100
−15 dB −20 dB
Figure 18: The relationship between estimation inversion rate error and SNR in precise acquisition stage.
The effects of Doppler, message inversion, and SNR on the precise acquisition stage are obvious because this stage is a precise stage. The estimation inversion rate result in precise acquisition stage is shown in Figure 16 under the conditions that Doppler error is zero and SNR is zero, and the estimation inversion rate error is shown in Figure 17. The results show that the estimation error is less than 1.5% and it can meet the acquisition requirement. Finally, the relationship between estimation inversion rate error and SNR is shown in Figure 18, which proves that the estimation error
Mathematical Problems in Engineering
11
Table 1: The acquisition time of two algorithms with different search range. Algorithm Two-channel algorithm New algorithm
100 ms 69.15 s 7.24 s
200 ms 138.42 s 14.46 s
300 ms 206.18 s 21.87 s
400 ms 278.15 s 29.43 s
Search range 500 ms 600 ms 346.98 s 416.12 s 36.59 s 43.7 s
700 ms 485.81 s 51.38 s
800 ms 554.90 s 58.52 s
900 ms 624.12 s 65.89 s
1s 693.3 s 73.59 s
80 Hz 20 Hz 20 Hz
90 Hz 10 Hz 10 Hz
Table 2: The estimation frequency error of two algorithms with different Doppler. Algorithm Two-channel algorithm New algorithm
10 Hz 10 Hz 10 Hz
20 Hz 20 Hz 5 Hz
30 Hz 30 Hz 5 Hz
40 Hz 40 Hz 15 Hz
Doppler 50 Hz 50 Hz 25 Hz
60 Hz 40 Hz 35 Hz
70 Hz 30 Hz 30 Hz
Table 3: The estimation code phase error of two algorithms with different code phase. Algorithm Two-channel algorithm New algorithm
1 chip