A fast image processing based kin recognition method in a robot swarm a b
K. Bolla a,*, T. Kovacs a, G. Fazekas
b
Kecskemet College, Izsaki ut 10, H-6000 Kecskemet, Hungary University of Debrecen, Egyetem t. 1, 4032 Debrecen, Hungary
*Corresponding author. E-mail address:
[email protected]
Abstract In this paper we develop a reliable and fast visual recognition algorithm to detect kin object in a robot swarm, where every robot is equipped with a zebra pattern. Our idea is based on Fast Fourier Transform (FFT), which is sensible for this kind of pattern and has a relatively low complexity. We sampled the camera images of the robot by a vertical sampling method, and the sampled one dimensional vectors were the inputs of the FFT. The basic idea of the pattern localization is that there is a distinguishable peak in the FFT spectrum if the sample went through the horizontal zebra pattern. If this peak is larger than an empirically determined threshold value the algorithm finds the location of a kin robot. To test our idea more experiments were accomplished with Surveyor SRV1 robots, which have on-board camera system. The captured pictures of the observer robot were sent to and processed in a PC using MATLAB program. Keywords: mobile robots, visual tracking, kin recognition
1. Introduction In the last few decades a considerable development achieved in the field of swarm intelligence and multirobot cooperation and due to this now there is a wide variety of problems that can be solved efficiently by a group of autonomous robot workers. The most investigated tasks are, for example, the exploration of an unknown area [1, 2, 3] and the realization of some collective movement patterns such as gathering or chain formation [4]. In most of the cases the mobile robot has to navigate in a space populated by different objects and obstacles. Provided that the robots are equipped with on board or outer camera, it is a crucial task, based on the pictures of the camera, to distinguish the team members from the indifferent objects and, moreover, the team members from each other. If this so called visual kin recognition ability is granted then much more advanced swarm intelligence algorithms can be realised. Note that this visual identification of the robots means also localization, since the approximate coordinates of the robots can be recovered from the camera picture. A number of works investigated the possibility of such a camera based recognition and localization system using various image processing and shape or colour extraction algorithms [5, 6, 7]. However, all of these applied methods consisted of algorithms with a complexity of the order of at least n 2 (where n is the
linear size of the camera image in pixels). This can be a problem in the case when it is not possible to send the pictures to an outer work-station but the pictures of the on-board camera have to be processed by the mobile robot itself. (Actually, this is the case, when we have a real autonomous robot swarm.) The computational resources of a small mobile robot can be very limited even compared to an ordinary PC, therefore a less complex and fast solution for the problem is of high importance. In the present work a fast visual kin recognition and localization algorithm with the complexity of the order of n ⋅ log(n) is proposed and tested. The method is based on masquerading of the robots by a zebra pattern and searching for this pattern in the camera picture by Fast Fourier Transform (FFT). The complexity of the FFT, which is n ⋅ log(n) for a row of n elements, gives the complexity of the whole algorithm. The proposed method is tested with the help of the Surveyor SRV-1 robot, which is equipped a proper camera and picture capturing system. At the present phase of our work the image processing part is implemented in an outer workstation using MATLAB, and the implementation for the robot’s microcontroller is left to a future work. In the next section the mathematical details of the proposed method are given. In Section 3 the test of the method is introduced, and in the last section we conclude our results.
2. The visual kin recognition method As it was mentioned in the introduction the basic idea of the visual kin recognition is that a zebra pattern is searched in the picture captured by the robot camera. To understand the details of our visual kin recognition algorithm, first let us give brief description about the basic notions used in the image procession.
Fig. 1. Digital image vertical sampling for FFT 2.1. Digital image
A digital gray image is represented by a twodimensional array of size ( M × N ) or interpreted as two dimensional spatial function ( f ( x, y ) ). If we use gray images each pixel corresponds to a value from 0 to 255: Pxy : ( x, y ) → [0,255] , (1) where Pxy denotes the pixel value at the coordinates of ( x, y ) .
Each coordinate pair determines a pixel location, where x ( x ∈ [1, N ] ) is the column and y ( y ∈ [1, M ] ) is the row index. Let us introduce the notion of vertical sampling, which has a high importance in our method. It is assumed that a zebra pattern is located somewhere in the captured digital image of the robot. In order to determinate the horizontal location of the kin robot i.e. locate the zebra pattern, we have to take sample-columns of width one pixel and of length M pixels from the digital image. This method called vertical sampling. A sampled column represented as a set of pixel values, and can be given as: S x0 = Px0 yi 0 < i ≤ M . (2)
{
}
In this case the parameter x is fixed and the parameter y changes from 0 to M. 2.2. Pattern recognition
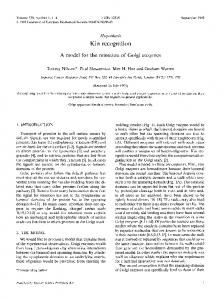
The basics of our idea are shown in Figure 1. Each team member (robot) got a zebra pattern, since this kind of
pattern could be easily detected by the FFT analysis. The captured digital image is sampled by the vertical sampling technique, thus the input of the FFT is only a one dimensional signal, which is a column of the captured image. If the sample-column contained the zebra pattern then this results in a distinct peak in the FFT spectrum. The FFT spectrum can be computed easily in MATLAB with the help of the following formula: (3) C ( f ) = F ( H ( S x0 )) where C ( f ) is the frequency dependent Fourier coefficient function of the sample-column, H is the Hilbert transform (interpreted by the means of the MATLAB system) and F stands for the Fourier transform. The F and H functions correspond to the fft and hilbert functions in MATLAB. Regarding the details of these transforms see for example Ref. [8]. The Fourier transform can be accomplished by FFT, which has the complexity of M log(M ) . Figure 2 demonstrates three vertical samples and their FFT spectrums. Figure 2/a shows the original image, the b, c and d show the FFT spectra obtained from the samples marked on the original image. In the former two there are no distinct peaks in the spectrum in the region of interest, however, d contains a unique peak, as the selected column goes throw the zebra pattern. Since the coefficients in the low frequency region of the spectrum are much higher than the peak value of the pattern, it necessary to appoint a “searching window” in the frequency domain around f p i.e. the maximum place of the of peak and restrict the search of the peak to this window. Let denote this window as: W = [ f min , f max ] . (4) This method provides an efficient way to find the peak location, which generated by the pattern. When the FFT spectrum of a certain sample is obtained we have to determine if the sample goes through the zebra pattern or not. In order to decide this, the maximum value (denoted by A p ) of the spectrum in the W window is calculated, and then this maximum value is compared to a T ( f p ) threshold. This is a well known method in the decision-making procedure. Actually the threshold value will be the stopping condition of the kin recognition algorithm. More precisely, the decision process above can be given as: • take the sample S x0 at position x 0 ; •
calculate C ( f ) ;
•
find the maximum value ( A p ) of C ( f ) inside the
•
window W ; if A p > T ( f p ) then stop further search;
•
if A p ≤ T ( f p ) continue searching, i.e. go to step
first and repeat the algorithm with another x0 value. The T ( f p ) threshold function can be established in an empirical way (see the next section). 2.3. Heuristic searching in the digital image
By now the zebra pattern recognition method is specified. The problem is how we could find the location of pattern in the image plane. Implicitly the easiest solution for the problem is to scan the image column by column. However, with this exhaustive search the algorithm
complexity grows to N ⋅ M log(M ) . Thus it is necessary to define a heuristic and much faster searching method to find the location of the zebra pattern in the image plane. An efficient answer for this issue is a tree-like heuristic searching. Figure 3 shows this heuristic method, that establishes the searching order by the binary tree breadth-first traversal. As it is shown by the figure this searching process quickly reduces the largest width of the undiscovered column-streaks in the image. The searching order, which gives the order of the x0 sample positions, will be the following (if we have a 320x240 resolution image): x0 =160, 80, 240, 40, 120, 200, 280, 20, 60… This searching procedure does not stop until find the zebra pattern.
Fig. 2. FFT spectra of three different vertical samples
The camera system of the robot captures images (frames) continuously and passes them to the algorithm for procession. Every single image needs the search window W and threshold function T ( f p ) to detect the zebra pattern. The search window of a certain picture can be determined with the help of the previous (and processed) image, because the frequency of the peak cannot change abruptly. This means that the frequency variations refer to a continuous function. So the window Wi of the i-th image is chosen as:
robot also has two laser pointers to distance measurement. The robot is capable to communicate with a PC or another kin Surveyor robot using its wireless interface. The software of the Surveyor robots includes a linux operating system and a preinstalled framework. This framework also contains a Pico C interpreter to execute on-board programs. This language provides the possibility to create a self-navigating autonomous robot.
3 f pi −1 fp Wi = i −1 , (5) , 2 2 where f pi −1 is the maximum place of the frequency
peak (caused by the pattern) in the (i-1)-th image.
Fig. 4. Surveyor SRV1 robot with the zebra pattern In order to masquerade the robot with the zebra pattern a simple plastic cylinder was used with alternating horizontal black and white streaks on it. This cylinder shows the same visage from any angle of view. Briefly the cylinder provides a simple, movement invariant solution for the kin recognition method. 3.2. The experiment
Fig. 3. Solution for the vertical sampling order
3. Experiments and results The method detailed in Section 2 was tested by a relatively simple experiment with the help of the Surveyor SRV1 robot system. 3.1. The Surveyor-SRV1 robot
The Surveyor-SRV1 (see Figure 4) robot is designed for research, education and exploration. It employs the SRV1 Blackfin Camera Board with a 500MHz Analog Devices Blackfin BF537 processor. The video camera has resolutions from 160x128 to 1280x1024 pixels, and the
In the experiment there were only two robots involved: an observer robot, which is equipped with a camera, and a moving kin robot, which should be localized in the camera picture. The task of the observer robot is to capture images and implement image processing, which was detailed in the previous section. Figure 5 shows the experimental setup. The observer is immobile and sends the captured frames to a PC for processing. Furthermore, the visual system of the observer always sees the moving robot. The task of the moving robot is to follow a zigzag path gradually distanced from the observer. The observer has 5 frames/second image capturing rate at 320x240 resolution. These images are sent to the PC as inputs of the image processing using MATLAB. When the distance is gradually increases the observed frequency of the zebra pattern increases too. Thus a relationship can be established between the distance and the detected frequency. Beyond a certain
distance the processing method becomes unreliable, because the resolution of the camera is too small and the pixels cannot determine the pattern efficiently. The theoretical limit of this distance is when the width of the streaks of the zebra pattern is only one pixel, that is the frequency value of f p is equal to the Nyquist frequency. By the means of our experiments this distance is approximately 5 meters.
It can be seen that the peak value versus distance curve resembles a power function with negative power. Therefore the threshold function here is chosen as: T ( f ) = 10 5 ⋅
1 fp
(6)
The coefficient of the function was approximated by the experimental curve. The approximated curve is also shown in Figure 6. Note that it is also possible to estimate distance between observer and moving robot with the help of the detected f p frequency value based on the relationship between frequency and distance. 3.2. The results
Fig. 5. The experimental setup
In this subsection we exhibit the results of the above mentioned experiment. Figure 7 shows 3 processed input images and their FFT spectra. The images contain a vertical line to sign the found vertical sample which corresponds to the stopping conditions. Each line has some details next to it, such as x coordinate, frequency and FFT coefficient. Axes of the FFT spectrums show the found peak and the searching windows. The dependence between distance and frequency values can be seen clearly in these picture-pairs.
4. Conclusions
Fig. 6. Distance measurement and the proposed threshold function denoted by continuous and dashed lines, respectively The threshold function T ( f p ) , as it was mentioned in the previous section, was determined empirically. Images were captured at different distances (from 20cm to 300cm) about the cylinder with the zebra pattern. The values of the frequency peaks caused by the pattern were recorded for each distance value. The results are shown in Figure 6.
Finally we summarize the results of our visual kin recognition algorithm: • the proposed location method is reliable in various environments; • complexity of the proposed algorithm is lower than the used visual kin recognition methods till now; • our method is capable to estimate the robotrobot distance by the frequency value of the maximum peak; In the future we are planning to develop this method for more kin robot recognition. This can be based on an additional vertical zebra pattern, the frequency of which is a certain multiple of the frequency given by the horizontal pattern. Thus the expanded patterns provide a reliable method to not only detect but also identify each kin object in the image plane of robots. Furthermore we are planning to program the Surveyor SRV1 robots on-board using only the provided hardware capability of the robots.
Fig. 7. Three images from the series taken by the camera of the observer and the FFT spectra of the three vertical samples indicated in the images by the solid lines. The searching windows are denoted in the spectra by vertical segments
References [1] C. Stachniss and W. Burgard, “Exploring unknown environments with mobile robots using coverage maps”, Proc. of the International Joint Conference on Artificial Intelligence (IJCAI), pp. 1127-1134, 2003. [2] S. Rutishauser, N. Correll and A. Martinoli, “Collaborative coverage using a swarm of networked miniature robots”, Robotics and Autonomous Systems, doi:10.1016/j.robot.2008.10.023. [3] M. N. Rooker and A. Birk, “Multi-robot exploration under the constraints of wireless networking”, Control Engineering Practice 15, pp. 435–445, 2007 [4] S. Nouyan and M. Dorigo, “Chain based path formation in swarms of robots”, Ant Colony Optimization and Swarm Intelligence, M. Dorigo et al., Eds., Springer-Verlag Berlin Heidelberg, pp. 120–131, 2006. [5] I. Engedy, G. Horváth, A global camera –based mobile robot localization, proc. of the 10th International Symposium of Hungarian Researchers on CINTI 2009, pp. 217-228. [6] I. Rekleitis, G. Dudek, E. Milios, Multi-robot collaboration for robust exploration, Annals of
Math. and Artifical Intelligence 31, (2001), pp. 740. [7] Y. Han, H. Hahn, Visual Tracking of a moving Target using Active Contour based SSD Algorithm, Robotics and Autonomous Systems 53, (2005), pp. 265-281 [8] V. K. Ingle, J. G. Proakis, Digital Signal Processing using MATLAB, Thomson Bookware Companion Series 2007