Diffusion-sensitized provides a means of probing the architectural features of structures that are smaller than a voxel. In the central nervous system, reduced ...
A Finite
Difference ‘Model
for
Simulating
Restricted
Diffusion
in the Spinal
Cord
Scott N. Hwang, Felix W. Wehrli, and David B. Hackney University
of Pennsylvania
Medical
Center, Department
INTRODUCTION
Diffusion-sensitized provides a means of probing the architectural features of structures that are smaller than a voxel. In the central nervous system, reduced diffusion anisotropy following spinal cord injury has been attributed to axonal swelling and decreasedmembrane permeability. Furthermore, regenerating and sprouting axon fibers are typically tortuous, small, and unmyelinated (1). Effects of these tissue parameterson the apparent diffusion coefficient (ADC) may potentially be exploited to assessneural damage and repair. Previous attempts to predict effects of morphologic changes relied on geometric approximations of axons and treated myelin as infinitesimally thin (25). In reality, myelin comprises -50% of spinal cord white matter and undergoes morphologic changes during injury and repair (6). The goal of the current work was to develoo a means of aeneratinc models of realistic morphology from histologic images. &
METHODS
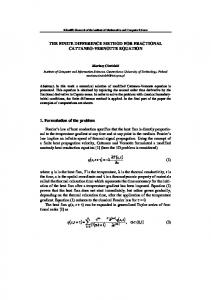
A 3D hopscotch FD algorithm was applied to simulate diffusion, Only the 1D version is described, but the principles are the same. In the 1D forward time centered space (FKS) finite difference model, the diffusion equation is approximated by discretizing time and space (7): C”+l I - c”t = Dci-ln - 2c: + c:;, r11 At A.2 ’ where D (cm*/s) is the diffusion coefficient, c is concentration, At is the duration of a time step, and Ax is the distance between spatial grid points. The superscript II and subscript i indicate the time step and the node. To simplify the notation, consider the concentration at node 1 shown in Fig 1:
PI 4” =%4con +L& +(1- s+o-bz~; where the coefficients s,,~--DAt/Ax* are jump probabilities that represent the fraction of particles at node a that travel to b during a time step. The hopscotch algorithm is related to the FTCS method but is unconditionally stable and obviates the need for temporary storage of concentrations while updating. CO Cl c2 FIG. 1, A one-dimensional finite a difference grid showing 3 nodes. b 0
Ax
1
2
To simulate the MR signal, the concentration c in the previous equations is replaced by M, and M,,, components of the transverse magnetization. After the diffusion step, the phase is incremented for any time step during which gradients are applied. An exponential decreasein magnetization due to relaxation completes each time step. A Stejskal-Tanner pulsed gradient spin echo sequencewith rectangular pulses was simulated. Myelin, which consists of multiple layers of fused plasma membrane, may be modeled as a series of permeable layers. Diffusion parallel to the layers may be characterized by a diffusion coefficient, D,. The effective diffusion coefficient in the n direction, when the surface normal of the layers is at an angle 6’.is thus: t31 +k$!!+-& ciix ,;iycr m The thickness and permeability of each layer are a=- 0.01 ,um (8) and P,,,=-0.01 pm/ms (9). The simulation was first validated with analytic expressions for diffusion between parallel planes (separation w = 30pm) and for diffusion within a sphere (R=14 pm) (12). Diffusion in rat spinal cord was simulated on the basis of a digitized light microscopic image (Fig 3a). Pixels were classified as intracellular fluid (ICF), extracellular fluid (ECF), or myelin using regional thresholds. FD models were generated by placing grid points in voxels of the segmented image. To minimize computer memory requirements, pixel size was increased to 0.32x0.32 pm’ and 0.64x0.64pmZ. A 3D grid (0.64x0.64x1.28~m3) was generated by replicating the 2D slice. Time steps were 0.01 ms and
Proc. Intl. Sot. Mag. Reson. Med. 8 (2000)
762
of Radiology,
Philadelphia,
Pennsylvania
0.04 ms for the high and low-resolution grids. Values forT, in myelin, ICF, and ECF were set to 10 ms, 76 ms, and 215 ms (10). The ICF diffusion coefficient was set to -1 pm’/ms (11) and the ECF coefficient was assumedto be that of free water (2.5~m’lms). The parallel diffusion coefficient of the myelin sheath, D,, was assumedto be that of the ICF. Simulations were performed with TE = 43 ms, 6 = 5 ms, and A = 20 ms for comparison with the experimental measurements(12). ADC’s were obtained by simulation with diffusion gradient strengths of 0, 6, and 12 G/cm. RESULTS
There was excellent agreement with analytic expressions (Fig 2). ADC’s obtained in the rat spinal cord model (Fig 3) with the gradient perpendicular to the axons, were 0.26 ,um’/ms and 0.29 pm’/ms for the high and low resolution simulations. An ADC of 1.47 pm*/ms was obtained for parallel diffusion. The ADC’s obtained by simulation are similar to experimental values (0.99 pm’/ms parallel and 0.21 pm’/ms aernendicular) in lateral column white matter of rat spinal cord (14).
FIG. 2. Evaluation with analytic solutions for diffusion between planes (a, D=2.0 pm’/ms, 6 = 0.05 ms, G, = 0.04 Gauss/pm, h = 1 pm, At= 0.5 ms) and diffusion in a sphere (b, D=2.0 /.rm*/ms,A = 100 ms, 6 = 0.05 ms, lpm spacing, At= 0.1 ms).
a
0.0
0.2
0.4
b (m&m 2 ) b C FIG. 3. Simulation of diffusion in the rat spinal cord: (a) digitized light microscopic image (256x256, 0.16x0.16pm2 pixels) of a section of rat spinal cord; (b) segmented image; and (c) MR signal versus b for diffusion gradients perpendicular (G, ) and parallel (Gz) to axons. CONCLUSIONS
The method provides a means of investigating how changes in tissue parameters (e.g., axonal and myelin morphology, membrane permeability, and diffusion coefficients) influence ADC’s. An understanding of this relationship may allow predicting loss of neural function in pathologic states and monitoring recovery during therapy. (1) Schwab ME, Bartholdi D. Physiol Rev 1996; 76:319. (2) Ford JC, Hackney DB. MRM 1997; 37:387. (3) Szafer A et al. MRM 1995; 33:697. (4) Ford et al. JMRI 1998; 8:775. (5) Stanisz GJ ef al. MRM 1997; 37:103. (6) Salgado-Ceballos H et al. Brain Res 1998; 782:126. (7) Fletcher CAJ. Computational techniques for fluid dynamics 1. NY: Springer-Verlag; 1991. (8) Junqueira LC ef al. Basic histology. Stamford: Appleton & Lange; 1995. p 20-47. (9) Haines TH, Liebovitch LS. In: Disalvo EA et al., editors. Permeability and stability of lipid bilayers. Boca Raton: CRC Press; 1995. p 123-136. (10) Balinov B, et al. JMR A 1993; 104:17. (11) Stewart WA et al. MRM 1993; 29767. (12) Ford JC et aZ.‘MRM 1994: 31:4X8-94.