Algorithms 2014, 7, 456-470; doi:10.3390/a7030456 OPEN ACCESS
algorithms ISSN 1999-4893 www.mdpi.com/journal/algorithms Article
A Fovea Localization Scheme Using Vessel Origin-Based Parabolic Model Chun-Yuan Yu 1,2, Chen-Chung Liu 3 and Shyr-Shen Yu 2,* 1
2
3
Department of Digital Living Innovation, Nan Kai University of Technology, 568, Chung-Cheng Rd., TsaoTun 542, Nantou County, Taiwan; E-Mail:
[email protected] Department of Computer Science and Engineering, National Chung-Hsing University, 250, Kuo-Kuang Rd., Taichung 402, Taiwan Department of Electronic Engineering, National Chin-Yi University of Technology, 35, Lane 215, Sec. 1, Chung-Shan Rd., Taiping, Taichung 411, Taiwan; E-Mail:
[email protected]
* Author to whom correspondence should be addressed; E-Mail:
[email protected]; Tel.: +886-4-2284-0497 (ext. 807); Fax: +886-4-2285-3869. Received: 15 June2014; in revised form: 28 August 2014 / Accepted: 28 August 2014 / Published: 10 September 2014
Abstract: At the center of the macula, fovea plays an important role in computer-aided diagnosis. To locate the fovea, this paper proposes a vessel origin (VO)-based parabolic model, which takes the VO as the vertex of the parabola-like vasculature. Image processing steps are applied to accurately locate the fovea on retinal images. Firstly, morphological gradient and the circular Hough transform are used to find the optic disc. The structure of the vessel is then segmented with the line detector. Based on the characteristics of the VO, four features of VO are extracted, following the Bayesian classification procedure. Once the VO is identified, the VO-based parabolic model will locate the fovea. To find the fittest parabola and the symmetry axis of the retinal vessel, an Shift and Rotation (SR)-Hough transform that combines the Hough transform with the shift and rotation of coordinates is presented. Two public databases of retinal images, DRIVE and STARE, are used to evaluate the proposed method. The experiment results show that the average Euclidean distances between the located fovea and the fovea marked by experts in two databases are 9.8 pixels and 30.7 pixels, respectively. The results are stronger than other methods and thus provide a better macular detection for further disease discovery.
Algorithms 2014, 7
457
Keywords: vessel origin; vessel segmentation; parabolic model; fovea; Hough transform; feature selection
1. Introduction The fovea is a small depression (about 1 mm in diameter) located in the center of the macula area of the retina [1]. Fovea detection is necessary because the grade of diabetic retinopathy depends on their distance to the fovea. Early detection and diagnosis of retinopathies decrease the risk of retinal lesion and effectively control the illness. However, due to problems of retinal image quality, such as poor contrast and physicians’ subjective observation, the diagnoses can be unstable and uncertain. Computer analysis systems for retinal images can offer an efficient and stable assistance for diagnosis. The performance of the computer analysis system is generally influenced by retinal anatomy detection. The fovea is difficult to observe, but it usually is where the diabetic retinopathy occurs. The consequence of this obvious visual structure in retinal images is that fovea localization becomes very difficult. Although a great deal of research has studied this issue, there are still many restrictions to their methods. The fovea region is always darker than the surrounding retinal tissue. Previous studies searched for it directly on retinal images. Gagnon et al. [2] located dark pigment regions to identify the potential fovea. Zhang and Karray [3] defined the fovea as the area with the lowest intensity. The foveae were identified by using matching correlation together with characteristics typical of a fovea, e.g., the darkest area near the optic disc, by Sinthanayothin et al. [4]. However, these methods face problems when the region is covered by lesions or hemorrhages. Chin et al. [5] located the fovea as the region of minimum vessel density within a search region which is defined by the anatomical priors. This method does not require parameter adjustments for different image resolution, but it relies on the quality of vessel segmentation. In the meantime, some studies utilized the location of the optic disc (OD) and vasculature features to detect the fovea. Li and Chutatape [6] depicted the major routes of the retinal vessels with 30 extracted landmark points, using them to fit a parabola for the fovea localization. Foracchia et al. [7] proposed a method for fovea localization based on the geometrical directional pattern of the retinal vascular system, which can be geometrically modeled as two parabolas with the same vertex. Tobin et al. [8] also applied this model to find the horizontal raphe of the retina, which is a line passing approximately through the OD and the fovea. Fleming et al. [9] described a method whereby an elliptic form of the major retinal blood vessels is used to obtain approximate locations, which are refined by the circular edge of the optic disc and the local darkness at the fovea. Niemeijer et al. [10] used the local vessel geometry alongside the intensity information to detect the fovea. Geometrical models are usually applied for locating fovea. However, most studies based on a parabolic model often took the center of the OD as the vertex of the parabola-like vasculature. According to observation, the ideal vertex is the entry point of the main blood vessels (i.e., vessel origin (VO)), which is beside the OD center. Therefore, a VO-based parabolic model for fovea localization is proposed in this paper. This model takes the VO as the vertex of the parabola-like
Algorithms 2014, 7
458
vasculature and finds the fittest parabola with the Hough transform. The fovea is located on the symmetry axis of the parabola with a certain distance from the VO. Some studies concerning VO detection have been presented. In order to detect vessels within OD, Goatman, et al. [11] roughly estimated VO by selecting the darkest 20% of pixels of the OD and taking the mean of these pixels as the VO. This paper modifies the algorithm presented in [12] and presents a novel algorithm of VO detection. This can be used to improve the detection of blood vessels in OD and the localization of fovea. In order to accurately extract VO from retinal images, four features based on the characteristic of VO are extracted. Then Bayesian classifier is employed to locate the VO. Meanwhile, an Shift and Rotation (SR)-Hough transform, which combines Hough transform with the shift and rotation of coordinates, is presented to search for the fittest parabola. The fovea region is eventually located with the fittest parabola which is gained by SR-Hough transform. The rest of this paper is organized as follows. The methodology of fovea detection on retinal images is given in Section 2. The experimental results are discussed in Section 3. Finally, conclusions are drawn in Section 4. 2. Materials and Methods A VO-based parabolic model for fovea localization is presented in this paper. To evaluate the performance of the proposed scheme, two available retinal databases, DRIVE [13] and STARE [14], are used. The DRIVE database contains 40 images, with 565 × 584 pixels and 8 bits per color channel. Seven retinopathy images are in this database. The STARE database consists of 81 images, with 700 × 605 pixels and 8 bits per color channel. There are 50 retinopathy images in this database, including hard exudates, soft exudates, hemorrhages and neo-vascularization images. This study excludes three images from the DRIVE database and 32 images from the STARE database, because the foveae in these images were not examined by experts. A total of 17 images from DRIVE database are chosen for training. The surplus 20 images in the DRIVE database and 25 images randomly selected from the STARE database are the tested images. The illumination correction is performed on the green band of color retinal image, followed by the OD detection and blood vasculature segmentation. Then the VO features are extracted and used for VO localization. Once the location of the VO and the blood vasculature are acquired, the VO-based parabolic model works to find the most suitable parabola, which matches the vasculature. The flow chart of this method is shown in Figure 1 and the details are described in the following subsections. 2.1. Illumination Correction Since non-uniform illumination has been a common phenomenon of images, illumination correction becomes an indispensable pre-processing of object localization. Some studies performed more thorough research of this issue [15,16], properly increasing the local contrast of the major structures in the image, which could ultimately raise the accuracy of structure identification. In color retinal images, a green channel highlights the blood vessels and the OD region. Hence, a gray level image is obtained by extracting the green channel from the color retinal image.
Algorithms 2014, 7
459 Figure 1. The flow chart of the fovea localization. Green band retinal image
Illumination correction
OD region detection
Vessel segmentation
VO feature selection
VO localization
Fovea localization Non-uniform illumination is always one of the main influences of feature selection, subsequently making OD not the brightest region and the vessels unclear. The intensity of vessels would even be higher than OD. In order to decrease uneven background intensity, an illumination-correction process described in [17] is employed. It is defined as: I ′( x, y ) = I ( x, y ) −
μ N ( x, y ) 0 .1 + σ N ( x , y )
(1)
Where I' denotes the illumination-corrected image, and I is the original gray image. μN(x,y) and σN(x,y) are respectively the mean and standard deviation of pixels within a N × N window centered at the pixel (x,y). Here, N is set as 35. The image after illumination correction is shown in Figure 2a. Figure 2. Images in gray level morphology processing, (a) the illumination-corrected image I'; (b) the vessel-removed image Ivr; (c) the image Ig after morphological gradient; (d) the circular border of the optic disc.
(a)
(b)
(c)
(d)
Algorithms 2014, 7
460
2.2. Optic Disc (OD) Localization Because the blood vessels are darker in retinal images, the gray-scale morphological closing operator is utilized on the illumination-corrected image to delete vessels and leave the OD and background complete. The coverage of the structure element b of the closing operator cannot be too big, or the retinal image will lose its original feature. On the other hand, if it is too small, vessels cannot be completely removed. Here, b is defined as a circle with 11 pixels as diameter (the largest vessel width). The image after closing is the vessel-removed image, Ivr, as shown in Figure 2b, in which the vessels were removed. Dilation operation expands objects in an image, while erosion operation makes it shrink. Their difference, referred to as the morphological gradient, emphasizes the boundaries of regions. The gradient image, Ig, can be obtained by applying morphological gradient on Ivr, as shown in Figure 2c. In order to detect the range of the OD from the gradient image, the circular Hough transform is used. Then, the circular contour of the OD is obtained. The OD diameter, which provides significant data for fovea localization in the later subsection, can be determined with this circular border. Figure 2d shows the circular border of the OD superimposing on the color retinal image. 2.3. Retinal Vessel Segmentation To get the blood vasculature, the OD and fovea (or some other background structures) should be removed. The difference between the vessel-removed image Ivr (Figure 3a) and the illumination-corrected image I' gets the crude vessel structure image Icv. In the image Icv, background and OD are no longer obvious. See Figure 3b. Figure 3. Images in retinal vessel segmentation: (a) the vessel-removed image Ivr; (b) the crude vessel image Icv; (c) the image after line detector processing; (d) the Otsu binary image Io of (d).
(a)
(b)
(c)
(d)
Based on the fact that the vessels are line-like and smooth, a line detector [16,18] is applied to the image Icv for further vessel enhancement and detection. The line detector consists of 12 oriented line segments passing through the center pixel p(x,y) of a square window. Each line is defined as the following formula,
(i − x ) sin θ − ( j − y ) cosθ = 0 where (i,j) denotes a neighbor of p, and θ = 0°, 15°, 30°,…, 165°, is the slope angle of each line.
(2)
Algorithms 2014, 7
461
The average gray level is computed along each line in a fixed length l. The line strength of the pixel p(x,y), denoted as S(x,y), is given by the difference between L(x,y) and N(x,y). Here, L(x,y) is the largest average gray level among those of 12 lines, and N(x,y) is the mean intensity of the l × l square neighborhood. The best performance would be with l =15 pixels [16]. Since vessels are darker than the background, the line strength can be use to identify whether a pixel is a vessel pixel or not. After the line detector, the Otsu algorithm [19] is used to get the binary vasculature image Io. Note that the vessel structures in images (b)–(d) of Figure 3 are highlighted and given to illuminate the effect of each step of vessel segmentation. 2.4. Vessel Origin (VO) Feature Selection According to the VO-based parabolic model, the retinal vessel origin and major blood vessels are employed to find the fittest parabola. Because main vessels stem from the VO, using the VO as the parabolic vertex can provide a better vessel structure description and fovea localization than using the center of OD as the parabolic vertex. In the meantime, the OD does not coincide with the geometric center of OD. Before VO detection, four features of VO—vessel thickness rate, vessel density, vessel radiation, and vessel average intensity described in [12]—are selected and presented in the following subsections. 2.4.1. Vessel Thickness Rate The closer the vessel is to the VO, the thicker it will be. The thickness rate of a vessel pixel p(x,y) is defined by the ratio between the numbers of vessel pixels, within a rectangle mask centered at p(x,y), on the binary vascular image Io and on the binary vascular thinned image It. The binary vascular thinned image is obtained by the common morphological thinning operator. For details, one is referred to [19]. The feature map of thickness rate FVTR is represented as the following, FVTR ( x, y ) =
wvtr ∗ I o ( x, y ) wvtr ∗ I t ( x, y )
(3)
where wvtr is an elongated rectangular mask. On account that main vessels radiate from vessel origin to the above and the below, the size of wvtr is set as r × 2r, r denoting the radius of the optic disc. Symbol “ * ” represents the convolution product. Figure 4b is the feature map of thickness rate corresponding to Figure 4a. 2.4.2. Vessel Density The vessel density of a pixel p(x,y) is defined as the number of vessel pixels within a rectangle mask centered at p(x,y). The feature map of vessel density is represented as the following,
FVD ( x, y) = wvd ∗ I o ( x, y)
(4)
Algorithms 2014, 7
462
where the size of the mask wvd is the same as wvtr in the Equation (3). Since vessels grow out from the vessel origin, vessels are concentrated around the vessel origin, and the value of vessel density in this region is larger than that in others. A vessel density map is shown in Figure 4c. Figure 4. An example of feature maps, (a) the original image; (b) the thickness rate feature map FVTR; (c) the density feature map FVD; (d) the radiation feature map FVR; (e) the average intensity feature map FVAI.
(a)
(b)
(c)
(d)
(e)
2.4.3. Vessel Radiation The vessel radiation of a pixel p(x, y) is defined as: n a FVR ( x , y ) = ti ⋅ i ai i =1
(5)
Where n denotes the number of neighbors in the mask region centered at p(x, y). ti denotes the vessel a flux through the ith neighbor, which is tangent to the vessel segment. i is the vector from the ith neighbor to the center of mask region. ai = ai a t i i and ai / ai means the of vector (i.e., ). The dot product of ai is the magnitude t a i component of in i direction. In Equation (5), size of the mask is r × 2r, r denotes the radius of optic disc, and n equals 2r2. The radiation is calculated to get the radiation image FVR, as shown in Figure 4d. The gray level amount in the image FVR is the value of the radiation feature. The vessel radiation of a pixel p(x,y) represents the radiating level of blood vessels which emit from p(x,y). As retinal vessels grow out from vessel origin, vessel radiation around vessel origin is always higher. 2.4.4. Vessel Average Intensity The vessel average intensity of a pixel p(x,y) is the average gray level in a 5 × 5 window centered at p(x,y). To get this mean feature map FVAI, as shown in Figure 4e, the average value is calculated with the illumination-corrected image I'. The intensity around vessel origin would be darker because of the vascular structure around it.
2.5. VO Localization Since the Bayesian classifier is robust against retinal lesion in the images of the training set, it is chosen for retinal vessel origin detection. Pixels are classified into two classes, vessel origin (VO) and
Algorithms 2014, 7
463
non-vessel origin (NVO). The pixel with the maximal average likelihood ratio of a posteriori probabilities is chosen as the vessel origin. This is described in detail in the following. Based on the four features mentioned in the previous subsections, each pixel is associated with a multivariate feature vector x. The multivariate Gaussian density function is used to model the conditional densities [20], which are given as: p (x | CVO ) = p (x | C NVO ) =
1 (2π ) 2 ΣVO
1/ 2
1 (2π ) 2 Σ NVO
1/ 2
1 −1 × exp [− (x − μVO )t ΣVO (x − μVO )] 2
1 1 × exp [− (x − μ NVO )t Σ −NVO (x − μ NVO )] 2
(6) (7)
Where ΣVO and ΣNVO are covariance matrices, and μVO and μNVO are the population mean vectors generated from the training data set for classes VO and NVO, respectively. On the basis of the Bayes rule, the well-known likelihood ratio of a posteriori probabilities is defined as follows [8]: Rllh (x ) =
p (CVO | x ) p ( x | CVO ) ⋅ p (CVO ) = p (C NVO | x) p ( x | C NVO ) ⋅ p (C NVO )
(8)
Where p(CVO) and p(CNVO) denote the a priori probabilities of VO and of NVO, respectively. Accordingly, the likelihood ratio function Rllh builds a confidence map, denoted as FC. The VO location (h,k) is defined as the point (x,y) having the maximal average confidence value. This is presented as the following:
(h, k ) = arg max ( w ∗ FC ( x, y ) )
( x, y )
(9)
Where w is an r × r mean filter, and symbol “ * ” represents the convolution product. Here, r is the radius of optic disc.
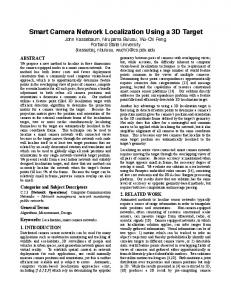
2.6. Fovea Localization The main retinal vessels distribute as a parabolic curve, and the symmetry axis of retina vasculature passes through the VO. The fovea lies on the symmetry axis in a distance of 2.5 OD diameters away from the VO [6,21]. Here, a Hough transform is employed to search for the fittest parabola and symmetry axis of the retinal vessel. In order to reduce the dimension of parameter space of Hough transform, the origin of the coordinate system is shifted to the VO, and then the coordinate axes are rotated about the VO. Therefore, an SR-Hough transform is proposed, which combines the Hough transform with coordinate transformation. In the meantime, to speed up the process of the Hough transform, the small vessels of vasculature on the binary vessel image Io are pruned by the morphological opening processing before applying the SR-Hough transform. A coordinate transformation integrating the shift and rotation of coordinates is performed. As shown in Figure 5, a Cartesian coordinate system, denoted by x-y and originating at the upper-left
Algorithms 2014, 7
464
corner in the image, is given. A second Cartesian coordinate system, denoted by x'-y', is obtained by shifting the origin of the x-y plane to the VO location (i.e., taking it as the origin of the x'-y' coordinate system) and rotating it in a counter-clockwise direction through an angle θ around the new origin. Figure 5. (a) The proposed parabolic model; (b) the fittest parabola superimposing on the retinal vessel structure.
y' y parabol
(h, k)
x'
θ x
symmetry axis
(a)
(b)
The coordinate transform is defined as:
x′ cos α y′ = − sin α
sin α x − h cos α y − k
(10)
Where (h,k) denotes the origin of the x'-y' plane. The coordinate (x,y) is an arbitrary point relative to the x-y coordinate system, while the coordinates (x',y') are relative to the x'-y' coordinate system. After rotating through an angle α, the symmetry axis of the fittest parabola is exactly closed with the x' axis of the x'-y' coordinate system. Therefore, the fittest parabola can be expressed as the following,
y′2 = 4cx′
(11)
Where c is the focal length of the parabola. Substituting x' and y' in Equation (10) into Equation (11) leads to the Equation (12), [ − ( x − h ) sin α + ( y − k ) cos α ] 2 = 4c [( x − h ) cos α + ( y − k ) sin α ]
(12)
This parabola is utilized to estimate the parameters (α,c) with the Hough transform. In principle, the Hough transform [19] maps the points in the x-y plane to the α-c plane. All the points on this parabola have the same values of α and c in the α-c parameter space. For every vessel point in the x-y plane, let α equal to each of the subdivision value on the α-axis (here, 0≤α