A FRAMEWORK FOR ECONOMICS-DRIVEN ASSESSMENT OF DATA QUALITY DECISIONS (Completed Paper) Adir Even Ben-Gurion University of the Negev, Israel
[email protected]
Marcus Kaiser University of Augsburg, Germany
[email protected] Abstract: Economic perspectives have raised growing attention in recent data quality (DQ) literature, as studies have associated DQ decisions with major cost-benefit tradeoffs. Despite the growing interest, DQ research has not yet developed a robust, agreed-upon view for assessing and studying the link between DQ and economic outcome. As a contribution, this study proposes a framework, which links costs to the decisions made in managing the information process and improving the DQ, and benefits to the use of information-product outcomes by data consumers. Considering past research contributions, we develop this framework further into a high-level optimization model that permits quantitative assessment of cost-benefit tradeoffs, towards economically-optimal DQ decisions. We demonstrate a possible use of the proposed framework and the derived model, and highlight their potential contribution to an economics-driven view of DQ issues in both research and practice. Key Words: Data Quality Management, Metrics, Cost-Benefit Analysis, Information Process, Information Product
INTRODUCTION Data Quality (DQ) has been studied from different technical, functional, and organizational perspectives. A common theme in DQ studies is that “the higher DQ is – the better”. Poor DQ was shown to cause major damages to organizations in terms of operational failures, decreasing trust and reputation and, at the bottom line, profitability loss. Accordingly, studies often treat high DQ as the main objective, and focus on methodologies, tools and techniques for improving it. Indeed, higher DQ has clear merits from many technical, functional and organizational viewpoints. However, in this study we suggest that high DQ should not necessarily be the only objective to consider when evaluating DQ decisions. When economic aspects – such as the benefits gained from high-quality data versus the cost of improvement – are taken into account, higher DQ is not necessarily better. This argument has been supported by recent DQ studies that have shown the criticality of economic aspects in assessing DQ decisions. When targeting high DQ alone as the ultimate end, while ignoring economic aspects, the decision outcome might turn out to be a significant damage to profitability, or even a net loss. This is particularly true with the immense growth in the volumes of data that organizations manage, which implies higher costs due to the need to increase investments in ICT and DQ improvement efforts. This study argues that DQ decision-making must recognize and consider economic outcomes, as costbenefit tradeoffs are often significant in that context. Further, it suggests that economics-driven assessment requires establishing a quantitative link between DQ decisions and economic outcomes. As a contribution, this study proposes a framework for assessing economic tradeoffs in a DQ decision process. Following previous research, the framework observes data environments as multi-stage processes with information-product outcomes. The framework links economic benefits (conceptualized as utility) to the use of information products, and costs to the production process and DQ improvement efforts. The
framework is further developed into a microeconomic model that permits quantitative assessment of DQ decisions, based on maximizing the net-benefit – the difference between utility and cost. The framework conceptualizes DQ management as an ongoing cycle of definition, measurement, analysis and improvement. We use it first to develop a model for optimizing the net-benefit within one such cycle and, afterwards, we extend the model to address a sequence of several cycles. We suggest that adopting such a framework will introduce economic thinking into to the design of real-world DQ management processes, and can also guide future research of DQ economics. We next describe the proposed framework and its different components. While laying out the framework, we also highlight previous DQ studies that had influenced our thinking. Quantitative analysis done in some of those studies also had impact on the development of the microeconomic model that we introduce in the following section. We first introduce the model at a high level, and then demonstrate a possible use of it in a specific DQ decision-making scenario. To conclude, we state the contributions of this study, highlight its limitations, and propose directions for future research.
BACKGROUND - A FRAMEWORK FOR ECONOMIC ASSESSMENT OF DATA QUALITY DECISIONS
Analyze
Define
This section lays the foundations for a framework for an economics-driven assessment of DQ decisions (Figure 1). The framework adopts two premises of the Total Data Quality Management (TDQM) approach [18]. First is the notion that a data environment can be conceptualized as a complex multi-stage information process, which transforms raw material – data retrieved from different sources – into information products, used by data consumers. Our framework attributes economic benefits to the use of information products, and costs to the implementation and the maintenance of an information process as well as to managing the quality of the data stored in the data resource. Second is the argument that DQ improvement is not a one-time effort, but rather an ongoing cycle of incremental improvements. The acts of identifying, quantifying, and analyzing economic tradeoffs are linked to the different stages of this cycle, as well as the actions taken towards improving net benefits.
Figure 1. A Framework for Assessing the Economics of Data Quality
Data Resources and Environments Data resources are often viewed as the “raw material” for information and knowledge [1]. For the purpose
of developing our framework, we define a data resource as any structured, electronically-stored collection of data items. DQ improvement can refer either to the design of the data resource and the systems that manage it (quality of design) or to the quality of the data stored within (quality of conformance) [15]. A common model for storing structured data resources is the tabular dataset – a two-dimensional model that represent a data collection as multiple records with similar attribute structure. Tabular datasets underlie the popular RDBMS (relational database management system) technology, and their design may introduce significant cost-benefit tradeoffs [7]. The analytical model that we develop later relates to data stored in a tabular dataset; however, the economic-assessment framework that we introduced in this study is not limited only to that form of data storage. To manage data resources, organizations invest in data environments that include repositories for storing data resources, applications for processing them, and tools for analyzing and delivering them to data consumers. In these environments, we differentiate between two high-level components, which are described next: (a) Information Product – the outcome generated from data resources, used by data consumers; and (b) Information Process – a collection of processing stages that feed and update the data resource. From an economic perspective, the former can be associated with the benefits gained from investing in data environments, while the latter can be linked to the DQ cost. Information Products and Utility Data resources generate economic benefits through usage by data consumers. The outcomes of data environments, which are generated out of the data resource, have been termed as information products [18] – e.g., reports, datasets, business analyses, and other forms of data integration and presentation. The benefits gained from the use of information products has been conceptualized as utility [3, 7] which, in this study, is measured monetarily. Utility contribution of data resources can be gained through their integration into business processes such as tracking stages in the supply chain or managing customer contacts. Utility can be also gained when data resources are used for business analysis and decision support – in which case, the utility has been conceptualized as the difference in gains between the outcomes of making the decisions without data resources being available, versus the outcomes of making the decision with data-resource support. A third possible form of gaining utility from information products is using them as a commodity. This is often done by data vendors that specialize in delivering data to other firms. The utility of information products degrades with lower quality and, as data resources are the raw material for information products, the utility might be significantly damaged by a lower quality of data resources. Information Process and Costs The collection of ICT (information and communication technology) infrastructure and applications that helps generating and updating the data resource has been conceptualized as a multi-stage information process [18]. Such a process may include stages of data acquisition (e.g., via manual and/or automated processes), processing (integration of data from multiple sources, error cleansing, and/or transformation into usable formats), storage in permanent or temporary databases, retrieval and delivery to consumers. The above activities are associated with different types of costs [5], as implementing and managing data environments require certain investments, which are often high. Data acquisition costs, for example can be associated with the ICT infrastructure for data collection, and/or labor required for data entry. Data processing solutions may involve purchase of software and associated customization. Storage requires investments in servers and disk space, database management systems (DBMS), as well as database design and administration efforts. Delivery costs may include the purchase of reporting and Business Intelligence (BI) tools besides programming and administration expenses.
The Data Quality Improvement Cycle The TDQM approach suggests that quality management in data environments can be viewed as an ongoing improvement process, containing cycles of definition, measurement, analysis and improvement
stages [18]. We next discuss how these stages can be linked to economic assessment of cost-benefit tradeoff, suggesting that once this link is established – the assessment of economic effects may provide important inputs and insights to DQ decision-making throughout the cycle. For brevity, we describe the framework as addressing quality improvement for a single data resource. This resource resides within a certain data environment that includes an information process for maintaining it, and a set of information products that are generated out of it. Obviously, many organizational settings incorporate multiple data resources, often managed in different but interlinked data environments. Our framework ought to be extended in the future accordingly. Definition The definition stage of the quality improvement cycle has to address a few important aspects – the objective, the scope, the set of actions, and a model that describes the anticipated effect of these actions. Literature commonly defines DQ as fitness to use. Hence, we see the key objective of DQ improvement as increasing the ability of data resources to satisfy the data consumer’s usage needs. It has been suggested that fitness to use can be assessed along different dimensions – each reflecting a different type of quality defect and/or a different reduction in the ability to use data adequately. However, perfectly satisfying the data consumer’s needs (and thereby maximizing fitness to use) is often not the best alternative from an economic perspective. Hence, some studies have suggested that the notion of fitness to use must consider the maximization of economic outcomes as an important objective of DQ improvement efforts. Ballou and Pazer [2, 4] propose utility as a measure for the value gained from data resources. Using utility as an objective, they develop methodologies for assessing DQ improvement tradeoffs. Even et al. [7] suggest the net-benefit, the difference between utility and cost, as an objective for assessing design decisions in data environments, where the targeted DQ level is among these decisions. Heinrich and Klier [14] consider a multi-period problem of investing in DQ improvement efforts, and therefore use the net present value which results from such investments as the objective to be maximized. Adopting these previous views, we assume that DQ decisions affect economic outcomes, such as utility and cost, and see the net present value as the objective of DQ improvement efforts. Three possible avenues for improving DQ have been proposed [16], each highlighting a different scope of quality improvement efforts: (a) Design: data environment can be built from scratch, or comprehensively redesigned, to better manage data at a high quality – for example, by embedding controls in processes, supporting quality monitoring with metadata, and improving operational efficiency. A robust design can help eliminate root causes of defects, or greatly reduce their impact. (b) Process Improvement: within an existing data environment, improvement efforts may target certain stages of the process, monitor them more closely and reconfigure them to reduce hazardous effects on DQ, and (c) Error Correction: quality improvement efforts may focus on the data resource itself – attempting to detect quality defects and use different cleansing and error-correction methods to fix them to an extent. The first two approaches can be seen as proactive [15] – they aim at influencing the quality of data to be acquired in the future. In contrast, the latter one can be viewed as reactive – trying to improve the quality of data already stored in the data resource (e.g., with data cleansing actions like correcting data). In this study, we suggest that economic thinking can be applied to both proactive and reactive DQ improvements. Depending on the scope of DQ improvement, one has to define a set of DQA – Data Quality Actions. Certain DQA are proactive in nature; hence are more likely when the scope is designing the data environment, or certain stages within it. If for instance an attribute is added to an existing entity in a database, not only the data resource has to be adapted, but also the information process, as the values for the corresponding attribute must be generated. Moreover, the new attribute values will be used in information products; hence, they will require adaptation as well. Even et al. [8] associate utility-cost tradeoffs with certain choices of ICT platforms in a data warehouse, which affect the quality of data resources that it manages. Design decisions in a tabular dataset – such as the time span covered and the set of attributes included – associated with economic outcomes [7]. In contrast, certain DQA are reactive in nature, as they leave the design unchanged, but rather attempt to improve the quality of the values
already stored in the data resource. For instance, Heinrich et al. [13] seek to improve the benefits gained from a mailing campaign by updating the customers’ address data. Finally, the definition stage has to assess the anticipated effect of each action. When putting this assessment in economic perspective – we propose that each action may affect both utility and cost. Generally, it is reasonable to assume that higher DQ leads to higher utility but, at the same time, also requires greater investments; hence, implies higher cost. We suggest that, at the definition stage, such anticipated effects can be represented in a form of a parameterized model that links DQA to economic outcomes (in the following section we propose a high-level model that can serve this purpose). Such an econometric model directs the evaluation, and can later be enhanced and elaborated, as the evaluation proceeds. The development of such an econometric model requires a definition of (a) Input, in the form of a set of design and/or configuration characteristics describing one or several DQA, which are the subject for decision. (b) Output, in terms of economic outcomes such as utility, cost, and net-benefit, and (c) Effect-Mapping, a quantitative formulation that links inputs to outputs, towards assessing the possible effect of the different DQA. Such an approach has been applied in a few studies, for instance, in some that develop utility-driven models for assessing tradeoffs in targeting high DQ level along different dimensions [2, 4]. Heinrich et al. [13] analyze the relationship between costs, benefits and DQ for the case of a mailing campaign in the field of customer relationship management. Even et al. [7] develop a decision model for optimizing a tabular dataset, which links design decisions such as attribute selection and the targeted DQ to economic outcomes. Measurement To permit the use of the parameterized model for assessing DQA and choosing the optimal among them, certain measurement activities will be required. When considering the existing quality level as the input to an econometric model and the resulting quality level as the output, a key question is how to measure quality level. DQ measurement has been addressed by a plethora of DQ studies, which identified a set of dimensions along which quality can be assessed (e.g., completeness, accuracy, and currency), and proposed different methods for measuring them (e.g., [6, 9, 10, 17]). Further, studies have differentiated between impartial DQ assessments, driven by rates of defects in the data resource versus contextual assessments, which evaluate quality within a context of use. The differentiation between impartial versus contextual quality measurement can be linked to the utility of data [6], where DQ measurements that are driven by the presence of defects reflect impartial assessment, while DQ measurements that are driven by the impact of defects on utility are contextual in nature. Besides measuring the current level of DQ, the measurement stage must also estimate the costs and utilities associated with the DQ level, and the effect of the different DQA on these model outputs. To map the effect as determined in the definition stage, one has to estimate the model’s parameters, using appropriate statistical parameter-estimation methods. Whereas the model describes the effects for all possible parameter constellations, measurement fixes most of the parameters. A plethora of parameter estimation methods has been discussed in literature (e.g. [16, 19]). Heinrich et al. [13] provide an example for such parameter estimation; they assess the quality of the customer address data stored in a data resource by means of a currency metric, determine cost resulting from buying up-to-date addresses from an external provider and derive the utility in terms of expected additional profits. To compute the latter, the authors rely on historical success rates of similar campaigns which are determined according to the currency of customers' address data. In many other cases, determining cost and utility may not be as straightforward as in the given instance. Nevertheless, assessing DQ, costs and utilities is crucial for an economic management of DQ in business environment, as these are essential input factors to the decision model. As estimating economic outcomes might turn out to be complex, further research in this area is required. Analysis and Implementation After defining the model and the DQA, and measuring the model’s inputs, outputs, and parameters –
some analysis will be required to assess the different alternatives and choose the subset of DQA that should be taken. As discussed by [7] an econometric model that maps design and configuration characteristics to economic outcome is an optimization model in nature, in which the optimization objective is to maximize net-benefits (the difference between utility minus cost) or in case of a multiperiod model, the net present value. We can use a model as such to assess what DQA should be taken and to which extent such that economic outcomes are optimized. An optimization model would help evaluating utility-cost tradeoffs between the different DQA from a set of alternatives, and identifying the optimal subset. Obviously, it may turn out, that none of the candidate DQA should be selected, as the resulting benefits from a higher DQ do not justify the associated costs. Even et al. [7] provide an illustrative example for a model in which utility and cost grow to a certain power with higher DQ, and show that such a model can be used for optimizing the targeted DQ level. In certain cases, the optimum can be determined by a closed-form solution, while other cases will require a numerical approximation. The example of a mailing campaign in [13] segments the customers according to the currency of their address data stored in the data resource. Then it is analyzed for which segment updating customer address data provides positive net-benefit, i.e. are the expected additional profits higher than the costs for buying addresses. It turns out, that this holds only for a relatively small fraction of the customers. Besides DQ, cost and utility, the optimization models may need other inputs as well. For instance, the model proposed by [14] relies on a parameter, which expresses a customer's reaction to DQA in order to determine the resulting utility. Such parameters are determined using statistical analysis of historical data. Once the optimal extent of DQA has been chosen, the corresponding actions have to be implemented in order to improve DQ and to realize the corresponding benefits. After improvement actions took place, one must verify the extent to which the intended improvement, as predicted by the models, was indeed realized, as the actual DQ level, cost and utility (a posteriori) may differ from the estimated ones (a priori). The differences can then be used to predict the effects of a DQA more precisely in the next iteration of the cycle. For example, after the addresses for the identified customers segments had been bought, Heinrich et al. [13] examined whether the results of the metrics for currency were a good indicator for the probability, that the customer addresses are up-to-date. It turned out that the percentage of customer addresses predicted to be up-to-date was indeed very close to the actual one. When entering a cycle of DQ improvement – one must consider the cost involved in implementing the cycle. All cycle stages require time and labor, and may involve some cost – defining the cycle, measuring and estimating the different model components, running the analysis and, obviously, the implementation of the chosen DQA. These costs depend substantially on the improvement’s scope – when the scope is large, the cost of implementing the DQ improvement cycle is likely to be high; hence, utility-cost tradeoffs should be assessed more carefully.
AN ECONOMICS-DRIVEN MODEL FOR OPTIMIZING DATA QUALITY To develop our framework further, we now suggest a high-level microeconomic model, which links DQ design and configuration decisions to economic outcome in a quantitative manner and permits evaluation of alternative DQA towards identifying an economically-optimal action. We then demonstrate an enhancement to the baseline model, which addresses a specific DQ decision scenario. As outlined earlier, the task of setting up the model is part of the definition stage. Focusing on an economics-driven objective, we aim at setting up a general model independent from a particular set of actions or scope, so that it can be used as a guideline/pattern for deriving a specific model for a DQ management problem in practice.
The Baseline Model Our model is based on several assumptions we will state in the following paragraphs. These assumptions set the boundaries of the model (definition stage) and reveal the necessary parameters that have to be determined (measurement stage). Finally, the model defines the objective function which is then used to examine the economic outcomes of different DQ improvement extents (analysis stage). Implementing the DQA is done afterwards, based on the analysis results (implementation stage). First, we develop the model for a single iteration of the decision cycle. We later extend it further to a multiple iterations (or, periods), indexed by [t]. Assumption 1 sets certain boundaries to the model, by first defining and limiting the subject of DQ improvement efforts: Assumption 1: [Data Quality Improvement] The subject for DQ improvement is a single dataset, with known size (i.e., known number of records and attribute structure), within the targeted data resource. At the beginning of period [t], the DQ level of the dataset at the end of the preceding period concerning a particular DQ dimension is known, and denoted by Qt-1∈[0; 1]. For each evaluated DQA, the subject for decision is the targeted extent of DQ improvement within period [t]: ΔQt∈[0; 1-Qt-1], where 0 reflects a decision not to improve at all, and 1- Qt-1 implies improvement from Qt-1 to the maximum possible level of 1. Incorporating these factors into the model and describing their role in it is part of the definition stage, while assessing the current values of the parameters is done during the measurement stage. DQ can be measured along different dimensions, and the choice of the appropriate dimension depends on the data usage context, and the scope of the DQ improvement. For instance, in the example given in [7], the scope is to design a new data resource, which stores customers' transaction data. The time span that the data shall cover is considered as an indicator for quality and the proposed economically-driven model can help determining the optimal time span. Linking that model to the annotations of our model, Qt-1 would be 0 and the time-span choice may vary from 0 (not storing any data) to 1 (storing the entire time span available). Considering process improvement, Heinrich et al. [13] rely on a metric for the DQ dimension consistency to measure whether the values to be entered in the data resource correspond to the so-called association rules for the particular attribute. Using this metric, the company measures the current (aggregated) consistency level of a set customer data and decides on the targeted consistency level which shall be reached by imposing corresponding association rules. The DQ improvement efforts aim at correcting outdated and therefore incorrect data concerning customers’ addresses. To do so, the currency of customers addresses is measured toward a decision on whether or not to update each. Assumption 2 addresses a typical scenario in dataset – a decline in DQ overtime when the collected data attributes no longer reflect the real-world value, as they may change over time (e.g., when a person changes marital status, address, and/or occupation or prices of a product raise or fall). Assumption 2: [Data Quality Decline] The DQ level of the dataset at the beginning of a period Qt-1 is subject to a temporal decline d indicating that – in average – d percent of the dataset become defected within period t. Incorporating the temporal decline of data into the model – as described in Assumption 2 – is done in the definition stage, while assessing the exact decline rate is task of the measurement stage. As a result of assumptions 1 and 2, the DQ level at the end of the period is Qt∈[0; 1]= (1-d)*(Qt-1+ΔQt). In case the model shall be used for design decisions, the decline rate is set to 0. The same holds for processimprovement or error-correction decisions, in cases where the dataset contains attribute values which do not become outdated (e.g. date of birth). The procedure provided by [9] can be adapted to determine d for a particular attribute based on statistical methods. Assumption 3 addresses the specific task of the definition stage to describe the basic correlation between DQ level and utility:
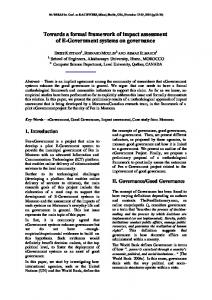
Assumption 3: [Utility] The utility Ut a company can gain from the considered dataset at the end of period t depends on the DQ level Qt. Ut(Qt) is a monotonically increasing function. If the DQ level is perfectly bad (Qt=0), the company can gain no utility from the dataset (Ut(0)=0). If the quality of the dataset is perfect (Qt=1), the utility will reach its maximum. Generally, it can be assumed that utility increases with higher DQ. However, the exact progression of the function Ut(Qt) – which is assessed in the measurement stage – depends on the given scope of the DQ improvement. In some cases, higher DQ does not necessarily increase utility - for instance, if a customer is no longer active, updating his master data does not add utility. Figure 2 depicts utility (U) progression versus the DQ level (Q), where each line reflects a different possible functionality form:
Qt
U Qt-1
ΔQ
Q 0.2 0.4 0.6 0.8 1 Figure 2. Utility gained from the DQ level of a dataset In [7], the model links the time span the data stored in the base shall cover (as a quality indicator) to utility U, assuming that older data provides lesser utility then recent data. Another example from the insurance sector with a focus on process improvement is provided by [11], which measures the completeness (as a quality indicator) of customer data stored in a database used by in insurance company. The dataset addressed is used to generate an information product – a software package used to support the process of giving financial advice to customers. The authors link completeness (Q) utility U, which they conceptualize as the sales figures of the company’s branches. Heinrich et al. [9] illustrate the effect of current (and therefore presumably more correct) customer data on utility U. In all examples, we can observe that a higher DQ is correlated with higher or equal utility (and vice versa). Assumption 4a defines the correlation between the extent of the DQ improvement and the implementing costs they incur when taking the action in the implementation stage: Assumption 4a: [Implementation Costs] Improving DQ by ΔQt incurs implementation cost CIt(ΔQt) in period t. CIt(ΔQt) is a strictly monotonically increasing function. If DQ is not improved at all (ΔQt =0), no costs incur (CIt(0)=0). If the company improves DQ to the maximum (ΔQt =1-Qt-1), cost will also reach its maximum. Generally, it is reasonable to assume that the higher is the targeted DQ improvement, the higher are the costs; however, the exact correlation has to be determined in the measurement stage. In contrast to utility, we assume that cost increase with quality is strictly monotonic (e.g., referring again to the inactive customer example, improving his data would increase costs, although it does not provide utility). Figure 3 depicts possible forms of progression of the cost function depending on Q:
CI
ΔQmaxt
Qt-1
0.2 0.4 0.6 0.8 1 Figure 3. Implementation cost incurred by DQ improvement One, for example, could assume the implementation cost to increase linearly with the number of records covered by DQ improvement efforts, as done in [7]. It is also possible to assume increasing marginal costs of DQ, arguing that DQ improvements at a low given DQ level are less expensive than DQ improvements at a high given DQ level, as done in [12]. The model proposed by [13] assumes constant marginal implementation costs of DQ, as their DQ improvement is based on buying customer addresses from an external provider at fixed cost per address in order to update out-dated data. However, this last example can also be extended to a convex cost function. As mentioned in [13], the provider can only deliver address data for a subset of customers – hence, another action would be to investigate the address for the rest of the customers by calling them one by one. This action would come along with a higher marginal cost of quality and the implementation cost function would be piecewise linear. Assumption 4b addresses possible fixed costs, which must be considered in the DQ-improvement process. Assumption 4b: [Fixed Costs] During the different stages of the decision process – Definition, Measurement, and Analysis – fixed costs occur which are denoted as CDt, CMt, and CAt (≥0) respectively. Costs of the definition stage are assumed to be relatively low, as the definition stage deals mainly with aspects such as setting the objective, the scope, the set of actions, and the model. Once the management agrees on maximizing economic performance as the objective, the definition costs involved are often low, as many companies have established measures for evaluating economic outcomes (e.g. net-benefit, net present value, etc.). The intention to improve DQ results from a particular problem the company faces. This problem is related to the data environment and thereby determines the scope of the DQ improvement: design, process improvement and/or error correction. In most cases, defining the scope alone will not incur high costs. On the contrary, identifying the possible set of DQA may turn out to be costly. Depending on the given problem and the scope, the set of actions may contain many different DQA. It is not enough to identify these actions - instead. DQA have to be defined exactly in terms of their effects on DQ and (thereby) on utility (refer to Figure 2) as well as on costs (refer to Figure 3) by setting up a corresponding model. These considerations are often subject to a detailed analysis in literature on economics-driven DQ improvement. As this research direction is relatively new, it does not offer standardized “off-the-shelf” procedures. Hence, defining the model has to be done individually for each DQ improvement project, incurring a relevant amount of cost. Measurement costs may occur in two forms: First, the DQ level itself has to be assessed. The measure for DQ level may different depending on the scope. For instance, when evaluating the design of a data resource, parameters like number of attributes or the time span covered by the data can be used as quality measures and impose relatively low costs. All three scopes have in common, that they address the quality
of data values and metrics for the DQ dimensions completeness, consistency, currency and correctness are used to assess the corresponding aspect and thereby the current level of DQ. The metrics for these dimensions differ in the costs they incur. Two aspects should be kept in mind when deciding on developing/applying a metric for a particular attribute: On the one hand, as cost for developing a metric can be significant, measuring and improving DQ of an attribute must be justified from an economic point of view. On the other hand, once a metric for completeness, consistency and currency has been developed, it can be applied several times without having it to develop again. Hence, the costs for development can be assigned to several uses. Comparatively, costs for the analysis stage are low. After measuring the relevant input parameters to the model (DQ level, parameters for Ut(Qt), CIt(ΔQt)), the model of the definition stage maps the effects of varying ΔQt on the defined objective: Assumption 5: [Company’s objective] The company would aim at maximizing the net-benefit Bt from DQ improvement, given an interest rate per period of r∈ℜ+. The net-benefit is an economic figure widely accepted for evaluating different alternatives. It was used for different DQ improvement scopes [7, 9, 11]. Moreover, the net-benefit can also be used within a multiperiodic model, which we will develop below. Based on these assumptions, we can formulate the company’s objective function for period t: Bt(ΔQt)=Ut(Qt)/(1+r)-CIt(ΔQt)-CDt-CMt-CAt Æ max with Qt= (1-d)*(Qt-1+ΔQt). Based on this formulation, the effects of different DQ levels and DQ improvements can be examined in the analysis stage. Moreover, the formula above illustrates, that – from an economic perspective – DQ level is not the objective function to be maximized; instead, it is input to an objective function which can be used to evaluate DQ improvement alternatives from an economic viewpoint.
Multi-periodic model So far, we defined a general economic model for one period which corresponds to a single iteration of the DQ improvement cycle. As DQ improvement is typically not a one-time effort, we now extend this model to address DQ improvement over several periods, by reformulating two of the assumptions stated before: Assumption 5’ (extending Assumption 5): [Company’s objective] The company's objective for maximization is the net present value (NPV) of the net benefits over T periods, given an interest rate of r>0 per period. Assumption 4b’ (extending Assumption 4b): [Fixed Costs] During the different stages of the decision process – Definition, Measurement, and Analysis – fixed costs occur which are denoted as CDt, CMt, and CAt (≥0) respectively. These costs only occur in the first period t: CDt=CMt=CAt=0 for t>1. The assumptions 1, 2, 3, 4a, 4b’, and 5’ hold for all scopes, i.e. for design, process improvement and/or error correction, as identified at the definition stage. These scopes now differ with respect to the implementation cost (Assumption 4a): Whereas costs of implementation for process improvement and error correction usually also incur in later periods, they are negligible for DQ improvement by design decisions, as design normally cannot be adapted again. Hence, for design decisions all elements of the objective function are 0 except the resulting Utility Ut(Qt). Such considerations must be given during the measurement stage.
So far, we dealt with the economic impact factors on the company’s objective from a multi-period perspective. Another time-related aspect is the size of the dataset stored in the data resource. Usually, the number of records stored a relation grows but, at the same time, some records are possibly deleted due to business transactions; hence, the size of the dataset is not constant over time. We propose to not integrate this aspect into the model for two reasons. First, aggregated DQ levels of different time periods would not be comparable anymore, as they are always related to the size of a particular dataset. Second, the utility of the dataset is also influenced depending on the utility of the data deleted or added; hence also economic outcomes are not comparable anymore. As we focus on modeling the relationship between DQ and economic outcome, we isolate the effect of DQ on economic outcome (and vice versa) and leave aside further influence variables. Assumption 6: [Size of dataset] The size of the dataset remains constant through all periods. Based on the assumptions stated above, we define the net present value (NPV) as the objective function of a company: T
NPV = ∑ t =1
Bt (ΔQt ) T ⎛ U t (Qt ) CtI (ΔQt ) − CtD − CtM − CtA ⎞ ⎟⎟ = ⎜⎜ − t +1 (1 + r )t ∑ (1 + r )t t = 0 ⎝ (1 + r ) ⎠
⎛ U (Q ) C I (ΔQt ) ⎞ ⎟ − CD − CM − CA = ∑ ⎜⎜ t tt +1 − t t ⎟ (1 + r ) ⎠ t = 0 ⎝ (1 + r ) T
When applying this formulation in real-world contexts, in which the DQ improvement cycle is implemented, it should be adapted to the specific context in the definition stage. By assessing the necessary parameters (DQ level, correlation between DQ level and utility as well as between DQ improvement and cost, fixed costs and the interest rate) in the measurement stage, the model can be used to examine the economic outcome of DQ improvement in the analysis stage. Only if the resulting NPV is positive, the DQA should be taken to the optimal extent (implementation stage).
Using the Model to Address a DQ Decision Scenario – an Illustrative Example Next, we illustrate an economic assessment of a DQ decision, using the model. Let us assume a financial service provider (FSP) firm, which plans to conduct a mailing campaign for offering private health insurance. In a former, similar campaign, the FSP addressed all of its 200,000 customers, resulting in a success rate of 5%. For each customer that accepts the offer, the FSP gets a commission of $100; hence, the overall utility is estimated at $1,000,000. The mailing costs were $3 per customer – hence, a total mailing cost of $600,000 and a net-benefit of $400,000. In the definition stage, it has been suggested to use the ‘Income’ attribute when selecting the customers that will be targeted in the upcoming campaign, where the objective is to improve performance in terms of net-benefit. A review of the former campaign results indicated that the higher is the income, the higher was the likelihood of a customer to accept the offer. Income is known only for 110,000 customers (55% of the dataset), and for those customers, the FSP determined utilities, mailing costs and net-benefit, per income level (Figure 4a).
$140,000
$140,000
$120,000
$120,000
$100,000
$100,000
$80,000
$80,000 utility
$60,000
utility $60,000
cost (mailing)
$40,000
cost (completing)
cost (mailing) $40,000
net-benefit
net-benefit $20,000
$20,000 $0
$0