When do diagrams enhance learning? A framework for designing relevant representations Jodi L. Davenport, David Yaron, David Klahr and Kenneth Koedinger Carnegie Mellon University 5000 Forbes Avenue, Pittsburgh PA 15213 Email:
[email protected],
[email protected],
[email protected],
[email protected] Abstract. Although many studies demonstrate large learning gains when instruction includes diagrams, diagrams do not always lead to improved outcomes. How can instructional designers know whether a given diagram will enhance learning? We have developed a framework of three factors that influence the effectiveness of a diagram in a particular learning situation: the learning objective, the design of the visual representation and the cognitive processing of the learner. In a randomized-design study conducted in a college chemistry class, we found that instruction that included diagrams created with this framework led to enhanced performance on open-ended transfer items compared to traditional instruction, particularly for low-performing students. We propose that a concept-based cognitive theory of multimedia learning that includes a conceptual working memory component may explain why the efficacy of diagrams depends heavily on the prior knowledge of the learner as well as the conceptual information available in the representation.
Introduction Many laboratory-based studies have demonstrated large learning gains when instruction includes both diagrams and verbal descriptions. Gains have been reported in domains as diverse as brake systems, lightning formation, pulleys, bicycle pumps, and the circulatory system (Ainsworth & Loizou, 2003; Hegarty & Just, 1993; Mayer, 2003). The learning benefit from the presence of text in addition to pictures is particularly significant when measured by tests of problem-solving transfer. Mayer refers to this enhanced learning as the multimedia effect (Clark & Mayer, 2003). While many studies have findings consistent with the multimedia effect, the mere presence of diagrams does not guarantee increased comprehension. For instance, seductive details that are interesting but irrelevant, such as a football helmet struck by lighting, may detract from learning about the process behind lightning formation (Harp & Mayer, 1998). The coherence effect suggests that pictures only help if they are relevant to current instruction and exclude interesting but extraneous information (Clark & Mayer, 2003). Do relevant pictures always help? The coherence effect demonstrates that off-topic but interesting pictures can hurt learning. However, even seemingly relevant pictures may fail to provide the large learning benefit demonstrated in studies of the multimedia effect. For instance, Davenport et al. carried out a series of randomized-design studies in chemistry classrooms to test whether molecular-level diagrams would enhance conceptual understanding of chemical equilibrium (Davenport, Klahr, & Koedinger, 2007). Molecular-level diagrams were considered to be highly relevant by the course instructor and similar diagrams had led to better performance in other classroom studies (Kozma & Russell, 2005). Two versions of a tutorial on equilibrium and acid base chemistry were constructed. The tutorials had identical text and differed only in the presence of molecular-level diagrams. Learning was measured by multiple choice questions, interactive problem solving and open-ended transfer assessments. Although students made significant pre-to-posttest learning gains, students that received instruction that included diagrams performed no better than students in the text-only condition. Why did relevant diagrams fail to promote learning? A verbal protocol study conducted by Davenport et al. suggested that molecular-level diagrams promoted shallow learning strategies (Davenport, McEldoon, & Klahr, 2007). In this study, participants self-explained a tutorial on acid base chemistry that either contained diagrams (Diagram+Text condition) or identical text with no diagrams (Text Only condition). Consistent with prior work on self-explanation (Chi, Bassok, Lewis, Reimann, & Glaser, 1989; Chi, Deleeuw, Chiu, & Lavancher, 1994), self-explanations in the Text-Only condition were positively correlated with transfer performance. Surprisingly, in the Diagram+Text condition self-explanations were negatively correlated with transfer. That is, the more self-explanations, the lower the transfer test performance. An in-depth analysis revealed that participants in the Diagram+Text condition were less likely to produce deep, causal selfexplanations and made a greater number of statements that mapped surface features of the diagrams to the text. In both studies there were highly significant learning gains from pre to posttest, so it was unlikely that a ceiling effect masked a learning benefit of diagrams. As findings suggest that some diagrams may support superficial learning processes, how can we predict whether a given diagram will enhance learning? Molecular diagrams are certainly relevant to learning about
molecular processes: it is unlikely that the failure was due to the presence of blatantly extraneous information or seductive details (Harp & Mayer, 1998). Therefore, other factors must be considered to determine whether and when a particular representation will enhance instruction.
Models of multimedia learning Current models of multimedia learning fail to offer specific guidance to instructional designers about how to select pictures that will enhance learning in a specific context. Two prominent models of multimedia learning by Mayer and Schnotz share three main assumptions: dual-channel processing, limited capacity working memory, and active processing as a requirement for learning(Mayer, 2005; Schnotz, 2005). The dual channel assumption is that modality influences how information is processed in the brain because there are separate channels for processing auditory/verbal information and visual/spatial information. The limited capacity assumption is that working memory, which is divided into visual and verbal subsystems, can only process a limited amount of information in a given channel at a given time. The final assumption of both models is that active processing is required for information to be consolidated into long term memory and learning to occur. That is, information must be actively selected, organized and integrated with prior knowledge. Although the two models of multimedia learning largely overlap, they differ in their hypotheses about the construction of mental models. The key difference in the models is whether integration of information from multiple modalities occurs before or after the information is structured. Mayer proposes that a pictorial and verbal mental model are created independently then integrated, whereas Schnotz proposes that a single, integrated mental model is created that takes into account both pictorial and verbal content. While the current theories offer plausible explanations of how text and diagrams may be processed and integrated in general, they do not offer an explanation of why the processing of a given diagram would lead to more effective learning than the processing of some other diagram. Thus, the models are not able to offer concrete guidelines for creating diagrams that are likely to enhance learning.
Three considerations for effective diagrams Although current models of multimedia learning do not specify what features of diagrams lead to relevance and enhanced learning, many research results in the literature of multimedia learning and visual perception suggest key factors for instructional designers to consider when selecting diagrams. We propose a framework that uses three factors to determine the effectiveness of diagrams, based on a review of research findings. To determine whether a particular diagram will enhance learning, instructional designers must consider the interplay of 1) the specific learning objectives 2) how the diagram makes key information salient and 3) the learner’s cognitive processing and prior knowledge.
Specific Learning Objectives The first consideration for any instructional design is the specific learning objective. What is the explicit goal of instruction? What is the correct mental model that you want students to construct? For example, if the goal of instruction is to develop a mental model of a mechanical system (such as a bicycle pump), the learner must identify the parts of the system and the causal relationships between these parts. In this case, the mental model of a bicycle pump is a mental reenactment of the process of air being pushed through the pump. A diagram or series of diagrams likely enhances the development the mental model because the pictures may graphically constrain the interpretation of ambiguous language, e.g., what type of “valve” is pushed down and what does it look like (Scaife & Rogers, 1996). When instruction involves more abstract concepts, the learning objectives or desired mental model may be more difficult to specify. A study by Schnotz and Bannert (2003) demonstrates the importance of identifying specific target knowledge as different representations may lead to the creation of different mental models. Schnotz and Bannert (2003) tested whether the type of diagram influenced students’ mental models of time zone. Participants were given instruction that either included a “circle diagram” depicting the earth from the north pole or a “carpet diagram” that depicted a flat, rectangular map of the earth. Both diagrams were clearly marked with time zones and geographic features. Participants developed mental models of time zones that reflected the surface properties of the diagrams they viewed. At test, those in the “circle diagram” condition performed more accurately on questions related to circumnavigation whereas those in the “carpet diagram” condition performed more accurately on questions related to time zone differences. Thus, instructional designers must make a conscious decision about the structure of the mental model they would like to convey based on the types of tasks the learner will perform in the future.
Design of the Diagram The second consideration is how does the design of a diagram effectively guide attention to important information? Every representation makes certain aspects of the represented world salient while suppressing
other details. For instance, black and white line drawings typically make the parts and overall shape of an object salient but suppress details about color and texture. If the parts of a mechanism are important to instruction but the color is irrelevant, black and white line drawings may be more effective than color. In addition to the Schnotz and Bannert (2003) study mentioned above, a number of researchers have found that learning benefits depend on the alignment of instructional goals with diagram features (Ainsworth, 2006; Goldman, 2003; Larkin & Simon, 1987; Schnotz & Bannert, 2003). For instance, Hegarty & Just (1993) found that diagrams of pulley systems enhanced learning for kinetic information but not for configurational information. Another consideration when designing diagrams is to determine the role that the representation plays in providing important information. Ainsworth’s DeFT framework (2006) proposes the existence of three functional types of multiple representations: 1) complementary representations that support different learning processes or provide different information, 2) constraining representations that provide concrete examples to clarify and disambiguate language and 3) representations that support the construction of deep understanding that encourage the development of more abstract concepts. The role that the diagram plays may influence what surface properties of a diagram are relevant for a given instructional goal.
Cognitive Processing of the Learner The final consideration is the cognitive processing of the learner. In order for learning to occur, the student must select meaningful information from the diagram for processing. Both general perceptual processing and specific prior knowledge influence what information people extract from a diagram. Although we have the perception that we are “seeing” what is actually there, much research in the field of visual perception suggests that we actually attend to a small portion of the world around us and that what we do see is heavily influenced by our prior knowledge. For instance, research on “change blindness” has demonstrated that people fail to notice large changes such as an object that appears or disappears or a central object that changes colors (Simons & Levin, 1997). Other research has demonstrated that expectations influence the interpretation of visual information (Davenport, 2007; Davenport & Potter, 2004). Thus, the design of a diagram is only the first step to learning, the instructional designer must also support the cognitive processes that allow the learner to select relevant information for processing. In addition to general perceptual processing considerations, an individual’s prior knowledge also influences how information is extracted from a diagram (Lowe, 1996). The learner must be able to attend to relevant features of the diagram and draw connections from what is already known to target knowledge. Some required inferences may be surprisingly sophisticated. For instance, in learning about a bicycle pump, the learner must infer that pushing down the handle of the pump would cause air to flow out of the open valve at the bottom because air is an entity that has mass and decreasing the volume of air results in greater pressure on the valve. Causal knowledge from everyday experience is required to generate a model of how the motion of one part affects another part of the pump. Studies in multimedia learning have found that prior knowledge in the domain of instruction influences the efficacy of a given diagram. Some studies have found that diagrams are particularly beneficial for learners with low-knowledge learners and may be detrimental for high-knowledge learners (Kalyuga, Chandler, & Sweller, 1998; Mayer, 1989). However, other studies have demonstrated diagrams will not be effective if the learner lacks prior knowledge that is required to understand a diagram (Petre & Green, 1993). Further, work by Butcher (2006) suggests that diagrams that are designed to support the cognitive processes required for deep comprehension may prove most effective. The level of ability of the learner and the sophistication of the diagram must be aligned if a picture is to enhance learning.
Current Study In the current study we investigated whether considering the specific learning objectives, the design of the diagrams, and the cognitive processes of the learner would lead to enhanced learning in chemistry. In prior studies, molecular-level diagrams did not enhance learning of equilibrium chemistry. In the present investigation we test whether molecular-level diagrams that were designed using the proposed framework enhance learning in a college level chemistry course. Further, as our diagrams illustrate fundamental concepts in chemical equilibrium, we tested whether these diagrams were particularly beneficial for low-performing students.
Specific Learning Objectives The learning target in the current study was an expert mental model of equilibrium systems that was derived from an expert/novice verbal protocol analysis (Davenport, Klahr, & Koedinger, 2006; Davenport, Yaron, Karabinos, Klahr, & Koedinger, 2007). Chemistry experts (faculty and chemistry graduate students) and novices (students with one year of college-level chemistry) solved equilibrium problems while talking aloud. Experts were more successful at problem solving and were also more likely to integrate chemistry concepts with algorithmic manipulations. This study revealed that experts use a conceptual framework that we call the
progress of reaction, to guide their reasoning and problem solving of chemical equilibrium systems. Experts conceptualize reversible chemical reactions as a continuum of possible states from all reactants to all products with the movement from one state to the next constrained by the stoichiometry of the chemical equation. In an analysis of introductory chemistry textbooks, Davenport et al. found that the expert mental model of the progress of reaction is not made explicit. Traditional instruction mainly consists of worked examples of quantitative problems and does not demonstrate strategies that use an expert model of chemical reactions to guide problem solving.
Design of the Diagram The key features of the expert mental model of chemical equilibrium are 1) a chemical reaction describes a continuum of possible states of a chemical system progressing from all reactants to all products, and 2) the equilibrium state will lie between the two extremes of this continuum. In order to make the expert conceptual framework explicit, we created molecular-level diagrams designed to depict states of a chemical reaction along a continuum. The diagrams depicted static states of a chemical system in which the state with maximal reactants is on the left and the state with maximal products is on the right. These diagrams differed from the molecular diagrams typically present in textbooks (and prior experiments) that presented only the initial and equilibrium states of chemical systems and omitted the full range of possible concentrations. Thus, the physical representations of the molecular diagrams were aligned with the expert mental model of chemical equilibrium systems.
Cognitive Processing of the Learner The diagrams in our study encouraged students to make the inference that the chemical equation specifies how a system may change and that conservation of mass is obeyed (that is, atoms may be rearranged, but not created or destroyed). Further, the diagrams were designed to build on prior knowledge of non-reversible reactions in which the reactions go to completion. In reactions that go to completion, starting molecules react to form new molecules, and the newly created molecules can never re-form molecules in the starting state. Based on conversations with domain experts and student interviews, we believe that students have knowledge of reactions that go to completion from prior courses. Finally, we expect that the new diagrams will be particularly beneficial for the lowest performing students. Our hypothesis is that the diagrams will provide scaffolding for the low performing students to help them construct an expert-like mental model of chemical equilibrium processes. We expect less of a benefit for high performing students who are more likely to construct the expert model from the text alone.
Method Participants 171 students (88 female, 83 male, ages 18-22) enrolled in Modern Chemistry at Carnegie Mellon University participated in this study in partial fulfillment of course requirements.
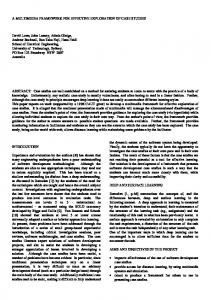
Materials Two versions of an online lecture on chemical equilibrium were created. The “traditional” version explained equilibrium concepts as they were taught the prior year and presented worked examples of problems similar to those found in textbooks. The “diagram” version incorporated molecular level diagrams depicting the expert conceptual framework of the progress of reaction alongside worked examples of problems. The instruction was delivered as a series of six short movies created with Camtasia. These movies displayed handwritten lecture notes with voice-over explanations. See Figure 1 for examples of the two types of instruction. Eleven open-ended transfer questions were interleaved with the instructional videos to assess student comprehension of equilibrium concepts. These questions asked students to synthesize information in the instruction, to reason from graphs, and to make predictions about novel chemical systems. Students were required to transfer knowledge from the instruction in order to reason about new chemical reactions and create explanations for their responses. An example of a transfer question is; “The following reaction has come to equilibrium: 2 H2S(g) + O2(g) ←→2 S(s) + 2 H2O(g). How will the addition of O2 influence the amount S? Explain at the molecular level why the addition of O2 will or will not affect the amount of S.”
Figure 1. Screen shots of Traditional (left) and Diagram (right) conditions.
Design Using class performance on quizzes and exams up to the point at which the equilibrium lecture was given, students were binned into lowest (bottom quartile), average (25th-75th percentile) and highest (top quartile) performance groups. Half of the students in each group were randomly assigned to complete the “traditional” lecture and half were assigned to complete the “diagram” lecture. After completion of the assignment all students had access to both versions of the online course.
Procedure The course was given as a homework assignment for students to complete outside of class. Students viewed the onscreen lectures and were prompted at six points during the online course to type their responses to the conceptual transfer questions. The activity had no time limit and students could take as much time as they needed to complete the activity.
Coding All responses were coded blind to condition by a research assistant. As students were not limited in the amount of information they could provide in response to the open-ended transfer question, a final score for each question was calculated as the total number of correct minus incorrect statements on each of the 11 questions. In the example transfer question given in the Materials question, a typical correct statement would be, “Since the concentration of O2 increased, the forward reaction rate is increased and the amount of S(s) produced is increased.” Typical incorrect statements for this question were; “Oxygen did not influence the amount of sulfur because the system would have decreased the amount of reactant not product,” and “Adding oxygen won't change the amount of S because it's not producing SO3 or a compound of both elements.”
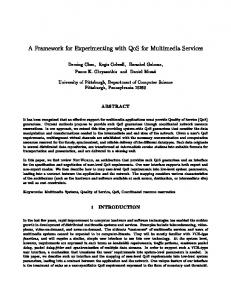
Results An ANOVA carried out with condition (traditional vs. diagrams) as the independent variable revealed a trend of higher performance in the diagram version (M = 11.0) compared to the traditional version (M = 9.7) of the tutorial, F(1, 169) = 2.58, p = .11. A planned comparison revealed that the lowest performing students in the diagram condition made more correct statements (M = 10.9) than those in the traditional condition (M = 7.73), F(1,43) = 4.05, p = .05. See Figure 2.
Figure 2. Mean final score as a function of class rank and condition (Traditional vs. Diagram).
Discussion The current study tested whether diagrams that were designed with careful consideration of the learning goals, information content of representations, and prior knowledge of students would enhance student learning of equilibrium concepts. A classroom-based, randomized assignment study suggests that instruction that included molecular level diagrams improved learning, particularly for the lowest performing students.
Conclusions We propose three factors that influence the effectiveness of instructional diagrams: the specific learning objective, how a diagram makes relevant information salient, and how the learner interprets the diagram based on his or her prior knowledge and perceptual processing. The current study demonstrates that diagrams created using this framework improve learning, particularly for low knowledge students. First, diagrams should be chosen to map to a specific instructional goal. In the current work, our instructional goal was for students to create a mental model of equilibrium systems that allowed them to make predictions and reason about reversible chemical reactions. Second, diagrams should be designed to make target knowledge explicit. In the current work, we created diagrams that mapped to an empirically derived, expert mental model of equilibrium systems. In particular, the diagrams made salient that a chemical reaction describes a range of possible states along a continuum. Finally, diagrams should consider the cognitive processing of the learner and provide a bridge from prior knowledge to the target knowledge. In equilibrium systems the processes (the chemical reactions) that cause a system to change state are simultaneous and probabilistic. Unlike mechanical systems in which students must simply animate the components in order to create a mental model, the model of an equilibrium system requires additional inferences as a number of molecules simultaneously change from state to state. In the current study we built on prior knowledge of reactions that go to completion in order to create a framework for students to understand the behavior of reversible reactions. Prior studies that investigated whether molecular-level diagrams enhanced learning failed to find a multimedia benefit (Davenport, Klahr et al., 2007; Davenport, McEldoon et al., 2007). In light of the proposed framework, the lack of the multimedia effect may have been due to the fact that the textbook-based molecularlevel diagrams were not adequately aligned with an expert model of chemical equilibrium. Our results demonstrate that diagrams enhanced learning for the lowest performing students. In fact, students in the low performing group who were randomly assigned to the diagram condition performed roughly as well as high performing students in either condition. These results are consistent with prior findings on multimedia learning that suggest a particular learning advantage for low-knowledge learners (Kalyuga et al., 1998; Mayer, 1989). The diagrams offered no additional learning benefit for high-performing students. As the diagrams targeted basic-level knowledge of equilibrium, high-performing students may have the prior
knowledge or metacognitive skills to spontaneously create expert-like mental models from information in the text-base instruction.
A Concept-based Cognitive Theory of Multimedia Learning The current study adds to the body of work suggesting that prior knowledge and the conceptual content of diagrams influences multimedia learning (Butcher, 2006; Kalyuga et al., 1998; Mayer, 1989; Petre & Green, 1993). How do current theories of multimedia learning account for such effects? Both the models of Mayer (2005) and Schnotz (2005) suggest that prior knowledge and the content of diagrams influence the active processing of multimedia instruction. However, in both models, text and pictures are processed in modality specific channels and intermediate representations reside in verbal and visual/spatial components of working memory before being integrated with conceptual information in long term memory. In contrast to current theories of multimedia learning that suggest that modality-specific processing is relatively long lasting, recent research in neuroscience suggests that multimodal information is integrated very early in processing, within 1/25th of a second (Foxe et al., 2000; Giard & Peronnet, 1999). Further, recent findings in cognitive psychology and neuroscience suggest that conceptual information from long term memory may influence what information is initially selected for processing (Davenport, 2007; Davenport & Potter, 2004; Grill-Spector & Kanwisher, 2005). In order to explain findings that the meaning of a sentence or picture influences how it is immediately recalled, cognitive psychologists have proposed the existence of a conceptual component of working memory (Baddeley, 2000; Potter, 1993, 1999). Dubbed Conceptual Short Term Memory (Potter, 1993; 1999) or the episodic buffer (Baddeley, 2000) this conceptual component of working memory integrates information from a variety of sources and maintains abstract, meaningful conceptual “chunks.” A conceptual component of working memory would likely explain the large disparities in the efficacy of diagrams on learning due to differences in individual knowledge. Thus, a conceptbased cognitive theory of multimedia learning that includes conceptual working memory may more accurately reflect the current state of research in cognitive psychology and neuroscience and expand the explanatory power of the theory to explain whether and when diagrams will help various types of learners.
Summary Relevant diagrams have the power to significantly enhance learning. However, avoiding seductive details is not enough to ensure the relevance of a particular diagram for a particular learning goal. The current study suggests that multimedia instruction that is designed to consider learning goals, the design of visual representations and learner abilities will likely enhance learning, particularly for low performing students. Further, the work suggests that current cognitive theories of multimedia learning may need to be revised in order to account for new findings in cognitive psychology and neuroscience that provide evidence for the existence of a conceptual component in working memory (in addition to auditory/verbal and visual/spatial components). The conceptual component of working memory may explain the many findings that the efficacy of diagrams depends heavily on the prior knowledge of the learner as well as the conceptual information available in the diagram. Future work will investigate how and when the interplay of the learning objectives, diagram design and cognitive processing lead to large learning gains and further develop and extend a concept-based, cognitive account of multimedia processing.
References Ainsworth, S. (2006). DeFT: A conceptual framework for considering learning with multiple representations. Learning and Instruction, 16(3), 183-198. Ainsworth, S., & Loizou, A. T. (2003). The effects of self-explaining when learning with text or diagrams. Cognitive Science, 27(4), 669-681. Baddeley, A. (2000). The episodic buffer: a new component of working memory? Trends in Cognitive Sciences, 4(11), 417-423. Butcher, K. R. (2006). Learning from Text with Diagrams: Promoting Mental Model Development and Inference Generation. Journal of Educational Psychology, 98(1), 182-19716. Chi, M. T. H., Bassok, M., Lewis, M. W., Reimann, P., & Glaser, R. (1989). Self-Explanations - How Students Study and Use Examples in Learning to Solve Problems. Cognitive Science, 13(2), 145-182. Chi, M. T. H., Deleeuw, N., Chiu, M. H., & Lavancher, C. (1994). Eliciting Self-Explanations Improves Understanding. Cognitive Science, 18(3), 439-477. Clark, R. C., & Mayer, R. E. (2003). e-Learning and the Science of Instruction. San Francisco: John Wiley & Sons, Inc. Davenport, J. L. (2007). Consistency effects between objects in scenes. Memory & Cognition, 35(3), 393-401.
Davenport, J. L., Klahr, D., & Koedinger, K. R. (2006, November). The influence of external representations on chemistry problem solving. Paper presented at the Forty-seventh Annual Meeting of the Psychonomic Society, Houston, Texas. Davenport, J. L., Klahr, D., & Koedinger, K. R. (2007). The influence of diagrams on chemistry learning. Paper presented at the Biennial Conference of the European Association for Research on Learning and Instruction, Hungary, Budapest. Davenport, J. L., McEldoon, K., & Klahr, D. (2007). The influence of molecular-level diagrams in Chemistry instruction. Paper presented at the 29th Annual meeting of the Cognitive Science Society, Nashville, TN. Davenport, J. L., & Potter, M. C. (2004). Scene Consistency in Object and Background Perception. Psychological Science, 15(8), 559-564. Davenport, J. L., Yaron, D., Karabinos, M., Klahr, D., & Koedinger, K. R. (2007). Chemical equilibrium: An evaluation of a new type of instruction. Paper presented at the Gordon Conference for Chemistry Education Research and Practice, Lewiston, ME. Foxe, J. J., Morocz, I. A., Murray, M. M., Higgins, B. A., Javitt, D. C., & Schroeder, C. E. (2000). Multisensory auditory–somatosensory interactions in early cortical processing revealed by high-density electrical mapping. Cognitive Brain Research, 10(1-2), 77-83. Giard, M. H., & Peronnet, F. (1999). Auditory-Visual Integration during Multimodal Object Recognition in Humans: A Behavioral and Electrophysiological Study. Journal of Cognitive Neuroscience, 11(5), 473490. Goldman, S. R. (2003). Learning in complex domains: when and why do multiple representations help? Learning and Instruction, 13(2), 239-244. Grill-Spector, K., & Kanwisher, N. (2005). Visual recognition: as soon as you know it is there, you know what it is. Psychological Science, 16(2), 152-160. Harp, S. F., & Mayer, R. E. (1998). How seductive details do their damage: A theory of cognitive interest in science learning. Journal of Educational Psychology, 90(3), 414-434. Hegarty, M., & Just, M. A. (1993). Constructing Mental Models of Machines from Text and Diagrams. Journal of Memory and Language, 32(6), 717-742. Kalyuga, S., Chandler, P., & Sweller, J. (1998). Levels of expertise and instructional design. Human Factors, 40(1), 1-17. Kozma, R., & Russell, J. (2005). Multimedia Learning of Chemistry. In R. E. Mayer (Ed.), The Cambridge Handbook of Multimedia Learning. Cambridge, U.K.: Cambridge University Press. Larkin, J. H., & Simon, H. A. (1987). Why a diagram is (sometimes) worth ten thousand words. Cognitive Science, 11, 65-99. Lowe, R. K. (1996). Background knowledge and the construction of a situational representation from a diagram. European Journal of Psychology of Education, 11(4), 377-397. Mayer, R. E. (1989). Systematic thinking fostered by illustrations in scientific text. Journal of Educational Psychology, 81, 240-246. Mayer, R. E. (2003). The promise of multimedia learning: using the same instructional design methods across different media. Learning and Instruction, 13(2), 125-139. Mayer, R. E. (2005). Cognitive Theory of Multimedia Learning. The Cambridge Handbook of Multimedia Learning. Petre, M., & Green, T. R. G. (1993). Learning to read graphics: Some evidence that 'seeing' an information displat is an acquired skill. Journal of Visual Languages and Computing, 4, 55-70. Potter, M. C. (1993). Very short-term conceptual memory. Memory & Cognition, 21(2), 156-161. Potter, M. C. (1999). Chapter 2 Understanding Sentences and Scenes: The Role of Conceptual Short-Term Memory. Fleeting Memories: Cognition of Brief Visual Stimuli. Scaife, M., & Rogers, Y. (1996). External cognition: How do graphical representations work? International Journal of Human-Computer Studies, 45(2), 185-213. Schnotz, W. (2005). An Integrated Model of Text and Picture Comprehension. The Cambridge Handbook of Multimedia Learning. Schnotz, W., & Bannert, M. (2003). Construction and interference in learning from multiple representation. Learning and Instruction, 13(2), 141-156. Simons, D. J., & Levin, D. T. (1997). Change blindness. Trends in Cognitive Sciences, 1(7), 261-267.
Acknowledgements Thanks to Jennifer Olsen for coding and to the members of the Chemistry working group, Michael Karabinos, Gaea Leinhardt and Jim Greeno, for helpful discussions. This work was supported by the Pittsburgh Science of Learning Center, National Science Foundation grant SBE-0354420.