Abstract--Analysis and classification of esophageal motility records were investigated using signal processing and fuzzy-set pattern recognition techniques.
Annals of Biomedical Engineering, Vol. 22, pp. 112-119, 1994 Printed in the USA. All fights reserved.
0090-6964/94 $10.50 + .00 Copyright 9 1994 Biomedical Engineering Society
A Fuzzy Pattern Recognition Method to Classify Esophageal Motility Records FATMA E.Z. A B O U - C H A D I , * F.A. EZZAT,# and A.A. SIF EL-DIN* *Department of Electrical Communications, Faculty of Engineering, tDepartment of Gastroenterology, Faculty of Medicine, Mansoura University, Egypt
Abstract--Analysis and classification of esophageal motility records were investigated using signal processing and fuzzy-set pattern recognition techniques. A set of parameters has been extracted from the raw records and has previously been used as characterizing features. Improvements to these procedures were obtained by extracting these features from processed data, and some additional parameters were developed. The new set of features was used in the design of a fuzzy classifier, and classification accuracy was estimated using the leave-one-out technique. To our knowledge, this is the first report of the application of automatic classification to esophageal motility records.
matic analysis without the participation of a human operator. We present a classification scheme based on a fuzzy set pattern recognition approach for automatic classification of esophageal motility records. Attempts for computer analysis of such records have been reported (3,4,7); however, these attempts were confined to utilizing computer capabilities to extract parameters usually detected manually by physicians. The parameters were determined from the raw data and were therefore subjected to noise and other factors that might affect their significance, especially when used for classification. Recently, Abou-Chadi et al. (1) initiated research work that provides some rational basis for quantifying the esophageal motility patterns. The methods were based on modem signal processing techniques. Preliminary analysis, such as baseline removal and filtration of unwanted artifacts, were suggested. Moreover, they reported new means for quantifying the esophageal peristalsis useful for classification purposes. The present work is an extension of the previous research (1). Its main goal is two-fold: (a) to characterize the various peristaltic waves through determination of a set of feature parameters that allow comparisons between groups of patients or between individual records and any population norms that might become available; and (b) to provide automatic classification for the different pathological cases. The classification approach taken herein involves three steps: (a) data measurement and recording, (b) feature extraction and selection, and (c) classification.
Keywords---Biological signal processing, Pattern recognition, Computers in medicine, Gastrointestinal system. INTRODUCTION The theory of fuzzy sets was founded by Zadeh (15). Its subsequent developments provide suitable mathematical techniques for analyzing complex systems and decision processes in which the pattern indeterminacy is due to inherent variability or vagueness (fuzziness) rather than randomness. Fuzzy set theory has proved itself to be of significant importance in pattern recognition problems such as automatic speech recognition (8), digital signal restoration (5), and radiographic picture processing (11). Records of biological origin usually possess recurrent patterns; however, they are affected by diseases, sex, and age, among other factors. They are also subjected to interference from other biological systems. As a result, they are, to a large extent, fuzzy in nature. There exists no precise boundary due to inherent fuzziness rather than randomness in the patterns. Therefore, using fuzzy sets makes it possible to use partially defined information as well as exact information to analyze biological signals. Recently, Arzi and Magnin (2) utilized a fuzzy set approach for automatic analysis of nystagmic eye movements. They reported that the approach permits analysis o f nystagmic eye movements with high reliability even when the data are of modest quality and it allows entirely auto-
DESCRIPTION OF THE CLASSIFIER
The basic terms of fuzzy set theory are summarized in the Appendix. The approach adopted for the design of the classifier was developed by Pal and Dutta (9,10) and is explained in detail elsewhere (8). It is a multicategory classifier based on evaluating property sets and finding the similarity vectors that correspond to different classes to identify the objects. The property p is a function, p(x),
Address correspondenceto Fatma Abou-Chadi, Mansoura University, P.O. 35516, Box 20, Mansoura, Egypt. (Received 4/20/93; Accepted 10/13/93) 112
Fuzzy Pattern Recognition Model defined on an event, x, and can have values only in the interval [0, 1]. A set of these functions, p(x), which assigns the degree of possessing some property, p, by an event, x, constitute what is called a property set. Let Pl, P2 . . . . . Pn . . . . . PN be the N properties, each of which represents some aspects of the unknown pattern, X, and has value only in the interval [0, 1], such that X = {Pl, P2 . . . . .
Pn . . . . .
PN}"
(1)
113
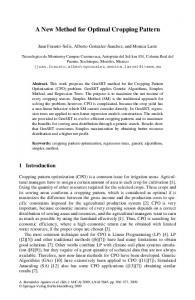
Such a classifier is shown in Figure la, where the input pattern and decision (output) of the classifier are nonfuzzy but the process is fuzzy. Preprocessed N-dimensional pattern X is applied to a fuzzy processor consisting of fuzzy property matrix {p~} for the/th prototype in class Cj. Because the output of this processor S~~ (X) = {s(.~} represents the N-dimensional fuzzy similarity vector, the nonfuzzy output, qsj (X), for Cj may be obtained from the following equation:
The elements of X are defined by the following equation (10):
% (X) = ISj (X) I
(8)
with Pn =
[
1+
3~n -- Xn
~
2'01-F~
Sj (X) = {slj, Szj. . . . .
(2)
s.j . . . . .
SNj}
(9)
where and
(0 Snj = 1 ~-~ , . , Snj l
= maxj E{x} = maxj ~jj
.
Xijn,
i = 1, 2 . . . . .
Mj,
(3)
where Mj is the total number of features, a n d Xij n represents the n th property of training samples associated with class Cj. E{x} denotes the expected value of x, and Fe and F d are constants called fuzzifiers and have the effect of altering the fuzziness in a property set. If there are h number of prototypes in a class, Cj, then for each prototype, l, there would be a reference vector, R~/):
R~l) = {p~l~, p~] . . . . .
p(l] . . . . .
p~]},
(4)
p ~ denotes the degree to which the property, Pn, is possessed by the/th prototype in Cj. It may be obtained using Eq. 2.
=
1 +
L
(5)
where x(~ is the n th property of the/th prototype in class Cj. The similarity vector Sj(1) (X) for the pattern X with respect to the /th prototype in jth class has the form S~~ (X) ={si~, S2j, ,o 9 . . , Snj, ,o 9 . . , s~}
(6)
and, s~9 = [1 + W[1 -
(pn/p~.~l]2~,
(7)
where the numerical value of s(~ denotes the grade of similarity corresponding to n th property of X with that of the/th prototype in Cj. For complete similarity (Pn = P~), snj = 1, whereas for very dissimilar patterns (pn >> p(~ or Pn "~ p.j), (/) and Snj is much less than unity. W is any positive constant dependent on each of the properties, and [3 is any arbitrary positive integer.
(10)
With all the nonfuzzy output, one can determine X e Cj if,
~sk (X) > ~sj (X)
k,j = 1 , 2 . . . . .
m;k#j,
(11)
where m denotes the number of pattern classes. A threshold level was used for the value r/sk (X). If r/~k (X) does not exceed this threshold, X is classified as "unknown." The threshold was determined from the statistics of r/~j (X). The value of the denominator fuzzifier, F d, was 100; the value of the exponential fuzzifier, F e, was 2. The constant [3 was chosen to be unity, and W (Eq. 7) was considered to be unity. These values were chosen empirically following the guidelines given by Pal and Dutta (8). To estimate the probability of error of the classifier, a method commonly used is the hold-out method. The design and test data set sizes are each 50% of the total data. However, this method is not suitable with a limited number of cases (as in this work). An alternate classifier design method was adopted: the "leave-one-out" or jacknife method, which has a small bias. One sample is left out; the classifier is then designed and tested using the sample left out. This process is repeated for all members of the data set. An experimental upper bound on the classification probability of error is determined by this method. DATA ACQUISITION Data of esophageal motility were obtained from the Gastrointestinal Unit at Mansoura University Hospital. Ten-minute esophageal monitoring data were recorded for 18 subjects using an esophageal motility recorder type M19. A catheter containing three pressure transducers
114
F.E.Z. ABOU-CHADIet
al.
(a) FUZZY PROCESSOR
Ii,
INF~JI"
plh'E~N
.•
'" CTr-q
r
"~ ~ - -
MAX I ~ ISELECTORI OUlPU!
DECISION
"1 o t t i
,
. . . . . . . . . .
',
r
' l
. . . . . . . . .
LEARNING SECIION
(b) H
Input
Feature "
ist
Extractor
~
Classifier
pi1)c 2nd Classifier
C
p I~ Sample
patterns
I Training Section
)
I
FIGURE 1. The classification system. (a) Structure of fuzzy classifier. (b) Block diagram of the two-level classifier.
spaced 5 cm apart was used to convert the pressure waves into an electrical signal. It was inserted into each subject transnasally or through the mouth into the esophagus until the three transducers reached the stomach. The subject was allowed to rest for a few minutes prior to the beginning of recording. Esophageal recording started when the three transducers were in the stomach (i.e., the three pressure waves were identical and in phase with the respiratory waveform). The recording was performed using a station pull-through method, in which the catheter was pulled back in a stepwise fashion in 1-cm increments and the patient was asked to swallow at a rate of 2 swallows/min. Responses to swallows and baseline tubular pressure, as well as low esophageal high pressure zone, esophageal tube, and pharyngeal motility were recorded while the catheter was pulled back. There were approximately 15 swallows in each record.
The output of the motility recorder was then connected to a 12-bit analog-to-digital converter with a built-in eightchannel capacity. To mark the location of the transducers in the esophagus in cm and to record the event of swallowing, two limit switches were used. These switches are provided in the motility recorder. The output of the three pressure transducers and the location and event markers were transmitted separately to an individual channel at a rate of 20 samples/sec. The digital data were transferred to an IBM PS2/80 computer by a program written in Basic, and the transfer of data from the five channels was done in sequential order. A chart recorder was produced simultaneously to check the digital record. Figure 2 shows an example of one record. An esophageal specialist, using all available esophageal function data, classified each record as control (C),
Fuzzy Pattern Recognition Model (a)
115
Swallow marker
I I I I
II
I
II
I
I
I
I
I_~.
I
I
I
I
I
OI~HHEL-2
CHI~iEL-3
Time t
,,
0
,1
.
,
2
I
~
4
I
6
I
Hlnute
O
Distance marker
lllll
(~
I II I
1 II l l l l
II 11111
I I1
1111
I11 I I I
IIII
111 I I
Different, sect, ions oI an esophageal record
2O
o -20
~
~ :~:~ r~SLomach sphincter
ub
a
y
-~ I I 1"1 9 Pharynx ,, sphincter
"t
FIGURE 2. An esopheageal pressure record (raw data). (a) The three esophageal pressure waveforms from the 20 samples/sec data and the distance and event marker records. (b) The different sections of the proximal waveform of channel 1 shown in (a).
hassab (H), and postinjection (PI). Patients who did not clearly fit into these categories were classified as indeterminate.
required to isolate each section and to extract the imbedded information in the data.
SIGNAL PROCESSING AND FEATURE EXTRACTION
The tubular esophageal section lies between the upper and lower sphincters. From a topographical and functional point of view, the esophagus can be divided into three different sections: the upper third (proximal), mostly striated muscles; the middle third (middle), both striated and smooth muscle; and the lower third (distal), entirely smooth muscle. Due to these differences in the sections, the pressure tracings obtained from each section are different and must be analyzed separately. The first step was to apply some smoothing procedure to the digital data to remove most artifacts generated during the AD conversion procedure. Therefore, a Hanning
The recorded esophageal signal is complex. It consists of five different sequential sections generated during the transducer passage in different locations of the tube: stomach, lower sphincter, tubular esophagus, upper sphincter, and pharynx. Each section has specific features; however, embedding of the recorded signal in instrumentation noise, in addition to respiratory and cardiac artifacts, made it difficult to detect automatically the beginning and end of each section and thereby its isolation and analysis. Therefore, a series of signal processing operations was
Identification of the Different Esophageal Sections
116
F.E.Z. ABou-CHADIet al.
filter (coefficients: 0.25, 0.5, and 0.25) was used immediately after digitization. The beginning of the esophageal tube was defined as the point at which the pressure is 5 mm Hg below a predetermined threshold. This threshold was taken as the average value of a 5-second recording of the gastric pressure. The end of the esophageal tube was identified by locating the point at which the pressure increases over the average baseline pressure in the proximal region by 2 mm Hg, which should last for 5 seconds. Average baseline pressure in the proximal region was taken as the average value of a 5-second recording. The length of the tubular esophagus was then calculated as the difference between the beginning and end points in cm. An average estimated length of the pharynx was then added to the length of the tubular esophagus. The resulting total length was then divided into three sections of equal length: distal, middle, and proximal. Baseline Removal
Feature extraction of the esophageal recordings requires the signal to have a reasonably steady baseline, because measurements of wave amplitude are made relative to the baseline. Thus, any baseline drift resulting from respiration or any other physiological factor must be reduced. A polynomial of order three, or a third-order cubic spline, was found to be appropriate because few constants need to be evaluated (14). The baseline removal process consists of estimating the baseline drift by filling a third-order polynomial through a set of predetermined points (before and after each peristaltic wave), and then subtracting the estimate from the original signal (1). Isolation of Peristaltic Waves
Automatic selection of peristaltic waveforms was performed to detect the location of their peaks using the event marker as a guide. The peak was defined as the maximum point that lies between two successive event markers. Only those pressure data points above a predetermined threshold (equal to the tubular baseline pressure plus 10 mm Hg) were saved with 1 second of data prior to the threshold crossing and 1 second after falling below the threshold. This approach captures a complete peristaltic wave and was adopted by Pfister et al. (12). Peristaltic Feature Extraction and Selection
A description of the 11 features extracted from the peristaltic waves of each subject is given in Table 1. The first five features (X 1 - - X5) are usually used by the physicians in manual analysis. The next three features (x6 Xs) are the velocities of propagation of a certain swallow
TABLE 1. Description of the extracted features. Feature
Description
X1 X2 X3 X4 X5 X8
Peak amplitude, in mm Hg Duration, in sec Area under the peristaltic curve Upstroke slope, in mm Hg/sec Downstroke slope, in mm Hg/sec Velocity of propagation from the proximal site to the middle site, in cm/sec Velocity of propagation from the middle site to the distal site, in cm/sec Velocity of propagation from the proximal site to the distal site, in cm/sec Amplitude of local wavelet, in mm Hg Interinterval between successive wavelets, in sec Peak factor
X7 X8 X9 XIO Xll
through the three channels. Velocity was defined as the time (sec) from the onset of the wave at one channel recording site until the time of the onset of the wave at another channel recording site divided into the corresponding distance in cm. Therefore, three velocities were calculated: v12 (from channel 1 to channel 2), v23 (from channel 2 to channel 3), and v~3 (from channel 1 to channel 3). Features x 9 and Xlo were derived using an inverse filtering procedure (13). Peristaltic waves were transformed into a set of data from which the position and magnitude of the local peaks could be easily estimated. The technique enabled distinction between peaks that are parts of the signal structure and those that are attributed to noise. Interperistaltic differences lie in certain descriptive parameters: the magnitude and location of the contributing wavelets. The last feature, Xll, is the peak factor (PF) (the ratio between the peak value and the root-mean-square (RMS) value) of a peristaltic wave. These three additional parameters are introduced by the authors for the first time. They give a precise quantitative description for the peristaltic envelope and, presumably, would improve the sensitivity of the classifier. The mean of the values of the parameters extracted from all peristalsis and detected from each esophageal section was determined for each record. Figure 3 shows the parameters extracted from a peristaltic wave. Although too few features will result in insufficient information to discriminate between classes, too many features will cause the training algorithms to overadapt to "noise" (signal components in the data unrelated to the problem being considered). It is therefore necessary to choose or select a relatively small set of features for classification. Many methods exist for dimensionality reduction of features (6); we restricted our feature selection to determination of the correlation matrix of the set of features. Elements of this matrix were found to have nonsignificant values, indicating that the extracted parameters are independent. This finding justifies use of the parameters introduced: eight features for each of the three sec-
Fuzzy Pattern Recognition Model
!
.,
/th'"
/11
xl
117
..-'.; x,) X,o 9
1111
,,
.ge
se
,'
& bose
X
z
"rime (see)
(soc)
FIGURE 3. Parameters extracted automatically from a peristaltic wave. xl = peak amplitude, x2 = duration; x 3 = area, x4 = upstroke slope, xe = downstroke slope, xs = amplitude of local peaks; and x~o = intervals between successive local peaks.
tions and three velocities, making a total of 27 parameters. Means and standard deviations of each parameter for the control and the two pathological classes are given in Table 2. CLASSIFICATION AND RESULTS A computer program was written in C-language to implement the classifier described. Classification was carried
out on two groups of subjects: a group of control subjects (C) and another group with clinical abnormalities. Abnormal cases were subdivided into two subgroups: hassab (H) and postinjection (PI). Because differences between the normal and PI cases lie in the motility of the distal section, many cases of PI resemble normal cases; therefore, in some cases, the initial classification done by the physician could be in error.
TABLE 2. Values of the means and standard deviations of the features used in classification. Control (C)
Hassab (H)
Preinjection (PI)
Group/Region
Feature
Mean
SD
Mean
SD
Mean
SD
Proximal
xl x2 x3 x4 xs x9 Xlo Xll Xl x2 x3 x4 xs x9 Xlo xll xl x2 x3 x4 xs x9 Xlo x~ x8 x7 xs
21.39 1.00 44.65 22.61 20.09 0.07 0.21 0.21 21.52 1.25 58.22 21.78 21.47 0.10 0.18 0.21 24.29 2.56 94.90 20.83 17.85 0.13 0.19 0.19 5.32 7.01 4.27
13.42 0.50 30.53 16.32 12.00 0.11 0.04 0.10 12.32 0.81 44.21 12.02 16.12 0.05 0.07 0.14 15.22 1.47 89.55 11.51 9.81 0.07 0.09 0.18 6.10 11.25 4.79
10.40 0.57 23.51 11.95 12.09 0.09 0.22 0.26 8.03 0.66 24.99 7,68 9.20 0.12 0.17 0.27 9.37 2.71 60.51 8.20 6.49 0.18 0.17 0.22 4.16 6.17 3.44
9.68 0.50 20.81 10.64 11.90 0.04 0.10 0.16 17.83 0.73 25.43 3.74 5.11 0.05 0.06 0.18 4.05 1.08 29.93 3.89 1.56 0.07 0.08 0.12 3.85 7.93 7.44
16.24 0.72 41.89 16.79 20.05 0.08 0.21 0.23 17.83 1.33 65.07 16.66 14.91 0.12 0.18 0.18 16.57 3.26 92.92 12.13 12.99 0.14 0.18 0.18 6.09 7.50 2.64
12.49 0.57 30.61 11.55 15.43 0.05 0.09 0.18 13.42 1.18 43.03 12.78 9.50 0.06 0.07 0.13 12.21 1.95 52.81 11.15 13.64 0.07 0.08 0.11 6.19 11.62 1.27
Middle
Distal
Velocity
118
F.E.Z. ABou-CHADIet aI. T A B L E 3. R e s u l t s of t h e f u z z y classifier (one level). Hassab
Postinjection
T A B L E 5. Results of t h e m i n i m u m
d i s t a n c e classifier.
Classified/True
ControL
Control Hassab Postinjection
8/10
--
2/10
--
Control
4/10
--
6/10
--
-3/6
2/2 --
-3/6
---
Hassab Postinjection
2/2 4/6
---
-2/6
---
Unknown
Therefore, it was necessary to use a second classifier to avoid misclassification. The approach is termed two-level classifier. Cases classified as " C " or " P I " were subjected to a second classifier designed to distinguish between these two types. This later classifier was based only on the eight features of the peristalsis detected in the distal section because features derived from the proximal and middle sections were found to cause overadaptation to the classifier, as mentioned. The block diagram of the twolevel classification is depicted in Figure lb. The results of the classification are given in Tables 3 and 4. All of the " H " records are correctly classified. Misclassifications between the C and PI cases are expected because only slight differences exist between the two groups. However, improvements in discrimination between the two types can be achieved by increasing the database. The performance of the proposed fuzzy classifier was compared with that of a conventional minimum-distance classifier. The Euclidean distance (16) was calculated and the jacknife method was utilized to estimate the probability of error. The results are given in Table 5. As seen from the table, the performance is too low (33%) compared with that of the proposed fuzzy classifier. The minimumdistance classifier failed to classify even the " H " cases due to the fuzziness of the properties. Results of the present study, although carried out on a relatively small sample size (only 18 subjects representing three different categories), indicate that the proposed method can produce an accuracy for classification as high as 88%. These promising results justify further development of the method and widening of the database to achieve higher accuracy when the method is used for online classification and diagnosis. CONCLUSION Fuzzy set pattern recognition and signal processing techniques were combined to design a classifier system that distinguishes different esophageal motility records. The system developed a number of time domain features T A B L E 4. R e s u l t s of t h e f u z z y classifier ( t w o levels). Classified/True
Control
Control Hassab Postinjection
9/10
-1/6
Hassab --
2/2 --
Postinjection
Unknown
1/10
--
--
--
5/6
--
Classified/True
Control
Hassab
Postinjection
Unknown
by applying appropriate signal processing techniques to the raw data and by selecting a set of features to produce a high level of accuracy. The accuracy to which the system could classify was estimated. When conventional parameters were used for classification, the probability of error was found to exceed 25%; however, using these parameters together with the additional parameters suggested herein, the error was reduced to less than 12%, a significant improvement in classification. The method shows promise considering the limited number of cases tested. The results could possibly be improved further by increasing the database. Automatic classification has been applied in medical diagnosis, speech recognition, among others. To our knowledge, this is the first report of application of an explicit signal-processing pattern recognition method to analysis and classification of esophageal motility records. REFERENCES
1. Abou-Chadi, F.E.Z.; Ezzat, F.A.; Gad-Elhak, N.; Sif ElDin, A.A. Tauberian-Prony feature extraction technique for esophageal motility patterns. Ann. Biomed. Eng. 21:117124; 1993. 2. Arzi, M.; Magnin, M. A fuzzy set theoretical approach to automatic analysis of nystagmic eye movements. IEEE Trans. BME 36:954-963; 1989. 3. Castell, D.O.; Dubois, A.; Davis, C.R.; Cordova, C.M.; Norman, D.O. Computer-aided analysis of human esophageal peristalsis. Dig. Dis. Sci. 29:65-72; 1984. 4. Castell, J.A.; Castell, D.O. Computer analysis of esophageal manometric recordings. Automedica 7:215-220; 1987. 5. Civanlar, M.R.; Trussel, H.J. Digital signal restoration using Fuzzy sets. IEEE Trans. ASSP 34:929-936; 1986. 6. Duda, R.O.; Hart, P.E. Pattern classification and scene analysis. New York: Wiley; 1973. 7. Feussner, H.; Bombeck, C.T.; Hampl, N.; Weiser, H.F. Computer-aided oesophageal manometry: prospects and problems. J. Biomed. Eng. 9:257-260; 1987. 8. Pal, S.K.; Duta, D.M. Fuzzy mathematical approach to pattern recognition. New Delhi: Wiley Eastern Limited; 1986. 9. Pal, S.K.; Duta, D.M. Fuzzy sets and decision making approaches in vowel and speaker recognition. IEEE Trans. SMC 7:625-629; 1977. 10. Pal, S.K.; Duta, D.M. On automatic plosive identification using fuzziness in property sets. IEEE Trans. SMC 8:302308; 1978. 11. Pal, S.K.; King, R.A. Edge detection of X-ray images using fuzzy sets. IEEE Trans. PAMI 5:69-77; 1983. 12. Pfister, C.J.; Harrison, M.A.; Hamilton, J.W.; Tompkins, W.J.; Webster, J.G. Development of a three-channel, 24-h ambulatory esophageal pressure monitor. IEEE Trans. BME 36:487-489; 1989.
Fuzzy Pattern Recognition Model 13. Sayers, B.McA.; Infantozi, A.F.C.; Panerai, R.B.; Nobre, F. Exploratory pattern-analysis study of a multifocal measles epidemic. Proc. IEE 19:693-701; 1982. 14. Shampine, L.F.; Allen, R.C. Numerical computing. Philadelphia: W.B. Saunders; 1973. 15. Zadeh, L.A. Fuzzy sets. Info. Control 8:338-353; 1965. APPENDIX
Some Definitionsfrom the Theory of Fuzzy Sets The characteristic function ~:X ~ {0, 1} of an ordinary (nonfuzzy) set A in a universe X is defined as p~A(X) =
{10 i f x ~ A , otherwise
119
the membership function of the fuzzy set. Qualitatively, the membership function describes the strength of our belief that x is a member of A. If I~A(X) = 1, it is certain that x is in A; and if tXA(X) = 0, it is certain that x is not in A. Thus, a fuzzy set can be considered as a subset of X with vague boundaries. Two fuzzy sets, A and B, are equal if p,A(X) = IXB(X) for all x in the universe X, and A is a subset of B if IXA(X) < IXa(X) for all x in X. The set of x's, for which txA(x) > 0, is called the support of the fuzzy set A. The height of a fuzzy set is defined as hgt (A) = sup I,LA(X) X IEX.
(A1)
where {0, 1} is called a valuation set. If the valuation set is the real interval [0, 1], then A is called a fuzzy set. &A(X) is the grade of membership of x in A, and is called
(A2)
Finally, a fuzzy set is normalized if its height is unity. The membership function is the key in fuzzy set theory. Guidelines for the construction of membership functions have been reported by Pal and Dutta (8).