1388
JOURNAL OF ATMOSPHERIC AND OCEANIC TECHNOLOGY
VOLUME 26
A Geometry-Based Approach to Identifying Cloud Shadows in the VIIRS Cloud Mask Algorithm for NPOESS KEITH D. HUTCHISON Center for Space Research, The University of Texas at Austin, Austin, Texas
ROBERT L. MAHONEY Algorithms Modeling and Simulations, NPOESS System Engineering, Northrop Grumman Space Technology, Redondo Beach, California
ERIC F. VERMOTE University of Maryland at College Park, College Park, Maryland
THOMAS J. KOPP The Aerospace Corporation, El Segundo, California
JOHN M. JACKSON, ALAIN SEI,
AND
BARBARA D. IISAGER
Algorithms Modeling and Simulations, NPOESS System Engineering, Northrop Grumman Space Technology, Redondo Beach, California (Manuscript received 15 July 2008, in final form 7 January 2009) ABSTRACT A geometry-based approach is presented to identify cloud shadows using an automated cloud classification algorithm developed for the National Polar-orbiting Operational Environmental Satellite System (NPOESS) program. These new procedures exploit both the cloud confidence and cloud phase intermediate products generated by the Visible/Infrared Imager/Radiometer Suite (VIIRS) cloud mask (VCM) algorithm. The procedures have been tested and found to accurately detect cloud shadows in global datasets collected by NASA’s Moderate Resolution Imaging Spectroradiometer (MODIS) sensor and are applied over both land and ocean background conditions. These new procedures represent a marked departure from those used in the heritage MODIS cloud mask algorithm, which utilizes spectral signatures in an attempt to identify cloud shadows. However, they more closely follow those developed to identify cloud shadows in the MODIS Surface Reflectance (MOD09) data product. Significant differences were necessary in the implementation of the MOD09 procedures to meet NPOESS latency requirements in the VCM algorithm. In this paper, the geometry-based approach used to predict cloud shadows is presented, differences are highlighted between the heritage MOD09 algorithm and new VIIRS cloud shadow algorithm, and results are shown for both these algorithms plus cloud shadows generated by the spectral-based approach. The comparisons show that the geometry-based procedures produce cloud shadows far superior to those predicted with the spectral procedures. In addition, the new VCM procedures predict cloud shadows that agree well with those found in the MOD09 product while significantly reducing the execution time as required to meet the operational time constraints of the NPOESS system.
Corresponding author address: Keith D. Hutchison, Center for Space Research, The University of Texas at Austin, TX 78759. E-mail:
[email protected] DOI: 10.1175/2009JTECHA1198.1 Ó 2009 American Meteorological Society
JULY 2009
HUTCHISON ET AL.
1. Introduction The National Aeronautics and Space Administration’s (NASA) Moderate Resolution Imaging Spectroradiometer (MODIS) is a heritage sensor of the Visible/ Infrared Imager/Radiometer Suite (VIIRS) sensor, which was first launched on board the NASA-sponsored National Polar-orbiting Operational Environmental Satellite System (NPOESS) Preparatory Project (NPP) mission. MODIS collects data in 36 spectral bands (Salomonson et al. 1989) and these data are used to generate a variety of data products (Savtchenko et al. 2004). VIIRS will collect data in 22 bands that will be used to create 23 data products (Hutchison and Cracknell 2006). A key product created with both MODIS and VIIRS sensors is the cloud mask, which is generated using sophisticated logic that includes a series of cloud detection tests. Although the MODIS cloud mask (MCM) algorithm has evolved since the launch of MODIS on the Terra spacecraft in December 1999 (Ackerman et al. 1997, 2002), the VIIRS cloud mask (VCM) algorithm was based upon an early version of the MCM algorithm (Reed 2002). The VCM algorithm has been recently updated to more fully exploit the unique design features of the VIIRS sensor (Hutchison et al. 2005, 2008b; Hutchison and Jackson 2003). In the NPOESS program, the Active Fire mask and VCM algorithms form the beginning of the processing chain for all VIIRS data products, except for VIIRS imagery, which is a stand-alone product. The VIIRS product chain includes seven cloud products (cloud optical thickness and effective particle size; cloud-top pressure, height, and temperature; cloud-base height; and cloud cover/layers), three ocean surface products (sea surface temperature, ocean color, and net heat flux), five land surface products (land surface temperature, normalized difference vegetation index, enhance vegetation index, albedo, and surface type), three snow– ice products (a subpixel snow mask, ice surface temperature, and ice age), and three atmospheric aerosol products (optical thickness, particle size parameter, and suspended matter), all of which use the VCM as input (Hutchison and Cracknell 2006). The MCM and VCM algorithms output a pixel-level cloud confidence consisting of four possible classes, that is, confidently clear, probably clear, probably cloudy, and confidently cloudy conditions. In addition, these algorithms generate a cloud phase analysis. Using procedures developed by Pavolonis and Heidinger (2004), the VCM cloud phase includes seven possible classes: water, mixed phase, cirrus, opaque ice, overlap (water and ice clouds in a single pixel), partly cloudy, and cloud free (Hutchison et al. 2005). The MCM and VCM algorithms also use
1389
flags to identify pixels that contain heavy aerosols and cloud shadows. New procedures recently implemented in the VCM have been demonstrated to accurately differentiate between clouds and heavy aerosols in global MODIS datasets (Hutchison et al. 2008b). Undetected cloud shadows can severely impact many of the VIIRS products, which are also referred to as environmental data records (EDRs), including the aerosol, land, and snow–ice EDRs. For example, the MODIS aerosol algorithms, used to create the MOD04 product, nominally examines four hundred 500-m pixels to retrieve the aerosol optical thickness (AOT) at a spatial resolution of 10 km over land and includes sophisticated schemes, for example, the ‘‘dark pixel’’ correction (Remer et al. 2006), to reduce the possible effects of cloud shadows, which have been shown to produce with MODIS data much lower than expected AOT values compared to ground-based observations (Hutchison et al. 2008a). On the other hand, the VIIRS intermediate AOT product is generated for each cloudfree, nominal 800-m pixel and the product can be severely degraded if shadows are not accurately identified because the path radiance will be much lower than assumed by the retrieval algorithm. Furthermore, the need to accurately detect cloud shadows is important to the generation of a variety of land products created from a variety of remote sensing platforms including the Advanced Very High Resolution Radiometer (AVHRR), Landsat, and MODIS (Huete et al. 2002; Liang et al. 2002; Simpson and Stitt 1998). Therefore, it is critically important that cloud shadows be accurately identified in the automated cloud-screening algorithms such as the VCM. During the initial testing of the VCM algorithm, it was found that the heritage, spectral-based cloud shadow approach seldom detected shadows that were evident in MODIS imagery, since no unique spectral characteristics exist that describe cloud shadows over complex global, cloud-free surfaces. Similarly, the approach often predicted false shadows, that is, shadows not associated with any clouds, as shown in section 2a. As a result, a new approach to identifying cloud shadows was sought and the geometry-based approach, used to create the MODIS Surface Reflectance (MOD09) product, was chosen as the primary candidate. However, preliminary testing with the MOD09 algorithm raised concerns about the lengthy processing time required to identify shadows with this approach. As a result, the MOD09 cloud shadow algorithm was significantly modified for use in the VCM, as discussed in section 2b, to meet the stringent latency requirements of the operational NPOESS system. In section 3, shadows for water and ice clouds are presented for a number of algorithms, including
1390
JOURNAL OF ATMOSPHERIC AND OCEANIC TECHNOLOGY
the geometry-based cloud shadow approach used in the latest version of the VCM and MOD09 algorithms along with those found with the spectral-based cloud shadow algorithms used in the older version of the VCM and the current Collection 5 MCM algorithms. Conclusions are drawn in section 4.
2. Theoretical basis for cloud shadow identification
on the VIIRS sensor. In the VCM spectral-based algorithm, cloud shadows are based on the reflectances in the 1.24-, 1.61-, 0.865-, and 0.672-mm bands and a shadow is predicted if the following conditions are satisfied: R(0.865) /R(0.672) . 0.3
(4)
R(1.61) , 0.07
(5)
R(1.24) , 0.135.
(6)
and
The MCM algorithm theoretical basis documents (ATBDs) state that the ‘‘Detection of cloud shadows is a problem that has not been addressed adequately in the literature’’ (Ackerman et al. 1997, 2002, 2006). These documents further state that clear-sky scenes that are potentially affected by shadows can be theoretically computed given the viewing geometry, solar azimuth and zenith angles, cloud edge distributions, and cloud altitude. They go on to say that this approach requires too much CPU to run operationally, and all the information (e.g., cloud altitude) is not available to the cloud mask algorithm. Therefore the MCM algorithm employs spectral tests based upon solar reflectances collected by MODIS to identify cloud shadows (Ackerman et al. 1997, 2002, 2006).
a. Spectral-based cloud shadow detection The MCM algorithm checks for shadows whenever the cloud mask indicates a clear field of view. Using MODIS Airborne Simulator data, it was originally believed that cloud shadows were present when the following conditions described by Eqs. (1) and (2) were satisfied [Ackerman et al. (1997): the reflectance in a particular spectral band is indicated by a subscript, e.g., reflectance in the 0.94-mm MODIS band is given by R(0.94)]: R(0.94) , 0.12 and
(1)
R(0.87) /R(0.66) . 0.3.
(2)
Subsequently, the reflectance in the 1.2-mm band was added to the spectral-based cloud shadow logic, as shown in Eq. (3) (Ackerman et al. 2002), and it remains in use in the MCM Collection 5 algorithm used to generate the MOD35 product (Ackerman et al. 2006). In the earliest of these updates, the threshold in Eq. (1) was also lowered to 0.07: R(1.2) is , 0.2.
VOLUME 26
(3)
The VCM spectral approach departed slightly from the MODIS 2002 version of the spectral-based shadow algorithm, due in part to the absence of a 0.94-mm band
or
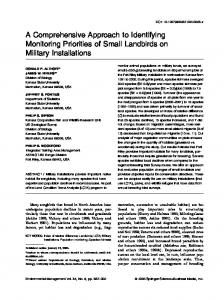
Figure 1 shows results produced by these spectral-based cloud shadow tests applied to a MODIS Terra granule collected over the western United States at 1835 UTC 30 October 2003. (The granule ID is MOD.2003.299. 1835.) A false-color image, constructed by assigning the 0.865-mm band to red, the 0.672-mm band to the green, and the 0.55-mm band to the blue, of the entire granule is shown in Fig. 1a while the region of interest is enlarged in Fig. 1b. Large shadows are apparent near clouds located at points A, B, and C. Figures 1c and 1d show shadows predicted with the spectral tests as discussed in Eqs. (1)–(6) using the original VCM (Reed 2002) and MCM Collection 5 algorithms. Notice first that results based upon the spectral tests fail to identify shadows in regions where they are clearly visible (points A–C) in the imagery shown in Fig. 1b. Second, note that the spectral tests predict shadows will occur in regions not associated with clouds, for example, points D and F in Fig. 1c. Shadows are also visible at point E in Fig. 1c but are not detected by these spectral tests. It is emphasized that cloud shadows predicted by the spectral tests with this case study represent the best produced in 40 1 MODIS granules analyzed during the course of these investigations. In most cases, the spectral-based tests failed to detect correctly any cloud shadows.
b. Geometry-based cloud shadow detection The logic used to generate cloud shadows with the geometry-based approach was developed by E. Vermote in support of NASA scientists responsible for the MODIS Surface Reflectance product. This is the first description of that approach to appear in the literature. A description of the geometry-based cloud shadow logic is shown in Fig. 2. Differences between the MOD09 and VCM implementations of this cloud shadow logic are highlighted (boldface and white text). As noted earlier, these differences were necessary to reduce VCM latency, since the direct implementation of the MOD09
JULY 2009
HUTCHISON ET AL.
1391
FIG. 1. (a) A color composite of MODIS granule MOD A.2003.299.1835. (b) As in (a), but with the region of interest enlarged. (c) The results from the VCM shadow spectral test, and (d) the results from the spectral test in the Collection 5 MODIS Cloud Mask (MOD35) product. Clouds are golden in the VCM and yellow in the MCM, while shadows are turquoise in both analyses.
1392
JOURNAL OF ATMOSPHERIC AND OCEANIC TECHNOLOGY
VOLUME 26
FIG. 2. Architecture for the geometry-based cloud shadow logic with differences between the VCM and MOD09 implementations highlighted in boldface and white text.
algorithm increased the VCM processing time by about an order of magnitude when using the spectral-based cloud shadow approach. The VCM implementation of the geometric-based approach, as shown in Fig. 2, reduced the processing time by a factor of 5 compared to the MOD09 implementation; however, it still doubled the time of the VCM algorithm when using the spectral-based approach. Key differences between the two implementations of the geometry-based cloud shadow algorithms are also summarized in Table 1. The first step in the geometry-based shadow logic is to assess the data for analysis by the algorithm. The shadow logic is executed under daytime conditions defined by the solar zenith angle (SZA), but there remain some internal inconsistencies in the definitions of day in
the VCM and other VIIRS cloud algorithms. These inconsistencies arise because some products can be retrieved at higher SZA values than others. The cloud shadow logic is executed if the SZA is less than or equal to 758. This condition is sufficient for all of the downstream VIIRS algorithms that may be negatively impacted by undetected shadows. However, the VCM cloud detection logic defines nighttime by a SZA greater than 858. Thus, some daytime pixels, as classified by the VCM, are eliminated from the cloud shadow logic due to these differences in these definitions. Next, as shown in Fig. 2, the process of compiling statistics for a 20 3 20 pixel ‘‘window,’’ which is the basic analysis region used in the geometry-based cloud shadow algorithm, is begun, as shown in the top part
JULY 2009
1393
HUTCHISON ET AL. TABLE 1. Comparisons between implementations of the VCM and MOD09 geometry-based shadow logic.
Feature Identification of candidate 20 3 20 pixel regions that might contain shadows Estimation of cloud boundaries Identification of shadows in each region Projection of the cloud shadow
Implementation in the MOD09 product application Identification of regions that contain clouds (in a the MOD09 binary cloud mask) Use of 11-mm brightness temperatures corrected for water vapor above cloud top Use of a sliding window (i.e., a pixel may be analyzed 19 times) Use of up to 32 iterations for each pixel using a step size of 0.5 km to cover the estimated cloud boundaries
of Fig. 2. In the MOD09 product, this window ‘‘slides’’ one row or one column at a time; however, in the VCM implementation, the window ‘‘hops’’ by groups of 20 3 20 pixels; that is, no single pixel is examined more than once. Use of a hopping window significantly reduced the latency in the geometry-based cloud shadow approach: d
d
A determination is made whether there are any confidently clear pixels within each 20 3 20 window in the VCM approach. A flag is set to identify windows with ‘‘at least one confidently clear pixel’’ (ALOCCP). Clear-sky, mean surface temperatures are computed from the gridded National Centers for Environmental Prediction (NCEP) 2-m air temperature fields.
The geometry-based cloud shadow procedures next examine each pixel to identify candidates that might cast a shadow. In preparation for estimating cloud boundaries, that is, the cloud-top and cloud-base heights, the MOD09 approach collects 11- and 6.7-mm brightness temperatures for each cloudy pixel. The cloud-top temperatures are then based on the 11-mm brightness temperature that has been corrected for water vapor attenuation above the cloud top using the 6.7-mm brightness temperature. Next, cloud-top temperatures are converted to cloud-top heights through comparisons against the mean 2-m NCEP surface air temperature, assuming a standard lapse rate, as shown in the box titled ‘‘Basic Cloud Boundary Logic in MOD09,’’ Fig. 2. Cloud-top and -base offsets are then applied to this estimated cloud-top height, to produce a cloud with a typical thickness of about 3 km. It is recognized that the simplistic approach to estimating cloud-top temperatures of optically thin (ice) clouds can lead to large errors in cloud-top heights with the MOD09 approach. Thus, a different approach is taken in the VCM implementation, using information from the cloud phase analysis, as discussed below. In
Implementation in the VCM algorithm Identification of regions that contain at least one confidently clear pixel Use of cloud phase and 11-mm brightness temperatures Use of a hopping window (i.e., a pixel is analyzed once) Use of up to four iterations for each pixel using a variable step size depending on estimated cloud boundaries
addition, in order for a cloudy pixel to be a candidate to cast a shadow, there must exist at least one clear pixel (ALOCCP) in the 20 3 20 neighborhood window where the geometry suggests a shadow could occur. (Note that shadows may be cast up to 60 km from a pixel residing in a 20 3 20 window. However, if no clear pixels exist in the 20 3 20 neighborhood window, pixels are not processed for two reasons: shadows are not allowed to be cast upon lower-level clouds and latency is greatly reduced by not processing shadows in regions of overcast cloud conditions, although this does occasionally cause some degradation in the shadow product.) In addition, shadows cannot be projected from pixels classified as both confidently cloudy and containing heavy aerosols (Hutchison et al. 2008b); that is, aerosols are not assumed to cast shadows. If at least one clear pixel exists in this 20 3 20 window where a shadow could exist, the following steps are followed: d
d
Ice cloud boundaries are estimated using an accurate cloud phase analysis (Hutchison et al. 2005, 2008b) based on the algorithm described by Pavolonis and Heidinger (2004, 2005). The VCM approach follows different processing paths to predict the cloud-top height of ice clouds, as shown by the white text in Fig. 2, depending on whether these clouds are classified as opaque, thin, or overlap. Thick cirrus clouds, that is, opaque cirrus and overlap cirrus, cast shadows larger than those found near thin cirrus. The cloud-top temperatures of these thicker clouds are based upon the 11-mm brightness temperatures, which are then converted to cloud-top heights per the MOD09 approach. Thin cirrus clouds project smaller shadows than thicker clouds based upon tunable cloud-top and -base heights parameters specific to thin cirrus. Cloud boundaries for water clouds follow the logic used in the MOD09 approach, as shown in Fig. 2. The
1394
d
JOURNAL OF ATMOSPHERIC AND OCEANIC TECHNOLOGY
cloud-top temperatures for these clouds are again based on the 11-mm brightness temperatures; however, no correction is made for water vapor attenuation above the cloud top since VIIRS has no 6.7-mm brightness temperature. Cloud-top temperatures are converted into cloud-top heights using the MOD09 approach. The maximum allowable cloud-top heights of all clouds are varied linearly with latitude from a mean tropopause height of 16 km in tropical regions to 8 km in polar regions. No attempt is made to predict cloudbase heights more accurately, using the VIIRS cloudbase height algorithm, since the retrieval of this and other VIIRS cloud properties occurs after the completion of the cloud shadows are projected by the VCM, as shown in Fig. 1 of Wong et al. (2007).
Estimates of cloud boundaries in both approaches are then converted into geometric shadows using an algorithm that iterates over cloud boundaries to compute the line of sight cloud shadow geometry: d
d
d
In the MOD09 approach, each step of the iteration is constrained to a 0.5-km interval, which means 32 iterations per pixel may be required for a 16-km-thick cloud to cast the shadow correctly onto the earth’s surface. In the VCM implementation, a maximum of four iterations is used to reduce latency. Thus, the iteration height interval is varied in the VCM implementation to cover the entire cloud boundary. While this aspect of the VCM implementation greatly reduces latency, it may produce gaps in shadows at large solar zenith angles. The MOD09 implementation does ensure that no gaps exist in the projection of the shadow onto the cloud-free pixels at high solar zenith angles. However, the quality of any shadow may be degraded at these high values of SZA since cloud-base heights are not known precisely, which means that contiguous shadows will be predicted while, in reality, shadowfree regions will occur between the cloud and its true shadow location.
Both implementations follow the same logic for the remaining steps of casting shadows onto the cloud-free earth. Each cloudy pixel is projected onto a cloud-free pixel at the earth’s surface. No correction is made for terrain. If the cloud shadow logic projects onto a cloudfree pixel, the shadow fills all cloud-free pixels in a 3 3 3 neighborhood around this location. This process is then repeated for each cloudy pixel. [Note: It is emphasized that the 20 3 20 box is used to maintain consistency with the heritage MOD09 cloud shadow algorithm. A typical MODIS granule contains
VOLUME 26
FIG. 3. (a) The new VCM geometry-based shadow flag, as described in Fig. 1. (b) Same as (a), but for the MODIS (MOD09) product where shadows appear slightly larger than in the VCM product.
2040 pixels in the cross-track direction and 1375 pixels in the along-track direction. This box size produces 102 analysis regions in the cross-track direction. While the 20 3 20 pixel region is use to compute a mean surface air temperature and to determine whether there are any candidate pixels for casting shadows within the domain of the mean surface air temperature, the actual geometry computation is based on individual pixels. The computed shadows are allowed to project beyond the boundaries of the 20 3 20 region and may project into neighboring granules. In addition, the MOD09 algorithm creates its own binary cloud mask; that is, it does not use the MCM (MOD35) product while the VCM contains cloud confidence fields similar to the MOD35 product. The implementation of the VCM shadow logic produces shadows (by default) from confidently cloudy pixels only but the code allows for other possibilities; for example, shadows could be produced from pixels classified as probably cloudy.]
3. Results Results are presented for two MODIS granules: one containing well-defined shadows for water clouds the other containing shadows cast by ice clouds. Figure 3 shows the results of the geometry-based cloud shadows for the scene shown in Fig. 1, which contains water clouds. Figure 3a shows the results from the VCM algorithm while Fig. 3b shows the data contained in MODIS Collection 5 Surface Reflectance (MOD09) product. To help differentiate between the algorithms, MODIS clouds are displayed in yellow while clouds generated by the VCM algorithm appear as orange. Shadows appear turquoise for both products. First, it is evident that both products identify substantially more shadows than those found in either of the spectral-based tests shown in Fig. 1. This is most evident
JULY 2009
HUTCHISON ET AL.
1395
FIG. 4. (a) A true-color composite of MODIS granule 2001.032.1750. Cirrus clouds are seen in the red box, which are examined more closely in the other displays. (b) VCM clouds (orange) and shadows (turquoise) based on the original spectral tests for this area of interest. (c),(d) The shadows from the VCM and MOD09 geometry-based approaches, respectively, as described in Fig. 1. In this ice cloud case, the VCM shadows are larger than those found in the MOD09 product.
by examining regions surrounding points A, B, and C in Fig. 1b. A close examination of the VCM reveals the layering of the four height intervals used to locate the shadow, especially at the small-scale clouds above point
C. The effects of this layering are less evident in the MOD09 product since the 0.5-km interpolation interval produces a shadow with smoother edges. However, comparisons between the cloud shadows observed above
1396
JOURNAL OF ATMOSPHERIC AND OCEANIC TECHNOLOGY
point B in Fig. 1b show that the VCM shadow mask, along with the MOD09 product, completely identifies all pixels seen in the imagery to contain shadows. In addition, the geometry-based algorithms do not place shadows in regions where clouds do not exist. This reduction in erroneous or false cloud shadows is most apparent in the areas surrounding points D and F in Fig. 1c. While the spectral tests identified many shadows in these regions, far fewer are seen in the results generated by the geometry-based algorithms. Further enlargements of the imagery contained in Fig. 1b (not shown) reveal the presence of some small-scale clouds in these regions, in agreement with the VCM shadows identified by the geometry-based algorithm; however, the M5 Reflectance Test used in the VCM does create some false clouds that then project erroneous shadows. The M5 test has been corrected to reduce these false detections. A cursory view might lead one to think that shadows, shown in Figs. 3a and 3b appear to surround some clouds. However, this is not the case. The direct rays of sunlight are arriving into this scene in a direction from the bottom right toward the upper left of the scene. The shadows from the clouds lie along this direction. In some instances, see, for example, point B in Fig. 1b, shadows appear on both sides of the clouds. The shadows to the lower right of the clouds are projected from another set of clouds and are spread using the 3 3 3 filling logic. Thus, in some instances, these shadows may extend up to the edge of another cloud system, making it appear that the shadows are being projected in all directions around a cloud. Cloud shadows are also shown for the geometrybased logic for the ice clouds shown in the MODIS scene contained in Fig. 4, which covers the southwest United States and northern Mexico. These data were collected by MODIS Terra at 1750 UTC 1 February 2002 (granule ID MOD.2002.032.1750). The Baja Peninsula is surrounded by the blue water of the Pacific Ocean and is clearly seen through nearly overcast cirrus in the lowerleft corner of the scene, which extends across the bottom half of Fig. 4. An extensive area of snow extends from the northern Great Plains (upper-right corner) toward the Rocky Mountains in the middle of the scene. The Great Salt Lake is also seen toward the upper-left corner in Fig. 4. Figure 4b contains cloud shadow results from the VCM cloud mask algorithm using the spectral tests. (In this case, the actual VCM cloud mask is not shown separately since the spectral tests detected so few shadows.) Figures 4c and 4d again show the VCM and MOD09 geometry-based cloud shadows. In this case, the VCM projects a slightly larger shadow than is found in the MOD09 product. Upon closer examination of the MOD09 product, it is seen that unmasked shadows
VOLUME 26
in the imagery are evident around points A and B in Fig. 4d, while these edges of undetected shadows are not observed in the VCM results shown in Fig. 4c. It appears that using the cloud phase analyses in the VCM to specify the cloud-top height of cirrus clouds can provide a more accurate cloud shadow when the clouds are not completely opaque. The smaller shadows cast by the MOD09 approach probably occur because the actual cloud-top temperature is colder than the 11-mm brightness temperature, so the cloud-top height is placed too low in the atmosphere.
4. Conclusions A geometry-based approach has been presented to identify cloud shadows with the Visible/Infrared Imager/ Radiometer Suite (VIIRS) cloud mask (VCM) algorithm for the NPOESS program. The procedures closely follow those developed to identify cloud shadows in the MODIS Surface Reflectance (MOD09) data product. However, significant differences were necessary in the VCM implementation of the MOD09 procedures to reduce latency in the VCM algorithm and to compensate for the absence of some MODIS bands not available in the VIIRS sensor. The new VCM cloud shadow procedures exploit both the cloud confidence and cloud phase intermediate products to better classify cloud tops associated with optically thin cirrus clouds. The analysis of water clouds follows more closely the MOD09 procedures. In general, the results from the VCM and MOD09 shadow algorithms are in good agreement. NPOESS latency requirements forced some modifications to the MOD09 shadow logic to be implemented in the VCM algorithm. First, the VCM approach uses a hopping 20 3 20 pixel region as the basic analysis area for the shadow logic while the MOD09 employs a sliding window. In addition, once cloud boundaries have been determine, the VCM uses a maximum of four iterations of varying cloud thickness to build the shadow while the MOD09 approach uses a constant 0.5-km cloud thickness with up to 32 iterations to construct the shadow. Results show that the geometry-based approaches used to predict cloud shadows are far superior to those procedures that predict shadows with the spectral tests that continue to be used in the MODIS Collection 5 Cloud Mask (MOD35) algorithm. In addition, procedures used in the new VCM geometry-based implementation significantly reduced the execution time of the MOD09 approach, when compared to running the VCM spectral-based tests. The analyses of about 40 MODIS runs showed the core time on an International Business Machine (IBM) computer, running the
JULY 2009
HUTCHISON ET AL.
Advanced Interactive Executive (AIX) operating system was about 22 s per granule. Replacing the spectral test with a direct implementation of the MOD09 algorithm increased this core time to about 200 s, while running the VCM with the VCM implementation required about 45 s. As a result, the VCM implementation provides a high quality shadow analysis within the operational time constraints of the NPOESS system. However, users should exercise caution with data collected at high solar zenith angles where shadows may not be contiguous. Acknowledgments. The views, opinions, and findings contained in this article are those of the authors and should be construed as an official position of Northrop Grumman, NOAA, the Aerospace Corporation, or the NPOESS program. REFERENCES Ackerman, S. A., and Coauthors, 1997: Discriminating clear-sky from cloud with MODIS. NASA Algorithm Theoretical Basis Doc. MOD35, version 3.2, 125 pp. ——, and Coauthors, 2002: Discriminating clear-sky from cloud with MODIS. MODIS Algorithm Theoretical Basis Doc. MOD35, version 4.0, 115 pp. [Available online at http:// modis.gsfc.nasa.gov/data/atbd/atbd_mod06.pdf.] ——, and Coauthors, 2006: Discriminating clear-sky from cloud with MODIS. NASA Algorithm Theoretical Basis Doc. MOD35, version 5.0, 129 pp. Huete, A., K. Didan, T. Miura, E. P. Rodriguez, X. Gao, and L. G. Ferreira, 2002: Overview of the radiometric and biophysical performance of the MODIS vegetation indices. Remote Sens. Environ., 83, 195–213. Hutchison, K. D., and J. M. Jackson, 2003: Cloud detection over desert regions using the 412 nanometer MODIS channel. Geophs. Res. Lett., 30, 2187, doi:10.1029/2003GL018446. ——, and A. P. Cracknell, 2006: Visible Infrared Imager Radiometer Suite: A New Operational Cloud Imager. CRC Press, 256 pp. ——, J. K. Roskovensky, J. M. Jackson, A. K. Heidinger, T. J. Kopp, M. J. Pavolonis, and R. Frey, 2005: Automated cloud
1397
detection and typing of data collected by the Visible Infrared Imager Radiometer Suite (VIIRS). Int. J. Remote Sens., 20, 4681–4706. ——, S. Faraqui, and S. Smith, 2008a: Improving correlations between MODIS aerosol optical thickness and ground-based PM2.5 observations through 3D spatial analyses. Atmos. Environ., 42, 530–543. ——, B. Iisager, T. Kopp, and J. M. Jackson, 2008b: Discriminating between clouds and aerosols in the VIIRS cloud mask algorithms. J. Atmos. Oceanic Technol., 25, 501–518. Liang, S., H. Fang, J. T. Morisette, M. Chen, C. J. Shuey, C. L. Walthall, and C. S. T. Daughtry, 2002: Atmospheric correction of Landsat ETM1 land surface imagery. II. Validation and applications. IEEE Trans. Geosci. Remote Sens., 40, 2736–2746. Pavolonis, M. J., and A. K. Heidinger, 2004: Daytime cloud overlap detection from AVHRR and VIIRS. J. Appl. Meteor., 43, 762–778. ——, and ——, 2005: Daytime global cloud typing from AVHRR and VIIRS: Algorithm description, validation, and comparisons. J. Appl. Meteor., 44, 804–826. Reed, B., 2002: VIIRS cloud mask (VCM) algorithm theoretical basis document. Raytheon Systems SBRS Doc. 2412, 44 pp. [Available online at http://www.npoess.noaa.gov.] Remer, L. A., D. Tanre´, and Y. Kaufman, 2006: Algorithm for remote sensing of tropospheric aerosol from MODIS: Collection 5. MODIS Algorithm Theoretical Basis Doc., NASA Goddard Space Flight Center, 87 pp. [Available online at http://modis-atmos.gsfc.nasa.gov/MOD04_L2/atbd.html.] Salomonson, V. V., W. L. Barnes, P. W. Maymon, H. E. Montgomery, and H. Ostrow, 1989: MODIS: Advanced facility instrument for studies of the earth as a system. IEEE Trans. Geosci. Remote Sens., 27, 145–153. Savtchenko, A., D. Ouzounov, S. Ahmad, J. Acker, G. Leptoukh, J. Koziana, and D. Nickless, 2004: Terra and Aqua MODIS products available from NASA GES DAAC. Adv. Space Res., 34, 710–714. Simpson, J. J., and J. R. Stitt, 1998: A procedure for the detection and removal of cloud shadow from AVHRR data over land. IEEE Trans. Geosci. Remote Sens., 36, 880–897. Wong, E., K. D. Hutchison, S. C. Ou, and K. N. Liou, 2007: Cirrus cloud top temperatures retrieved from radiances in the National Polar-Orbiting Operational Environmental Satellite System—Visible Infrared Imager Radiometer suite 8.55 and 12.0 mm bandpasses. Appl. Opt., 46, 1316–1325.