The need for a GUI is important because it allows users to read existing .... when a building is going to be searched; a road node is placed at the spot on a road ...
Int'l Conf. Modeling, Sim. and Vis. Methods | MSV'11 |
75
A Graphical User Interface for Simulating Robust Military Village Searches Ryan Friese1, Paul Maxwell1, 3, Anthony A. Maciejewski1, Howard Jay Siegel1, 2 1 Electrical and Computer Engineering Department 2 Computer Science Department Colorado State University, Fort Collins, CO 80523-1373 USA 3 United States Army Abstract—In the current military environment, village searches are conducted daily. To accomplish a village search task in accordance with orders provided by higher headquarters, the mission leaders must plan and allocate resources (e.g., soldiers, robots, military working dogs, unmanned aerial vehicles) efficiently. The plans these leaders create are based on personal experience and planning data found in military field manuals. The Robust People, Animals, and Robots Search (RoPARS) planning tool for village search developed at Colorado State University can assist military leaders in the planning process. The tool consists of a graphical user interface and a resource allocation engine. This tool allows a user to create a simulation for a given village. These simulations allow military leaders to visualize how a given plan would be executed and to develop plans for the mission that are robust against uncertainty in the environment. Keywords: graphical user interface, simulation, village search, robustness, resource allocation
1. Introduction Military leaders are often forced to make decisions about how to allocate and utilize a variety of resources available to them. Under the stresses and constraints of warfare, making these decisions can be difficult. To help military leaders, we can use computers to formulate plans that will ensure the solution will be within the mission constraints. Currently, there is no such tool available, and decision makers must rely on their own personal experience to formulate mission plans. The Robust People, Animals, and Robots Search (RoPARS) planning tool for village searches developed at Colorado State University is part of the People-AnimalsRobots (PAR) multi-disciplinary research project. The PAR project is organized by the Colorado State University Information Science and Technology Center (ISTeC) [1]. RoPARS will be able to assist military leaders allocate
This research was supported by the National Science Foundation under grant number CNS-0905399, and by the Colorado State University George T. Abell Endowment
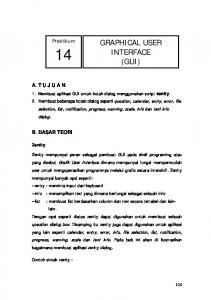
resources and make decisions throughout the planning process. Village searches are an important daily mission for the military. A village search consists of multiple search targets (e.g., buildings) and multiple search resources (e.g., soldiers, military working dogs, robots, unmanned aerial vehicles). The planners must be able to efficiently allocate the search resources to search the targets while staying within the mission’s constraints. The overall mission constraint we are concerned with is mission deadline time (MDT), but there are many important intermediate constraints. These intermediate constraints take the form of boundary lines (physical or virtual lines that indicate allowable search areas for the search teams), phase lines (physical or virtual lines that represent a synchronization barrier controlling forward movement of search teams), and direction of advance (indicates search direction). Figure 1 shows an example of a village with these constraints. To create these mission plans, leaders use their own experience and simple data tables provided in military field manuals (e.g. [2, 3]). There are a number of uncertainties that are present during each mission, such as changes in search rate, movement rate, weather, temperature, enemy presence, and road blockages. These uncertainties cause variation in the rate at which movement and searches are conducted. Thus, creating an exact solution is infeasible. The RoPARS planning tool provides a way for leaders to account for these uncertainties and create a solution that is robust against them. In this environment, we say a solution is robust [4, 5] if we meet the specified MDT even with the uncertainties in search and movement rates. We quantify robustness by the probability we will meet the MDT. For a more detailed explanation of how we define robustness for the military village search problem, the reader is referred to [6]. The RoPARS planning tool consists of a graphical user interface (GUI) and a resource allocation engine. The tool is a simple geographical information system (GIS) that imports Environment Systems Research Institute (ESRI) shapefiles of a search area, it allows user input to the plan, creates a resource allocation using “static” or “offline” allocation heuristics (e.g., [7]) and graphically displays the resulting plan at a user-selected rate.
76
Int'l Conf. Modeling, Sim. and Vis. Methods | MSV'11 |
Figure 1. Example village search mission with eight target buildings (Tj), a unit boundary, a phase line, and a direction of advance. Taken from [6]. The need for a GUI is important because it allows users to read existing shapefiles of a search area, and then recreate the village from them. By using these existing files, users do not have to spend their own time creating these villages by hand, which can be an extremely time consuming process. With this tool, we make the planning process quicker and more efficient. We currently do not know of other tools that leverage these existing files in the way we do. Although we are presenting this tool for use in a military village search situation, the GUI can be adapted for use in the search and rescue domain [8]. The main contribution of this paper is to introduce and demonstrate the graphical user interface for the RoPARS planning tool. This will show that by using a simple interface, which utilizes existing imaging files, leaders can create efficient plans in a faster and simpler way. The remainder of the paper is organized as follows. Section 2 reviews related work in the fields of military combat simulation. Background on the different tools that helped to create the GUI is discussed in section 3. A description of the workings, features, and operation of the GUI are detailed in section 4. Section 5 contains our conclusions and future work.
2. Related work While our work is directed towards military village search, it is similar to the problems presented by search and rescue missions. There has been much work done in developing software to help aid in planning of search and rescue missions. At a broader level of abstraction, there has been much work done creating geographical information systems GUIs. ESRI developed one of the most popular current GIS software packages [9]. ArcGIS is a multi-feature software package for displaying and manipulating geographic
information. Similar to our software, ArcGIS allows users to import shapefiles and view their contents. It also contains many features that are unrelated to the village search problem. Although ArcGIS is a very powerful and useful software, our GUI is much simpler and allows for easy manipulation of a search area. The software in [10] is used by the United States Coast Guard in search and rescue missions around the United States and the Caribbean. The GUI is actually an extension of [9] and so it is able to use all the features provided by the ArcGIS program. This program attempts to simplify the user interaction with the ArcGIS software by providing a wizardbased interface and by minimizing keystrokes. It also has animated display capabilities. Like our software, this software allows users to add constraints to the search mission. Where the program differs from ours is that it primarily deals with water-based missions, as well as searches that take place over a large area. It does not have the same level of granularity that our software provides, i.e., building-bybuilding searches. Another search and rescue program is [11]. This software, unlike [10], is designed to handle not only waterbased search missions, but also land-based missions. While it is able to allow users to view the plans for a search and rescue mission, it requires the users to create these missions themselves. Users must create the search routes as well as handle the allocation of search resources. Avoiding such human intensive actions is the motivation for developing our RoPARS tool. Outside of the realm of search and rescue, the authors of [12] demonstrate software used for road routing in a cooperative multi-transportation system. The program is a GIS system that works at the “village” or city level, much like our work. It displays the best road routing for a given system, and is similar to the way we display search routes for a given village search. Because this program is dealing with road routing it has no reason to take into account building locations, nor does it have to display any animations. The authors in [13] present software that utilizes computer aided design (CAD) drawings, GIS technology, and a virtual reality (VR) environment to simulate evacuation dynamics. The simulated evacuations are created for individual buildings and each person inside the building will have a unique escape route. Much like our software, the authors utilize GIS to extract spatial features of an area to formulate a plan. This simulation software allows users to focus on an individual building instead of a larger area. As a supplement to GIS, the authors of [14] conducted a survey on the integration of wireless sensor networks with GIS. Wireless sensor networks provide data on a variety of environmental factors such as temperature, humidity, and location of objects. All of these factors could be utilized by our software to create plans that are more effective. In summary the wide variety of software that uses GIS concepts varies in its designs and purposes, such as general display and modification of geographic data, search and rescue mission planners, building evacuation simulators, and
Int'l Conf. Modeling, Sim. and Vis. Methods | MSV'11 |
road routing systems. While all useful in their domains, none contain all the features required for military village search missions.
3. Background The RoPARS tool was implemented using C++. We chose C++ as our language due to the fact there are existing libraries and frameworks we could use to handle some of the lower level details of a graphical user interface and the reading in of shapefiles. To create the graphical user interface, Qt [15], a cross-platform software and user interface framework was employed. The Qt framework contains the tools necessary for drawing and handling interactions with the GUI. By handling most of the infrastructure code, Qt allowed us to focus on creating features for the GUI instead of the framework operations of the GUI. Qt has a framework that handles the drawing of custom shapes, as well as a framework that can handle various types of animations. The GUI utilizes both of these frameworks. The GUI is able to visually display a search area. The geographical information for the search area is contained in an ESRI shapefile. Many shapefiles of military interest can be downloaded from the urban tactical planner suite [16]. Shapefiles are a popular geospatial vector data format for geographic information systems. A shapefile stores nontopological geometry and attribute information for the geospatial features in the set. These features are stored as independent shapes within the file, with each shape comprised of a set of vertices that define its shape. Because these shapes are independent of one another, they can be noncontiguous and overlapped. Shapefiles can be used to define features such as roads, buildings, and waterways. The RoPARS GUI currently requires one shapefile representing the roads in a search area and one shapefile representing the buildings. While shapefiles at the very least provide geospatial information, they do not necessarily explicitly provide attributes about the features such as road lengths or the total ground surface area a building occupies (both of these attributes are required for creating a search plan). The GUI becomes more powerful and informative as the data in the shapefile grows. If the provided shapefiles are rich in information, the GUI can use this information to be more detailed and accurate. Currently, due to the sparseness of data contained in the available shapefiles, both road lengths and total ground surface area occupied by a building may have to be calculated after loading the shapefiles into the GUI. To load in shapefiles, the GUI makes use of the C library provided by [17].
4. GUI description 4.1. Overview The graphical user interface for the RoPARS planning tool is what allows users to create, and visualize search plans
77
in a quick and efficient manner. Because time is often a precious commodity on the battlefield, leaders need a simple yet powerful interface to run simulations and generate resource allocations quickly. The GUI essentially has two main operating modes. The first is the village definition mode, and the second is the simulation/playback mode. The village definition mode is where a user selects shapefiles, inputs mission constraints (e.g., boundary and phase lines, buildings to search, and search teams) and creates data files for the resource allocation engine. The playback mode allows the user to view a plan created by the resource allocator.
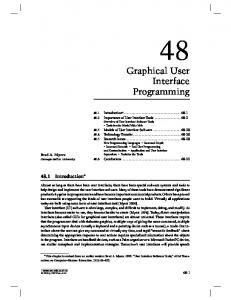
4.2. Village definition mode Village definition mode allows the user to create the search scenario. First, a user must input shapefiles describing the search area. Two shapefiles must be input: one for the roads in the search area and one for the buildings in the area. The GUI will then parse the shapefiles and display the village. The user is then able to modify the village to match the constraints required by the mission. There are currently four modifications a user can apply to the village. The first modification a user can perform is selecting which buildings to search in the village. A selected building will be colored blue, as shown by the screenshot in Figure 2. The next two modifications allow the user to partition the village with the military graphical control measures boundary and phase lines. The village in Figure 2 contains one boundary line, indicated by the vertical green line running through the middle of the village. The village also contains a single phase line as shown by the horizontal red line. Finally, a user is able to add search teams into the village. Figure 2 shows the village currently contains three human teams, one canine team, and one robot team. Each team’s individual search attributes are also visible. Aside from allowing the user to add modifications to the village, the GUI must also calculate additional information about the village for use in search plan creation. The first piece of information calculated is the approximate ground surface area occupied by each building. The ground surface area is used by the resource allocator to determine how long a search team will take to search a building. The buildings input from the shapefile can be virtually any shape and are not guaranteed to be convex. Thus, to calculate the ground surface area, each shape must first be triangulated (i.e., split up into many small triangles). It is then a simple procedure of calculating the area of all the triangles comprising the shape and adding them together. To triangulate the shapes, the earclipping algorithm provided by [18] is used to allow both convex and concave shapes to be triangulated. This is not an exact procedure and error does occur, often in the form of a calculated area bigger than what the building actually occupies. This error will occur if the building has, for example, a courtyard in the middle of it. We assume this error is negligible, although courtyards are not part of the actual building, search teams may still search through them while exploring the rest of the building.
78
Int'l Conf. Modeling, Sim. and Vis. Methods | MSV'11 |
Figure 2. RoPARS tool GUI screen capture of an example village search scenario with a vertical boundary line (green), a horizontal phase line (red), thirty target buildings (blue), and five search teams and their search attributes. After calculating the building areas, the approximate GPS centroid for each building must also be calculated. This information is useful in the resource allocation engine for heuristics that use distance as a metric [19]. The centroid is calculated by taking the center of the bounding box for a given building. Again this is not an exact procedure and produces minor error, as the calculated centroid is actually for the bounding region of a building, not the building itself. This error occurs most often on buildings that are irregularly shaped, and is less likely for buildings that are square or rectangular. We assume this error is also negligible, even though the GPS centroid might be outside the building (e.g., a courtyard or lawn), it still indicates the point about which the building is located. When finished calculating the ground surface area and GPS centroid for the buildings, the road network must be
represented. The road network consists of road segments and road nodes. A road segment is a stretch of road between two road nodes. Road nodes are created using three criteria. The first is where two road segments intersect each other with the road node being placed at the intersection. The second is when a building is going to be searched; a road node is placed at the spot on a road segment closest to the building. The last criterion for creating road nodes is a limit on the length of any given road segment (e.g., 200 meters). Any road segment longer than the length criterion is subdivided into multiple segments. With the road network represented, the GUI displays the search area, allowing a user to view and constrain the search area. Users are allowed to select buildings they want to search. Every time a new building is selected, the road network either adds a new road node for the building to
Int'l Conf. Modeling, Sim. and Vis. Methods | MSV'11 |
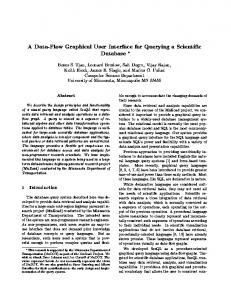
connect to, or connects the building to an existing road node. The road network is updated so that the minimum number of road nodes are used to meet the three road network criteria. Users can further constrain the search area by adding in boundary and phase lines. A boundary line splits the search area into separate smaller areas. A search team that is assigned to one area is not allowed to cross a boundary line and enter another area. A phase line represents a synchronization line for the teams searching the village. This means that a search team cannot cross a phase line until all other search teams, regardless of which boundary area they area in, are ready to cross that phase line. A user is able to draw in multiple boundary lines and phase lines. Every time a new line is input, the GUI must calculate on what side of the line every road node and building is located. The GUI then color-codes the buildings to show which boundary and phase area they are located. The final constraint a user is able to add to the search area is the search teams used in the mission. A user is able to add three different types of search teams to the search area. These are human search teams, military working dog search teams, and robot search teams. Every time a new search team is added, a dialog box is opened allowing the user to change certain properties of the team (Figure 3). These properties of a search team are the mean movement rate, the standard deviation of the movement rate, the mean search rate, and the standard deviation of the search rate. Each of these values can be edited for each search team, and are supplied to the resource allocator to create search plans. If the user chooses not to enter specific values for each team, default values are used instead. These default values are taken from military field manuals such as [2, 3]. After a user is finished constraining and adding search teams to a search area, the GUI creates three data files for the resource allocator. The first file is the road network file. This file is essentially an adjacency table that contains the information on how the nodes in the road network are connected to each other, i.e., which road nodes are connected, and the distance in meters between them. The second file is the building data file. This file contains the information
79
about the buildings to be searched, as well as each of those buildings’ approximate ground surface area, and GPS centroid. The buildings are also organized according to boundary area and phase line area. The third file is the search resource file. This file contains information about the search teams, it specifies the type of teams, and each team’s movement and search attributes. These three files are used by the resource allocator to create robust and efficient search plans.
4.3. Playback mode Once the resource allocation engine has finished creating a search plan, it creates an allocation file that the GUI uses to display and playback the search plan. This allocation file contains information for each team, showing which road segments a team traverses and how long it takes the team to traverse each segment, and which buildings a team searches as well as how long it takes to search each building. Taking this information, the GUI constructs animations for each team that visually show the search path each team takes. This timing data is based on the expected values of the completion time probability mass functions used in the allocator [19]. Because the timing data from the resource allocation engine is used, all of the teams’ locations with respect to each other are representative of what they would be like in the real world. These animations also accurately show how every team must be ready to cross a phase line before any one team does cross the line. Users also are allowed to change the rate at which the playback runs. It can be played back as slow as real time and as fast as 500x. Not only does the GUI playback the search paths for each team, but also it traces out the search path as a team advances (Figure 4). After the playback is finished, a user can still see what path a team followed as well as which buildings that team searched. There is also the option for the user to select specific teams and only display those teams’ search paths. This allows users to inspect individual team search plans. After viewing a search plan, a user can go back and add or remove constraints from the village, and then generate a new search plan for comparison purposes.
Figure 3. RoPARS tool GUI screen capture of a search resource edit attributes dialog.
80
Int'l Conf. Modeling, Sim. and Vis. Methods | MSV'11 |
5. Conclusions Determining how to utilize and allocate resources for a military village search is a common but complex problem. Currently military officers must use simple field manuals and personal experience to create these plans. This is a timeconsuming process and creates plans of varying quality. We have presented the GUI for the RoPARS tool to demonstrate how computer- aided planning can assist in creating robust search plans. This GUI provides a simple and intuitive yet powerful interface for users to quickly define a search area, and then see an animation of the resulting search plan. Future work in this area includes augmenting the GUI to allow dynamic updating and display of a search plan while it
is conducted on the ground, possibly through the use of wireless sensor networks [14]. This would allow commanders to see mission progress, as well as modify the current plan, should unforeseen difficulties develop during the search. Such difficulties could include roadblocks, insurgent activity, or environmental factors. There also are various general improvements to the GUI such as multithreading the entire application, allowing for the input of more environmental constraints/variables, and displaying the satellite imagery of the search area underneath the graphical representation. Acknowledgements. The authors would like to thank A. AlQa’wasmeh and B. Khemka for their comments.
Figure 4. RoPARS tool GUI screen capture of an example resource allocation in playback mode with five search resources and their associated colored movement paths.
Int'l Conf. Modeling, Sim. and Vis. Methods | MSV'11 |
81
References [1] Colorado State University, The Information Science & Technology Center, http://www.ISTeC.ColoState.edu, accessed Feb. 15, 2011. [2] FM 34-8-2 Intelligence Officer‟s Handbook, U. S. Army Training and Doctrine Command, Ft. Monroe, VA, May 1998. [3] FM 3-31.1 Army and Marine Corps Integration in Joint Operations, U. S. Army Training and Doctrine Command, Ft Monroe, VA, Nov. 2001. [4] S. Ali, A. A. Maciejewski, H. J. Siegel, and J. Kim, “Measuring the robustness of a resource allocation,” IEEE Transactions on Parallel and Distributed Systems, Vol. 15, No. 7, Jul. 2004, pp. 630-641. [5] S. Ali, A. A. Maciejewski, and H. J. Siegel, “Perspectives on robust resource allocation for heterogenous parallel systems,” Handbook of Parallel Computing: Models, Algorithms, and Applications, S. Rajasekaran and J. Reif, eds., Chapman & Hall/CRC Press, Boca Raton, FL, 2008, pp. 41-1-41-30. [6] P. Maxwell, R. Friese, A. A. Maciejewski, H. J. Siegel, J. Potter, and J. Smith, “A demonstration of a simulation tool for planning robust military village searches,” Huntsville Simulation Conference (HSC‟10), Oct. 2010. [7] V. Shestak, J. Smith, A. A. Maciejewski, and H. J. Siegel, “Stochastic robustness metric and its use for static resource allocations,” Journal of Parallel and Distributed Computing, Vol. 68, No. 8, Aug. 2008, pp. 1157-1174. [8] P. Maxwell, H. J. Siegel, and J. Potter, “The ISTeC People-Animal-Robots laboratory: Robust resource allocation,” 2009 IEEE Int‟l Workshop on Safety, Security, and Rescue Robotics, Nov. 2009. [9] Environmental Systems Research Institute, “ESRI ArgGIS10,” http://www.esri.com /software/arcgis/arcgis10/, accessed Feb. 1, 2011. [10] United States Coast Guard, Search and Rescue Optimal Planning System (SAROPS), http://www.uscg.mil/acquisition/ international/sarops.asp, accessed Jan. 28, 2011. [11] SAR Technology Inc. SAR Technology: „Incident Commander Pro‟, http://sartechnology.ca/sartechnology/ ST_ProgramOverview.htm, accessed Jan. 28, 2011.
[12] G. Qin, Q. Li, and X. Deng, “Aided plan and optimization of road routing in cooperative multitransportation system,” 2008 International Conference on Modeling, Simulation, and Visualization Methods (MSV‟08), Jul. 2008. [13] F. Tang, A. Ren, A. Fu, and Z. Xu, “An integrated simulation framework for evacuation dynamics with CAD, GIS, and VR views,” 2010 International Conference on Modeling, Simulation, and Visualization Methods (MSV‟10), Jul. 2010. [14] M. A. Salam, O. M. Soysal, and H Schneider, “Integration of wireless sensor networks in geographical information systems: a survey,” 2010 International Conference on Modeling, Simulation, and Visualization Methods (MSV‟10), Jul. 2010. [15] Qt – Cross-Platform application and UI framework, http://www.qt.nokia.com, accessed Sep. 10, 2009. [16] United States Army Corps of Engineers, Engineering Research and Development Center, http://www.erdc.usace.army.mil, accessed Feb. 10, 2011. [17] Shapfile C Library V1.2, http://shapelib.maptools.org, accessed Sep. 15, 2009. [18] D. Eberly, Geometric Tools, http://www.geometrictools.com/Documentation/Triangulation ByEarClipping.pdf, accessed Oct. 8, 2010. [19] P. Maxwell, A. A. Maciejewski, H. J. Siegel, J. Potter, and J. Smith, “A mathematical model of robust military village searches for decision making purposes,” 2009 International Conference on Information and Knowledge Engineering (IKE‟09), Jul. 2009, pp. 311-316.