(IJACSA) International Journal of Advanced Computer Science and Applications, Vol. 7, No. 6, 2016
A Hybrid Data Mining Approach for Intrusion Detection on Imbalanced NSL-KDD Dataset Mohammad Reza Parsaei 1*, Samaneh Miri Rostami 2, Reza Javidan 3 1, 2, 3
Faculty of Computer Engineering & IT Shiraz University of Technology Shiraz, Iran
Abstract—Intrusion detection systems aim to detect malicious viruses from computer and network traffic, which is not possible using common firewall. Most intrusion detection systems are developed based on machine learning techniques. Since datasets which used in intrusion detection are imbalanced, in the previous methods, the accuracy of detecting two attack classes, R2L and U2R, is lower than that of the normal and other attack classes. In order to overcome this issue, this study employs a hybrid approach. This hybrid approach is a combination of synthetic minority oversampling technique (SMOTE) and cluster center and nearest neighbor (CANN). Important features are selected using leave one out method (LOO). Moreover, this study employs NSL KDD dataset. Results indicate that the proposed method improves the accuracy of detecting U2R and R2L attacks in comparison to the baseline paper by 94% and 50%, respectively. Keywords—intrusion detection system; feature selection; imbalanced dataset; SMOTE; NSL KDD
I.
INTRODUCTION
With the advance of computer science and network technology, access to internet has become an important part of people’s daily life. Moreover, the number of individuals connecting to the internet is increasingly growing and this makes network security a challenging issue. Previously, authentication, data encryption, and firewall techniques were used to protect the security of computers [1]. Today intrusion detection systems (IDSs) are used to protect computer systems from the risk of threats. Generally, IDSs divide into signature-based and anomaly based detection. In signature-based detection, packets are scanned to search for a set of events previously detected as attacks. However, in anomaly-based detection, intrusion detection systems exploit behavior patterns. In fact, a profile of normal behavior is created and any deviation from this behavior is considered an anomaly. Initial intrusion detection systems widely used signature-based intrusion detection methods. However, they had a high false alarm rate. Thus recent methods are based on behavior modeling and employ data mining methods, statistical analyses, and artificial intelligence techniques to detect anomalies [2, 3]. At initial stages, most intrusion detection studies employed rule-based expert systems and statistical approaches [4]. But with advent of larger datasets the results of rule-based expert systems and statistical methods became challenging issue. Therefore, several data mining techniques were introduced to overcome this problem [5, 6].
Recently, a combination of techniques is exploited to improve detection rate and accuracy of IDSs [7, 8]. Shin, Lee, Kim, and Kim in [9] introduced a novel probabilistic approach to forecast and detect network intrusions. In this approach a Markov chain was used for probabilistic modeling of abnormal events in network systems. This is done by performing Kmean clustering, and introducing the concept of an outlier factor. Result showed that the proposed approach achieves high detection performance. In recent years, due to the large data sets related to intrusion detection, feature selection methods (FS) are taken into consideration. FS is a process of choosing an optimal subset of features that represents the whole dataset [10]. Canedo, Marono, and Betanzos [11] proposed a new combinational method of discretization, filtering and classification which is used as an FS to improve the classification task, and they applied this method on the KDD Cup 99 dataset. Lin, Ying, Lee, and Lee [12] presented an intelligent algorithm which was applied to anomaly intrusion detection. It used simulated annealing (SA) and support vector machine (SVM) to find the best feature subsets, while SA and DT were proposed to generate decision rules to detect new attacks. Eesa, Orman, and Brifcani [10] proposed a new feature-selection approach based on the cuttlefish optimization algorithm (CFA) in order to improve performance of intrusion detection systems (IDSs). In this paper CFA used as a feature selection tool and the decision tree (DT) classifier as an evaluator on the selected features that are produced by the CFA. The performance of the proposed approach is evaluated through well-known KDD’99 data set. The results show that the feature subset extracted based on CFA gives a higher detection rate and accuracy rate with a lower false alarm rate compared to the obtained results using all features. Several studies are done in this scope but there is no exact answer which features subsets are optimal or more representative. Also, the time taken for training the systems and for the detection task to further validate their systems is not considered in many evaluation methods. Recent systems that combine or integrate multiple techniques require much greater computational effort. As a result, this can degrade the efficiency of ‘on-line’ detection [1]. Lin, Ke, and Tsai in [1], tried to eliminate these limitations by combining Kmean clustering and 1-NN search algorithm. Also, execution time is reduced considerable. This approach named CANN (cluster center and nearest neighbor) is a basis
*Corresponding author:
[email protected] 20 | P a g e www.ijacsa.thesai.org
(IJACSA) International Journal of Advanced Computer Science and Applications, Vol. 7, No. 6, 2016
of this paper and will introduce later in detail. But a drawback of this approach is its poor capability in detecting U2R and R2L attacks. In some studies, overall detection accuracy was measured and showed high DR rate, but the accuracy of each attack class was not provided separately [13-15]. So, decide whether these methods are able to detect U2R and R2L attack classes are not possible.
value of the initial vector [19]. The new feature vector is calculated as follow: X n X O X oi X O
(1)
Where, is the new synthetic instance, is the feature vector of each instance from the minority class, is the th selected nearest neighbor for and δ is a random number between 0 and 1.
The number of records in the R2L and U2R attack classes is very smaller than that of normal and other attack classes in datasets, which leads to an imbalanced problem. Each dataset with a significantly uneven data distribution between its classes can be considered an imbalanced set. Particularly, this imbalance is considered a between-class imbalance in which one class has much less instances than other classes. Classification of an imbalanced data set is a challenging issue for researchers. Most standard data mining techniques consider balanced data set and when they work with imbalanced data set, results are biased toward numerous majority class samples. So the accuracy of classification for majority class is high and is low for minority class [16].
Producing random instances for nominal features is as follows [20]: first the majority vote method is used among nominal features of the considered instance and its k nearest neighbors. If equal, one is selected randomly. In the next stage, the selected values are considered as the synthetic instance.
Khor, Ting, and Amnuaisuk in [17] used under-sampling and oversampling methods to mitigate the rare class problem. First the dominant classes, i.e. Normal and DoS were undersampled to balance the class and then used SMOTE for oversampling decreased dataset. Then the improved data set was evaluated by major learning algorithms such as Naïve Bayes Classifier, Bayesian Networks, and Decision Trees algorithms such as ID3, C4.5 and Classification and Regression Trees (CART). But these two methods were less effective in mitigating the problem because there is no significant improvement on detecting R2l and U2R.
Next step is to measure and sum the distance (dis1) between all data of the given dataset and the cluster centers and the distance (dis2) between each data point and its nearest neighbor in the same cluster. This leads to a new distance based feature value to represent each data point of the given dataset. These two distances are added according to equation 2 and a new feature is achieved.
This study aims to investigate the effect of SMOTE coupled with CANN approach which proposed by Lin et al. [1] to improve detection rate of low frequency attacks like R2L and U2R. The rest of this paper is organized as follows. Section II introduces SMOTE and CANN methods. Section III explains the dataset, LOO feature selection, and evaluation parameters. Section IV present the experiments. Finally, section V conclude the paper.
B. CANN (Cluster center and Nearest Neighbor) Lin et al. [1] proposed a novel feature representation approach, namely the cluster center and nearest neighbor (CANN) approach. It works based on two distance. Since cluster centroids are a good representation of the entire data, the data is first clustered by using Kmean to extract the cluster centroids.
Di
number of classes
distance Di , C j distance Di , N k
j 1 dis 1
INTRODUCTION OF SMOTE AND CANN METHODS
A. Synthetic Minority Oversampling Technique (SMOTE) Chawla, Bowyer, Hall, and Kegelmeyer [18] proposed a novel method called SMOTE to overcome the imbalanced data problem. SMOTE increases the number of minority instances by creating new synthetic instances instead of repeating minority samples. In this method, new synthetic instances are created based on two parameters, oversampling rate (%) and the number of K nearest neighbors. Creating new synthetic samples are related to features type (continues or nominal). If the features of the instance are continuous, the distance is calculated between the feature vector of a sample in the minority class and one of the k nearest neighbors. The computed distance is then multiplied by random number δ in range zero and one. Finally, the obtained value is added to the
dis 2
Where, is the ith records in the dataset, is the jth cluster centroid which is extracted by Kmean, and is the nearest neighbor of .Therefore, an n-dimensional records is converted to a single-dimensional one. After running the algorithm this new and one-dimensional distance based feature is used to represent each data sample for intrusion detection by a k-nearest neighbor (k-NN) classifier. III.
II.
(2)
k 1
IMPLEMENTATION
This study aims to improve the ability of intrusion detection systems in detecting U2R and R2L attacks by proposing a hybrid approach which is a combination of synthetic minority oversampling technique (SMOTE) and cluster center and nearest neighbor (CANN). Moreover, this study utilizes the NSL-KDD dataset. In this study the dataset with 41 datasets is first reduced to a smaller dimensional set with 21 features using LOO method. A. Dataset Statistical analyses on KDD CUP 99, showed that this dataset has weaknesses that effect on systems` performance. Its major weakness is its repetitive records, which causes a bias towards frequent data. After investigating and analyzing this set, it was known that 78% of the training data and 75% of the test data are repetitive [21]. Therefore, this study uses NSL
21 | P a g e www.ijacsa.thesai.org
(IJACSA) International Journal of Advanced Computer Science and Applications, Vol. 7, No. 6, 2016
KDD1 . The total number of records in this dataset is 125973, where 67343 records are normal data and the rest indicate attacks. The total number of features is 41, which include numeric, nominal, and binary features. Table I presents the features, as well as their types and numbers. TABLE I.
FEATURES OF NSL KDD DATASET AND THEIR TYPES AND NUMBERS
positive rate. More specifically, the classification algorithm is executed with and without each feature. If the four following conditions are satisfied, the corresponding feature is considered important and remains in the dataset. Accuracy reduction, FP reduction Accuracy reduction, increase in FP No change in accuracy, increase in FP
Type
Features with their numbers
Nominal
protocol_type(1), service(2), flag(4)
Binary
land(7), logged_in(12),root_shell(14), su_attempted(15),is_host_login(21), is_guest_login)22)
Numeric
duration(1), src_bytes(5), dst_bytes(6), wrong_fragment(8),36, 39, 40, 41. urgent(9), hot(10), num_failed_logins(11), C. Evaluation Parameters num_compromised(13), num_root(16), num_file_creations(17), num_shells(18), This study uses some assessment metrics such as accuracy, num_access_files(19), num_outbound_cmds(20), count(23) detection rate, and false alarm rate as evaluation parameters, srv_count(24), serror_rate(25), which are computed based on the confusion matrix in table III. srv_serror_rate(26), rerror_rate(27), srv_rerror_rate(28), same_srv_rate(29) diff_srv_rate(30), srv_diff_host_rate(31), TABLE III. CONFUSION MATRIX dst_host_count(32), dst_host_srv_count(33), dst_host_same_srv_rate(34), Predicted value→ Normal Attack dst_host_diff_srv_rate(35),dst_host_same_src_port_rate(36), Actual value dst_host_srv_diff_host_rate(37), dst_host_serror_rate(38), Normal TN FP dst_host_srv_serror_rate(39), Attack FN TP dst_host_rerror_rate(40), dst_host_srv_ rerror_rate(41)
Increase in accuracy, increase in FP The LOO algorithm is executed 41 times for the 41 features. Number of the resulted important features after executions is as follows: 1, 9, 10, 11, 12, 13, 14, 15, 17, 18, 21, 22, 25, 29, 30, 31, 32,
This dataset consists of five different classes, where one shows normal behavior and the rest indicate attacks. Attacks are categorized as DoS, Probe, R2L, and U2R. The test set consists of 22544 records. Table II presents the number of occurrences for each class in the test set. TABLE II.
THE NUMBER OF OCCURRENCES FOR NORMAL AND ATTACK CLASSES Class
Number of Samples
Normal DoS Probe R2L U2R Total
9711 7460 2421 2885 67 22544
Accuracy
TP TN TP TN FP FN
Detection Rate False Alarm
The training and test datasets include 21 and 37 different attacks, respectively. Some unknown attacks are placed in the test set which are not in the training set to evaluate the ability to detect these unknown attacks. B. Feature Selection Most fields in dataset are redundant. This number of dimensions increases the processing time and in some case degrade systems performance. This study by using leave-oneout (LOO) approach extracts important features from a total number of 41 features. The importance measure of each feature is evaluated based on the two parameters of accuracy and false 1
TP: The number of correctly detected attacks TN: The number of harmless application correctly recognized as harmless FP: The number of harmless applications falsely recognized as attacks FN: The number of attacks falsely recognized as normal.
http://www.unb.ca/research/iscx/dataset/iscx-NSL-KDD dataset.html
IV.
TP TP FP FP FP TN
(3)
(4)
(5)
EXPERIMENTS AND RESULTS
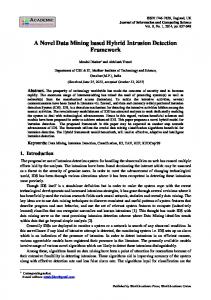
Figure 1 presents the proposed algorithm. First by using LOO, important features are extracted from the training dataset. Afterward, the training set is sampled 10 times, each time, the dataset is balanced using SMOTE method, and then CANN is used to classify the dataset and build a model. For evaluations, the test set is applied to the model and finally, the average of 10 executions is computed. This study uses 20% of NSL KDD dataset with stratified sampling. More specifically, each class is sampled in proportion to the percentage it covers in the original dataset. For instance, if class DoS covers 36% of NSL KDD records, the same percentage of records is still covered by the DoS class after sampling. Of course, due to the
22 | P a g e www.ijacsa.thesai.org
(IJACSA) International Journal of Advanced Computer Science and Applications, Vol. 7, No. 6, 2016
small number of R2L and U2R records, first they are all placed in the samples and then the other three classes were sampled.
Sampling was performed 10 times by changing the seed of the random number generator. Since samples are random, the accuracy of one execution of the algorithm on one set cannot be an indicator of its accuracy on the entire data. Therefore, sampling is repeated 10 times and 10-fold cross validation is used to evaluate each execution of the algorithm. The dataset used in this study is not the same as the baseline research [1]. In order to making the obtained results to be comparable with those of the baseline study, its experiments were implemented again using the considered dataset. Related codes were written using MATLAB and all data mining tasks were performed using WEKA 6 software. In [1], the experiment was conducted on two feature sets, once with 6 features and again with 19 features, where the latter improved the ability to detect U2R and R2L attacks. This study compared with proposed method with the CANN model with 19 features. Since training records are randomly selected, the algorithm`s accuracy changes for different records as the training set. A solution is to use probabilistic boundaries. Equation 6 shows that the probability that accuracy be in the confidence interval is 1-α. If random quantity { } has normal distribution with mean µ and standard deviation σ, the average sample obtained by random sampling with size n has a distribution with mean µ and standard deviation σ, which tends to a normal distribution by increasing n (equation 7). Therefore, equation 8 can be used to obtain the confidence interval for accuracy [22], where X is the mean accuracy of repeating the model by changing the seed of the random number generation and S is the standard deviation of accuracy for 10 executions.
C
Probability
~ N , Fig. 1. Proposed algorithm
NUMBER OF RECORDS IN NSL DATASET
Class
Normal
DoS
Probe
R2L
U2R
Total
Number of occurrence
67343
45930
11656
995
49
125973
Percentage
53.5%
36.5%
9.3%
0.8%
≈0%
100%
TABLE V.
THE DATASET AFTER SAMPLING
Class
Normal
DoS
Probe
R2L
U2R
Total
Number of occurrence
1269
9197
2344
995
49
25194
Percentage
50.1%
36.5%
9.3%
3.9%
0.2%
100%
C2 1 α
(6)
n
(7)
s s , X t X t 1 ;n 1 1 ; n 1 n n 2 2
Tables IV and V present the number of percentage of each class before and after sampling. TABLE IV.
μ
1
(8)
Since the seed of the random number generator is changed at each iteration and numbers are independent, we can assume that they have a normal distribution. Therefore, we can say that each iteration is performed independently and the achieved numbers have a normal distribution. Considering the 10 executions performed by changing the seed of the random number generator, tables VI and VII present the results. All parameter values are averaged over 10 executions. Since tests and measurements are performed under the same conditions, paired systems are used to compare the results of the two approaches. Accordingly, equation 8 can be used to compare the two methods [22]. With confidence degree α of 99% and considering the number of samples as n=10, t0/ 995;9 is 3.250. Confidence interval is obtained by replacing the mean and standard deviation S of the sample`s differences for each parameters. The zero in the confidence interval indicates that these two methods are not significantly different.
23 | P a g e www.ijacsa.thesai.org
(IJACSA) International Journal of Advanced Computer Science and Applications, Vol. 7, No. 6, 2016
As seen in table VI, in comparison to baseline paper [1] the proposed method has a better detection rate. However, its accuracy and false alarm rate are lower. But since the confidence interval includes zero, the different is not significant. As it was mentioned, 10 executions were performed and the table also presents the mean difference and standard deviation. TABLE VI.
THE MEAN PERFORMANCE OF THE APPROACHES
Accuracy =0.151,S=0.712
Detection rate =0.450, S=0.265
False Alarm =-0.036, S=0.063
CANN 19 features
99.13%
99.13%
0.602%
Proposed approach
98.99%
99.56%
0.557%
99% CI
-0.580,0.882
Subsequently, in order to evaluate the proposed method, the dataset was sampled 10 times by changing the seed of the random number generator. Furthermore, the number of U2R and R2L class instances were increased using SMOTE. The balanced dataset was then modeled by CANN and a singledimension dataset was extracted. At each execution of the algorithm, 10-fold cross validation was used for evaluations. Experimental results indicated that the proposed method outperforms the baseline approach regarding detection rate. However, it achieves lower accuracy and false alarm rate, which are not a significant difference. Results show that SMOTE coupled with CANN able to eliminate the limitation of the baseline research in detecting low-frequency attacks U2R and R2L and improves them by 94% and 50%, respectively. [1]
0.178,0.722
-0.100,0.028 [2]
TABLE VII.
THE COMPARISON OF THE ABILITY TO DETECT R2L AND U2R ATTACKS
[3]
Accuracy
CANN 19 features
Proposed approach
R2L
61.92 %
92.97%
U2R
28.7%
55.91%
[4]
[5]
Accuracy(%)
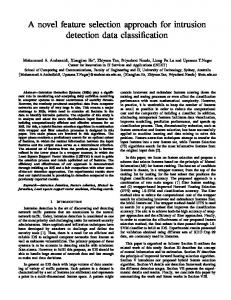
Table VII shows that the proposed method improves limitations in detecting U2R and R2L attacks. Moreover, figure 2 compares the accuracy of detecting U2R and R2L by the two approaches. 100.00% 90.00% 80.00% 70.00% 60.00% 50.00% 40.00% 30.00% 20.00% 10.00% 0.00%
[6] [7]
[8]
92.97%
61.92%
55.91%
28.71%
R2L
CANN 19 feature
Proposed Approach
U2R
[9]
[10]
[11]
Attack Fig. 2. The performance of the two methods in detecting U2R and R2L attacks
V.
[12]
CONCLUSION
Due to the rarity of U2R and R2L records and existing of the imbalanced dataset, detection of these classes by using conventional data mining approaches in intrusion detection became a challenging problem. This study aims to improve the ability of intrusion detection systems in detecting U2R and R2L attacks by exploiting SMOTE and creating a boundary margin for low frequency attack classes, coupled with the CANN technique, which is a combination of classification and clustering. Moreover, this study utilizes the NSL-KDD dataset. In this study the dataset with 41 datasets is first reduced to a smaller dimensional set with 21 features using LOO method.
[13]
[14]
[15]
REFERENCES W.CH. Lin, SH.W. Ke, and CH.F. Tsai, “CANN: An Intrusion Detection System Based on Combining Cluster Centers and Nearest Neighbors” Knowledge-Based Systems 2015. G.A. Marin, “Network security basics,” IEEE Security Privacy, Vol. 3, pp. 68-72, November/December 2005. M. R. Parsaei and M. Salehi “E-mail spam detection based on part of speech tagging,” In 2015 2nd International Conference on KnowledgeBased Engineering and Innovation (KBEI) (pp. 1010-1013). IEEE. C. Manikopoulos, and S. Papavassiliou, “Network intrusion and fault detection: A statistical anomaly approach,” IEEE Communications Magazine, vol. 40, pp. 76–82, 2002. P. Dokas, L. Ertoz, A. Lazarevic, J. Srivastava, and P. N. Tan, “Data mining for network intrusion detection,” Proceeding of NGDM, pp. 21– 30, 2002. S. Wu, and E. Yen. “Data mining-based intrusion detectors,” Expert Systems with Applications, vol. 36, pp. 5605–5612, 2009. X. Tong, and Z. Wang, H. Yu, “A research using hybrid RBF/Elman neural networks for intrusion detection system secure model”, Computer Physics Communications 180, pp. 1795–1801, 2009. G. Wang, J. Hao, J. Ma and L. Huang, “A New Approach to Intrusion Detection Using Artificial Neural Networks and Fuzzy Clustering,” Expert Systems with Applications, Vol. 37, No. 9, pp. 6225-6232, 2010. S. Shin, S. Lee, H. Kim, and S. Kim, "Advanced probabilistic approach for network intrusion forecasting and detection. Expert Systems with Applications, vol. 40, pp. 315-322, 2013. A.S. Eesa, Z. Orman, and A.M.A. Brifcani, "A novel feature-selection approach based on the cuttlefish optimization algorithm for intrusion detection systems," Expert Systems with Applications, vol. 42, pp. 2670-2679, 2015. V. Bolon-Canedo, N. Sanchez-Marono, and A. Alonso-Betanzos, "Feature selection and classification in multiple class datasets: An application to KDD Cup 99 dataset," Expert Systems with Applications, Vol. 38, PP. 5947–5957, 2011. S.-W. Lin, K.-C. Ying, C.-Y. Lee, and Z.-J. Lee, "An intelligent algorithm with feature selection and decision rules applied to anomaly intrusion detection," Applied Soft Computing, Vol. 12, pp. 3285–3290, 2012. Z.A. Baig, S.M. Sait, and A. Shaheen, "GMDH-based networks for intelligent intrusion detection," Engineering Applications of Artificial Intelligence, vol. 26, pp. 1731-1740, 2013. E. de la Hoz, E. de la Hoz, A. Ortiz, J. Ortega, and A. Martinez-Alvarez, "Feature selection by multi-objective optimisation: application to network anomaly detection by hierarchical self-organising maps," Knowledge-Based Systems, vol. 71, pp. 322-338, 2014. G. Kim, S. Lee, and S. Kim, "A novel hybrid intrusion detection method integrating anomaly detection with misuse detection," Expert Systems with Applications, vol. 41, pp. 1690-1700, 2014.
24 | P a g e www.ijacsa.thesai.org
(IJACSA) International Journal of Advanced Computer Science and Applications, Vol. 7, No. 6, 2016 [16] H. He, E.A. Garcia, "Learning from Imbalanced Data," IEEE Transactions on Knowledge And Data Engineering, vol. 21, no. 9, pp. 1263–1284, 2009. [17] K-C. Khor, C-Y. Ting, and S. P-Amnuaisuk, “The effectiveness of sampling methods for the imbalanced network intrusion detection data set,” In Recent Advances on Soft Computing and Data Mining, pp. 613– 622. Springer, 2014. [18] N. Chawla, K. Bowyer, L. Hall, W.P. Kegelmeyer, SMOTE: synthetic minority over-sampling technique, J. Artif. Intell. Res. Vol. 16, pp. 321– 357, 2002. [19] N.V. Chawla, A. Lazarevic, L.O. Hall, K.W. Bowyer, “SMOTEBoost: improving prediction of the minority class in boosting, in: Proceedings of the 7th European Conference on Principles
and Practice of Knowledge Discovery in Database, pp. 107–119, 2003. [20] A. Lazarevi ´ c, J. Srivastava, V. Kumar, Tutorial: data mining for analysis of rare events: a case study in security, financial and medical applications, in: Proceeding of Pacific-Asia Conference Knowledge Discovery and Data Mining, 2004. [21] M. Tavallaee, E. Bagheri, Wei Lu, and A. Ghorbani,“ A Detailed Analysis of the KDD CUP 99 Data Set ”, computational intelligence for security and defense applications,2009. [22] R. Jain, “The Art of Computer Systems Performance Analysis: Techniques for Experimental Design, Measurement, Simulation, and Modeling” New York: Wiley-Interscience, 1991.
25 | P a g e www.ijacsa.thesai.org