School of Medical and Surgical Sciences, University of Nottingham, Nottingham, UK. 5. Department of .... monitoring approach simulated an online patient monitoring ..... Division of Academic Radiology, School of Medical and. Surgical ...
A Knowledge-Based Electrocardiogram-Monitoring System for Detection of the Onset of Nocturnal Hypoglycaemia in Type 1 Diabetic Patients C Alexakis1,4, M Rodrigues1, R Saatchi1, HO Nyongesa1,5, C Davies2 RH Ireland2, ND Harris2,3, SR Heller2 1
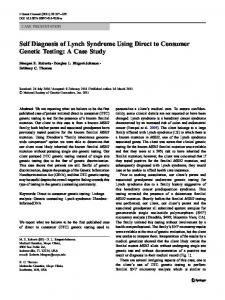
Materials and Engineering Research Institute, Sheffield Hallam University, Sheffield, UK 2 Department of Medicine, University of Sheffield, Sheffield, UK 3 School for Health, University of Bath, Bath, UK 4 School of Medical and Surgical Sciences, University of Nottingham, Nottingham, UK 5 Department of Computer Science, University of Botswana, Gaborone, Botswana undisturbed bed the following morning. There was no brain damage, a symptom of profound hypoglycaemia, hence the deaths were caused by a different mechanism. One possibility is that the deaths were due to a fatal cardiac arrhythmia. It has been shown that experimental hypoglycaemia prolongs ventricular repolarisation (VR), a situation associated with ventricular arrhythmias [2]. A single lead from the 3-lead orthogonal ECG was used for the purposes of this research. An illustration of an ECG cycle is presented in figure 1. The T Fig 1: an ECG cycle wave corresponds to the ventricular repolarization of the myocardium. During hypoglycaemia, the counter-regulatory responses cause the release of adrenaline and a fall in potassium, which delays repolarisation. These changes may be reflected on the ECG by changes in T wave morphology. If these changes can be automatically identified it may provide a warning of hypoglycaemia or of a potentially proarrhythmogenic condition.
Abstract Nocturnal hypoglycaemia has been implicated in the sudden deaths of young people with diabetes. Experimental hypoglycaemia has been found to prolong the ventricular repolarisation and to affect the T wave morphology. It is postulated that abnormally low blood glucose could in certain circumstances, be responsible for the development of a fatal cardiac arrhythmia. We have designed a monitoring and alarm system for detection of the onset of spontaneous nocturnal hypoglycaemia through monitoring of the electrocardiogram. The system incorporates expertknowledge in the form of a rule-base. It performs monitoring of two ECG features and raises alarms if abnormalities are detected corresponding to hypoglycaemia. The top performance of the system is 100% and 91.30% for sensitivity and specificity respectively. This study supports the hypothesis proposing a relationship between cardiac function and abnormally low blood glucose.
1.
Introduction & background
The aim of this work is to detect the onset of nocturnal hypoglycaemia indirectly through analysis of the electrocardiogram (ECG) of Type 1 diabetic patients. In order to achieve this, ECG feature extraction is performed and the features produced are monitored over time for detection of abnormal changes related to hypoglycaemia. Nocturnal hypoglycaemia has been implicated in the sudden deaths of individuals with Type 1 diabetes, particularly those between the ages of 15 to 40 years old, a syndrome known as “Dead in Bed” [1]. The mechanism and cause of such deaths remains unclear. Those affected were well the night before and were found dead in an
ISSN 0276−6547
2.
Methods
2.1.
Data acquisition
The data used in this study consisted of both the ECG traces and their corresponding blood glucose levels. They were obtained from 19 Type 1 diabetic patients over 32 nights, with mean (sd) age 36.4 (14.56), recruited from secondary care diabetic clinics in Sheffield. The ECG
5
Computers in Cardiology 2006;33:5−8.
data were recorded in the patient’s own environment by a custom-built system that captures data from the YY’ orthogonal lead [3]. One-minute recordings were captured every 15 minutes. Blood glucose was recorded by an implantable glucose sensor (CGMS, MiniMed Inc.) [4] that measures glucose in the subcutaneous tissue every 5 minutes. The above acquisition was carried out for two successive nights and produced a data-set of paired ECGglucose readings.
2.2.
ECG
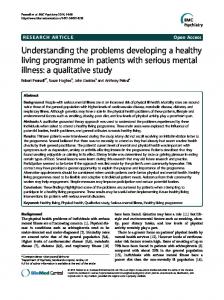
ECG features Fig 2: ECG monitoring system
Two ECG features were used: the T wave amplitude (T-ampl) and a time interval feature (RTc), describing the VR duration. RT is the time interval from the R peak up to the T-end. This was corrected for heart rate using Bazett's formula (RTc = RT/√RR) [5] to produce the RTc feature where the suffix "c" stands for "corrected". The end of the T wave was detected using the tangent method [6]. The RT interval was chosen for this study, instead of the QT, since R point detection is more straight-forward than Q point detection, especially in the presence of noise. Moreover the RT interval still describes the process of ventricular repolarisation satisfactorily. The RT has been used before [7] but to a lesser extent than the QT.
2.3.
The time-series of the two ECG features described previously (RTc and T-ampl) were the inputs to the monitoring system. The data used were offline but the monitoring approach simulated an online patient monitoring scenario. The approach reflected a situation where a patient would be monitored online by the bedside.
2.5.
During the monitoring process, abnormal changes in feature value as time elapsed were detected by comparison to an adaptive threshold. This threshold was based on a moving average (MA) value. A moving window was used containing a few samples prior to the current time instant. This was combined with a moving value of the standard deviation (MSD), calculated from the same moving window, to define an accepted range of feature values. The equation of the MA filter used is given below in its generic form for nth order:
Hypoglycaemic threshold
A glucose concentration threshold of 2.5 mmol/l was used to define hypoglycaemia. ECG traces corresponding to glucose equal or below 2.5 mmol/l were classed as arrhythmic (hypoglycaemic) while those corresponding to glucose values greater than 2.5 mmol/l were classed as normal (euglycaemic).
2.4.
KBS adaptivity
n ∑ x (k − i ) + n i =1 eq 1a , for n < k n, k ∈ ℵ k −1 n x (k ) = x ( k − i ) ∑ i =1 + + n , for n ≥ k n ∈ ℵ , k ∈ ℵ ∧ k > 1 eq 1b k −1 eq n 1c 0, for k = 1
Knowledge-based classifier
We have developed the software engine for a prototype system used for ECG interpretation. The system is designed to raise alarms if abnormal cardiac events, related to hypoglycaemia are detected. It comprises an ECG pre-processor, a feature extractor and a knowledgebased system (KBS). The monitoring system is depicted in figure 2. At each sampling instant the ECG is fed to the preprocessing stage where a number of filtering steps (notch filtering, baseline wandering removal, signal averaging etc) are carried out. Next, the filtered ECG is passed to the feature extraction stage where the ECG features are extracted. The ECG features are then fed to the KBS that infers, using the rule-base, whether they correspond to a normal or abnormal ECG cycle. The system uses ECG features from the current, as well as previous ECG cycles to make a decision on whether to raise an alarm or not.
x(k) is the raw feature value at sample k, and x (k ) is the MA filtered version. The equation for the calculation of MSD is given below in its generic form for nth order:
∑
n 2 ( x ( k − i ) − x (k )) i =1 , for n < k n −1 k −1 y ( k ) = ( x ( k − i) − x ( k )) 2 i =1 , for n ≥ k ( k − 1) − 1 0, for k ∈ {1, 2}
∑
n, k ∈ ℵ eq 2 a + + n n ∈ ℵ , k ∈ ℵ ∧ k > 2 eq 2b eq n 2c +
n
x(k) is the raw feature value at sample k and x (k ) is the MA value at sample k calculated from the moving window that spans up to x(k-1). y(k) is the standard
6
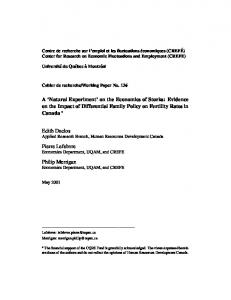
raised, with zero denoting no alarm raised. Finally the fourth column provides an assessment of the performance. The number in brackets denotes the deviation of the alarm from the actual onset, i.e. TP(3) denotes an alarm raised 3 samples away from the hypoglycaemic onset. Such cases are marked in bold.
deviation of the feature values that lie in the moving window. This standard deviation is not the deviation from a static mean but the deviation from the moving average.
2.6.
Rule-base
The knowledge-base for the KBS is a set of rules generated from observations of ECG changes under hypoglycaemia, within guidelines provided by clinical experts. The rule-base consisted of eight rules. The two principal rules used for monitoring are presented below: 1. IF (T-ampl is flattened) and (T-ampl_prev is flattened) and (RTc is prolonged) and (RTc_prev is prolonged) THEN (DiabeticState is hypoglycaemic) 2. IF (T-ampl is normal) or (T-ampl_prev is normal) or (RTc is normal) or (RTc_prev is normal) THEN (DiabeticState is euglycaemic) The suffix "_prev" stands for previous sample before the current one. The above rules summarize the knowledge of the rule-base and are given for illustration only. The actual rules were formulated differently but convey the same information as the above two.
2.7.
Table 1: monitoring results patient p201Anght1 p201Anght2 p202A p202 p203nght1 p203nght2 p204 p205nght1 p205nght2 p207nght1 p207nght2 p208nght2 p209nght1 p209nght2 p210 p212nght1 p212nght2 p215nght1 p215nght2 p218Anght1 p218Anght2 p221 p222 p227nght1 p227nght2 p230nght1 p231nght1 p231nght2 p232nght1 p232nght2 p244nght1 p244nght2
Assessment of performance
Two definitions of true-positives (TP) were used to assess the performance of the system: i. Each hypoglycaemic night monitored, was assessed as TP if hypoglycaemia was detected at the exact time it occurred during the night. ii. Each hypoglycaemic night monitored, was assessed as TP if hypoglycaemia was detected within an hour from the time it occurred during the night. (One hour is equivalent to 4 samples since data was sampled every 15 minutes.) Each hypoglycaemic night monitored was assessed as false-negative (FN) if hypoglycaemia was not detected, that is no alarm raised. Each euglycaemic (i.e. normal) night monitored correctly was a true-negative (TN) and each euglycaemic night where a false-alarm was raised was a false-positive (FP). After performing monitoring on all nights the accuracy, sensitivity and specificity, over all nights, were calculated by the formulas: n � accuracy = TP + TN / (TP+TN+FP+FN) (eq 3) � sensitivity = TP / (TP + FN) (eqn 4) � specificity = TN / (TN + FP) (eqn 5) Using the two different definitions for TP yields two pairs of results for the above metrics.
3.
Results
gl