some software, stained-glass-style images are created by us- ing the mosaicing ... software packages also have the ability to create mosaic images (e.g. Adobe.
EUROGRAPHICS 2002 / I. Navazo Alvaro and Ph. Slusallek
Short Presentations
A Method for Creating Mosaic Images Using Voronoi Diagrams Yoshinori Dobashi† ,
Toshiyuki Haga†† ,
† Hokkaido
University
Henry Johan†† , †† The
Tomoyuki Nishita††
University of Tokyo
Abstract This paper proposes a non-photorealistic rendering method that creates an artistic effect called mosaicing. The proposed method converts images provided by the user into the mosaic images. Commercial image editing applications also provide a similar function. However, these applications often trade results for low-cost computing. It is desirable to create high quality images even if the computational cost is increased. We present an automatic method for mosaicing images by using Voronoi diagrams. The Voronoi diagrams are optimized so that the error between the original image and the resulting image is as small as possible. Next, the mosaic image is generated by using the sites and edges of the Voronoi diagram. We use graphics hardware to efficiently generate Voronoi diagrams. Furthermore, we extend the method to mosaic animations from sequences of images. Categories and Subject Descriptors (according to ACM CCS): I.3.3 [Computer Graphics]: Picture/Image GenerationI.3.8 [Computer Graphics]: Applications
1. Introduction As computers become more popular, non-specialists are increasingly using computer graphics applications to create synthetic images. Therefore, some commercial image editing applications are widely used. Such applications provide a variety of functions for creating many effects. One of the available functions converts images into mosaic images. In some software, stained-glass-style images are created by using the mosaicing function. However, the features of the original image are often lost with the previous methods. It is therefore desirable to create high quality images. In this paper, we propose a method for creating mosaic images with a higher quality than currently available methods offer. In our method, the shapes of small regions in the mosaic image are approximated by using Voronoi diagrams. To create the Voronoi diagrams, we make use of graphics hardware. Recently, computer prices have dropped and high performance graphics hardware has become affordable and popular. This hardware can be utilized for fast generation of the Voronoi diagrams 2 . This results in decreased computation time for the image generation processes. c The Eurographics Association 2002. �
Our method consists of two processes. In the first process, the mosaic image is automatically generated by creating the optimal Voronoi diagram so that the error between the original image and the resulting image becomes as small as possible. The second process allows the user to add various effects to the mosaic image created by the first step. The second process is designed in accordance with our obsevation of stained glass windows since stained glass is one of the applications that use mosaic images. One important feature is that there are color variations in each region of the stained glass. In previous methods, however, each tile in the mosaic image has a single color. Moreover, contours of pictures depicted in windows are expressed by using boundaries between glass sections. The second process of our method provides ways to add these two visual effects, that is, edge enhancement and color variations in each tile. Furthermore, we extend the proposed method to creating mosaic animations. We have adopted the key frame method to preserve coherence and to keep the computational cost low. The rest of the paper is organized as follows. In Section 2, previous work relating to our method is described. In Sec-
Dobashi, Haga, Johan, Nishita / Mosaic Images Using Voronoi Diagrams
tions 3, 4 and 5, our method for converting a single image into a mosaic image is presented. Next, Section 6 describes how the method is applied to creating the mosaic animations. Example images generated by our method are presented in Section 7. Finally, conclusions are discussed in Section 8. 2. Related Work Recently, many researchers have focused on the field of nonphotorealistic rendering, and many methods for creating a wide range of image styles have been proposed 5 . Some of them represent a picture by laying out small tiles. The resulting image is called a mosaic image. Mosaic images can be represented by tiling particular shapes such as squares. An interesting artistic effect is created by mosaic images. So, much research focusing on creaing mosaic images has been done 7, 2 . These methods use Voronoi diagrams to represent small regions in the mosaic images. Many software packages also have the ability to create mosaic images (e.g. Adobe Photoshop9 and GIMP10 ). These compute the shape of each region automatically. However, the resulting images lose important features of the input image. To address this problem, Hausner proposed a method for simulating decorative mosaics by using Voronoi diagrams. Especially, in the mosaic images created by this method the edges in the original image are very well preserved. However, this method does not take into account the difference in color between the original and the resulting image. Furthermore, their method requires users to specify curves that correspond to the edges to be preserved. Our method creates the mosaic images automatically by optimizing the Voronoi diagrams so that the color difference is as small as possible. Therefore, our method can create mosaic images that preserve the features of the original such as edges and color variations. This makes it possible to faithfully reflect the features of the input image Voronoi diagrams have been used in several methods that do not focus on non-photorealistic rendering. Although these methods are similar to ours, their purposes are different. Darsa and Costa proposed a method that is suitable for ray tracing and data transfer on the web 8 . In this method, the Voronoi diagrams are used for progressive sampling of images. Hierarchical structures for the images are also constructed by this method. In this method, however, the differences between coarse and dense parts of the site densities are wide, and contours are not depicted in the resulting image. Miyata et al. proposed an automatic method for modeling organic surface textures (for example, reptile scales) by using Voronoi diagrams6 . 3. Creation of Mosaic Images 3.1. Definition of Voronoi Diagrams As shown in Figure 1, a Voronoi diagram of a set of "sites" (points) is a collection of regions that divide up the plane. Each region ("Voronoi region") corresponds to one of the
Figure 1: Voronoi diagrams. sites, and all the points in one region are closer to the corresponding site than to any other site. The boundary (i.e. "Voronoi edge") between two adjacent regions is a line segment, and the line that contains it is the perpendicular bisector of the segment joining the two sites. For efficient computation, the proposed method uses discrete Voronoi diagrams in which the sites are located at pixel centers. We utilize a fast method using graphics hardware for computing the discrete Voronoi diagrams1, 2 . This method can compute the discrete Voronoi diagrams by drawing cones using graphics hardware. For more detail, this hardware-accelerated method is well described in the literatures 1, 2 . 3.2. Outline of the Proposed Method Before we describe the outline of the algorithm, we first define some terms. A "Voronoi image" is an image being generated by using Voronoi regions. A "reference image" is the image to be converted into the mosaic image. Ecolor is the sum of the squared differences between the colors of the corresponding pixels in the Voronoi image and the reference image (Equation 1). � �2 V R − P(x,y,c) , (1) Ecolor = ∑ ∑ ∑ P(x,y,c) x
V
y
c
R
where P and P are the pixels in the Voronoi image and the reference image, respectively. Subscripts x and y mean pixel position, and subscript c represents pixel color where c is equal to an R, G, B triplet. We assume that the site of a Voronoi diagram is located at the center of a pixel and the color of that pixel in the reference image is used as the color of that Voronoi region. The proposed method consists of two processes: the pattern generation process, and the effect addition process. In the pattern generation process, the mosaic image is generated automatically. In the effect addition process, the user adds some effects interactively to produce the final image. In the pattern generation process, the Voronoi sites are placed at the pixel centers, and the Voronoi image that approximates the reference image is created automatically. First, a Voronoi image whose initial site positions are set at c The Eurographics Association 2002. �
Dobashi, Haga, Johan, Nishita / Mosaic Images Using Voronoi Diagrams
the center of hexagonal lattices is made and Ecolor is calculated (Section 4.1). Next, the sites are moved in order to decrease the value of Ecolor . These processes are repeated until an end condition is satisfied. In each iteration, the movement of the site is limited to its adjoining eight pixels. Hence the site is not moved if it does not decrease the value of Ecolor . To speed up the process, the sites are moved in two steps. First, the changes of the Voronoi regions corresponding to the site movements are roughly computed for all sites. All the sites are then moved simultaneously in order to decrease the Ecolor value (Section 4.2). Second, the change of a Voronoi region when its site moves is accurately computed. Then, the site is moved in the optimal direction so that the value of Ecolor decreases. This computation is performed for each site, one at a time (Section 4.3). By performing these processes, a Voronoi image that minimize Ecolor is obtained. In the effect addition process, an analytical Voronoi diagram is calculated based on the sites obtained in the pattern generation process. Then, some effects are added by using the Voronoi edges.
(a)
(b)
(d)
(c)
(e)
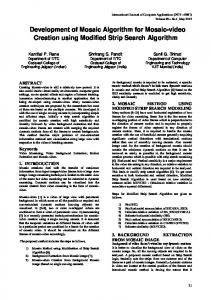
Figure 2: The resutls of several steps of the patttern generation process, (a):the reference image, (b): initial positions of the sites(Section 4.1), (c):captureing the global features (Section 4.2), (d): local adjustment (Section 4.3), (e): final image (Section 5.2).
The proposed method is summarized as follows. Generating pattern 1. The locations of the sites are initialized and the initial Voronoi image is generated (Section 4.1). 2. Set the four maps as textures. 3. All sites are moved in order to capture the global features of the reference image (Section 4.2). 4. Each site is moved individually in order to locally adjust the Voronoi image (Section 4.3). 5. If it is necessary, the fine adjustment of the Voronoi image is done by interactively moving, adding, or deleting sites (Section 4.4). Adding effects 1. An analytical Voronoi diagram is calculated using the site positions obtained in the pattern generation process, and the Voronoi edges are obtained (Section 5.1). 2. Two visual effects (emphasizing the outlines and color variations in each Voronoi region) are added interactively (Section 5.2). The following two sections describe all the above steps in details. 4. Pattern Generation Process Figure 2 shows the results of each step of the pattern generation process. 4.1. Initial Positions of the Sites The initial Voronoi image is created by placing its sites on the center of hexagonal lattices. The resulting Voronoi imc The Eurographics Association 2002. �
Figure 3: Variation in the initial positions of the sites. age depends on the expected interval of sites. The user is allowed to specify the expected interval between the sites and the expected jittering width (from the center of the hexagonal lattices) in order to control the appearance of the initial Voronoi image (see Figure 3). Moreover, the user can interactively specify regions and partially change the densities of the sites in those regions. As a result, the details of the reference image can be expressed easily. 4.2. Capturing the Global Features of the Reference Image In order to minimize the error Ecolor in a short amount of computation time, the changes due to moved Voronoi regions are approximately computed, and all sites are then moved together. These steps are repeated until an end condition is triggered. As a result, a Voronoi image that expresses the global features of the reference image can be obtained. Before we explain our approach in detail, we first describe the case when sites are moved in a brute force manner. The shape of a Voronoi region is determined by the relative position between its site and the sites of the surrounding Voronoi regions (bold line region in Figure 4(a)). Assume
Dobashi, Haga, Johan, Nishita / Mosaic Images Using Voronoi Diagrams
(a)
(b)
(c)
Figure 4: Approximated computation for changes in the Voronoi region, (a): the Voronoi region before moving, (b): the movement of the sites, (c): the Voronoi region after moving.
that all sites are moved independently (Figure 4(b)). In order to compute an accurate Voronoi region (slashed line region in Figure 4(c)), the movements of the one site and its surrounding sites have to be considered. However, since we have to consider the movement of the sites in all directions, the computational cost becomes enormous. Therefore, to speed up this process, we propose a method which approximately computes the changes of error caused by the movement of the sites. If the change in Ecolor is known when a site is moved, we can simply move the site in a direction where the Ecolor decreases the most. Note that computing the change of Voronoi regions, which is necessary when computing the change of Ecolor , is equivalent to computing the status of each pixel in the image when a site is moved in a particular direction. For example, when site S moves in a certain direction, pixel P1 is now included inside the Voronoi region of S, pixel P2 remains inside the area of S, and pixel P3 leaves the area of S. To approximate the change of the Voronoi region due to the movement of its site, we make the following assumption. When a site moves in a certain direction (the movement of neighbouring sites is ignored), the corresponding Voronoi region moves in the same direction without changing its shape (gray area in Figure 4(c)). Moreover, because the movement of the site at one time has been limited only to the adjoining eight pixels as described in Section 3.2, the change in Ecolor can be computed at low cost. In other words, based on the above assumption, for all pixels in the image, by only comparing a certain pixel’s color with the colors of the adjoining eight pixels, the change in Ecolor due to the movement of all sites in all directions can be computed. So, all we have to do now is to scan the Voronoi image once using a 3 × 3 window. We explain this in detail by using Figure 5. Assume that P is the pixel of interest and S1 , S2 and S3 are sites which are close to P. Let dEi, j be the change in Ecolor when site Si is moved in direction D j ( j = 1, 2, · · · , 8). The pixels inside the rectangle (3 × 3 pixels) that is drawn with the same color as P are the ones to be compared to P. P is located in the area of S2 . Similarly, the three pixels on
Figure 5: The calculation for the change of Ecolor . the top of P, upper right to P, and right to P are also located in the area of S2 . Therefore, P remains inside the area of S2 if S2 moves to one of the three pixels, that is, the pixel under S2 , the pixel on the left of S2 , or the pixel on the right of S2 . On the other hand, if S2 moves in other directions, then P exits the area of S2 . Using this information, the values of dE for S2 are updated. The change of the error value is computed using the reference table which stores the squared differences between colors. dE is updated by adding the computed change of the error value. The pixel to the lower right and the pixel under P are located in the area corresponding to S3 . As a result, when S3 moves upward or to the upper left, P becomes the pixel inside the area of S3 . Therefore, the values of dE corresponding to these movements are also updated. Other cases are also computed similarly. When the above computation is performed on all pixels, the values of all dEi, j , that is, the change in the difference Ecolor when site Si moves in direction D j , are completely computed. Then, each site is moved in the direction that minimizes the value of dE. The steps for moving all the sites can be summarized as follows. 1. Assign different colors to all sites and create the Voronoi image by using graphics hardware (see reference2 ). 2. Read the Voronoi image from the frame buffer. 3. Approximately compute the change of Ecolor (value of dE) when all sites are moved to their adjoining eight pixels and determine the optimal direction where Ecolor decreases the most. 4. Move all the sites by using the optimal direction of each site. To capture the global features of the reference image, the above computation is performed repeatedly. Since the computation of the change of Ecolor is only approximate, there is a possibility that the location of the sites do not converge. In other words, the sites are sometimes vibrating inside certain regions. Therefore, the above computation is terminated if the rate of change of Ecolor is below a given threshold value. 4.3. Local Adjustment of the Voronoi Image Unlike the approach in Section 4.2, Voronoi sites are moved one at a time to adjust the local appearance of the Voronoi c The Eurographics Association 2002. �
Dobashi, Haga, Johan, Nishita / Mosaic Images Using Voronoi Diagrams
image. A site is moved to its adjoining eight pixels, and the changes in the color differences are computed for all the movements. Then, the site is moved in the direction where the color error (Ecolor ) decreases most. This computation is performed repeatedly on all the sites in the Voronoi image. However, it is computationally expensive to both calculate the Voronoi regions and read the Voronoi image from the frame buffer for each of the moving directions. Generally, the buffer reading operation can become a serious bottleneck with respect to computing time when using graphics hardware. Thus, we propose a method that can decrease both the frequency of reading from the frame buffer into main memory and the number of cones that are drawn to the frame buffer. A Voronoi region can be generated by drawing each cone whose apex is the Voronoi site1, 2 . However, it is computationally expensive if we draw all the Voronoi regions every time according to each movement of the Voronoi site. So we use the stencil buffer, which is usually used as a mask, as a buffer to memorize the Voronoi regions of the moving Voronoi site. For all Voronoi sites except the current one (i.e., the site to be moved), we first draw their corresponding cones into the depth buffer. Next, we draw the portions of cone of the current Voronoi site whose depth values are smaller than the depth values in the depth buffer, into the stencil buffer. Hence, the Voronoi region is obtained. Because it is not necessary to update the frame buffer and the depth buffer at this stage, the Voronoi regions can be obtained efficiently. If the stencil buffer can store n bit values, we can consider the stencil buffer as a plane that has n layers. Therefore, one stencil buffer can be used to store n kinds of Voronoi region which correspond to the movements of a certain Voronoi site. In general, most standard graphics hardware can store values of eight bits or more in their stencil buffers. Therefore, we only have to read out the stencil buffer and the frame buffer after drawing each Voronoi region that corresponds to the movement of the Voronoi site toward each of the eight adjacent pixels. It is thus possible to speed up the process using the method mentioned above. To minimize Ecolor , we must repeat the method for all Voronoi sites with the possibility that Ecolor decreases due to a move. The algorithm for a certain Voronoi site S to be moved is as follows. 1. Generate the Voronoi diagram constructed by all Voronoi sites except S. 2. Disable drawing to the frame buffer, then draw to the stencil buffer information about each Voronoi region corresponding to S after moving toward each direction, with each bit of the value in the stencil buffer assigned to each direction in which there is movement. 3. Read out the frame buffer, that is, the Voronoi image generated by all Voronoi sites excluding S, and the stencil c The Eurographics Association 2002. �
buffer, that is, each shape of the Voronoi region corresponding to S moving in each direction. 4. Calculate the amount of the change in Ecolor for each direction in which there is movement after calculating the change of the shape of the Voronoi region exactly. 5. Move S in the direction where Ecolor decreases most. The algorithm described above is repeated until the changes of the Voronoi image become small, that is, until the change of Ecolor becomes less than a given threshold value.
4.4. Expression of Detailed Features If the Voronoi sites are moved only through the automatic movement process described previously, it is sometimes difficult to express the features in the reference image where the Voronoi sites have not been located when initializing the Voronoi image (Section 4.1). Additionally, the user might want to edit the arrangement of the sites. Therefore the system enables the user to move, add or delete the Voronoi sites interactively. To be specific, the user can do the Voronoi site operations mentioned above through mouse operations, and then the system again optimizes the arrangement of the Voronoi sites automatically by the local adjustments explained in Section 4.3.
4.5. Experimental Result Figure 6 shows a comparison between the previous methods and the proposed method. Figure 6(a) is generated by a free software, GIMP10 . Figure 6(b) is generated by the commercial software, Adobe Photoshop 9 . As shown in Figures 6(a) and (b), the features of the input image are lost with these applications. The method proposed by Hausner is designed to address this problem 3 . Figure 6(c) is generated by Hausner’s method. To use this method, the curves corresponding to the feature edges of the input image must be specified manually by the user. So, we specified the number of curves manually to preserve the features of the input image, for example, outlines, eyes, the bill of the duck. The number of the tiles is 341. As shown in Figure 6(c), the outlines are preserved very well. However, the eyes and the bill are not captured. To address this, the user has to specify the local size of the tiles so that smaller tiles are used around the eyes and the bill. Figure 6(d) shows the image generated by our method. It is obvious that our method captures the features of the input image better than Figure 6(d). The number of sites is the same as the number of tiles used in Figure 6(c), 341. Furthermore, Figure 6(d) is generated automatically. These results imply that our method can reduce the user’s efforts and create mosaic images with higher quality than currently available methods.
Dobashi, Haga, Johan, Nishita / Mosaic Images Using Voronoi Diagrams
(a)
(b)
(a)
(b)
Figure 7: The effects for representing the stained-glassstyle, (a): changing each edge width, (b): simulating effect of glass.
(c)
(d)
Figure 6: Resultant images, (a): a free software (GIMP10 ), (b): a commercial application (Adobe Photoshop9 ), (c): Hausner’s method3 (d): the proposed method.
Dcolor is the color difference. This allows the features in the reference image to be further emphasized. • Due to distortion and other factors, there is a slight change in brightness and transmittivity as each part of actual glass is seen. To approximately simulate this effect, in other words, to simply simulate the texture or material element of glass, and then the Voronoi region is painted smoothly by using Gouraud shading, that is, color at each corner of a Voronoi region is calculated by adding a random value to the site color.
5. Effect Addition Process
6. Animations
5.1. Calculation of Voronoi Diagram
In this section, we explain about creating a sequence of images for the mosaic animation.
When using the Voronoi image generated in the pattern generation process described in Section 4, the Voronoi edges and the adjacency relations between Voronoi regions are not accurately extracted. So, we calculate them exactly using the information of each site position as determined in Section 4 with the analytical algorithm for generating Voronoi diagrams. The various methods to generate Voronoi diagrams, including the incremental method used in our method, are discussed in detail by Aurenhammer4 . 5.2. Visual Effects As mentioned previously, this process allows the user to add two visual effects observed in stained glass windows. The user can apply the following operations interactively to the generated image using the information obtained in Section 5.1. Figure 7 shows examples of these effects applied to a duck image. • When drawing each Voronoi edge, its width is changed by both user-specified parameters and the color difference between two Voronoi regions adjacent to the edge (see Equation 2). width = Wbase +Wcolor · Dcolor ,
(2)
where Wbase and Wcolor are the user-specified parameters.
In general, the most important problem when creating non-photorealistic rendering animation is how to preserve the coherence between frames. That is, the serious flicking occurs in the resulting animation if the animation is created by generating each frame independently. In most cases, it is difficult to preserve the coherence between frames and its computational cost is high. In the proposed method, we adopted the key frame method to preserve coherence and to keep the computational cost low. The details of the algorithm are as follows. First, some of the inputted images are selected as key frames at every several intervals. Next, the mosaic images are generated for each key frame by using the technique described in Section 4. The same initial position of Voronoi sites is used for all key frames and the sites with the same initial positions are assigned the same ID numbers. Then, each frame other than the key frames is generated by linearly interpolating both the positions and the colors of the sites with the same ID. The reason why we do not generate each key frame with, for example, the final arrangement of sites at the previous key frame but with the same positions of sites is that the distortions of Voronoi regions become remarkable as the animation proceeds. The flickering problem becomes obvious when we use the color of the reference image at the c The Eurographics Association 2002. �
Dobashi, Haga, Johan, Nishita / Mosaic Images Using Voronoi Diagrams
Table 1: The computational results of the proposed method.
Name
Size (pixel)
#Site
Time[s]
Flower(Figure 2(e))
256×256
347
3.4
Duck(Figure 6(d))
256×256
341
2.0
Butterfly(Figure 8(b))
512×512
830
8.6
Sunflower(Figure 8(d))
512×512
1271
3.4
Horse(Figure 8(f))
512×512
1278
14.0
PC with a Pentium III 1 GHz and an nVIDIA GeForce3. We used OpenGL as our graphics library. The images in this paper were generated within several seconds, though not in real-time. 7.2. Animations
interpolated position of the site. To avoid this problem, the color of a site is calculated by using linear interpolation. The animations generated by using our method have the following characteristics about the positions and the colors of the sites on each frame. The state of each site in the animation can be classified into two types: (a) the case of expressing almost the same part of the animation (little change in color), (b) the case of expressing different part of the animation (relatively large changes in both position and color). As the animation proceeds, the state of each site changes between the two states mentioned above. As a result, it is possible to express the various changes in each part of the animation. That is, the sites which belong to (a) can represent translation and rotation well, while the sites which belong to (b) are suitable to represent the parts which appear or disappear during the animation. 7. Results 7.1. Stained-Glass-Style Images Figures 2, 7 and 8 show some results obtained with the proposed method. When the user generates a mosaic image, the user can see the change in the image throughout the generation process, as shown in Figure 2. Figures 8(b), 8(d) and 8(f) show examples of a swallowtail butterfly, a sunflower, and a racehorse respectively. Additionally, it is also possible to add some effects to the resulting image, like those shown in Figure 7. Note that the pattern generation process for these images is computed automatically. Table 1 shows the image size, the computation time and the number of sites for each resulting image. The computation times shown in Table 1 are measured on a standard PC with a Pentium III 1 GHz and an nVIDIA GeForce3. We used OpenGL as our graphics library. The images in this paper were generated within several seconds, though not in real-time. Table 1 shows the image size, the computation time and the number of sites for each resulting image. The computation times shown in Table 1 are measured on a standard c The Eurographics Association 2002. �
Please refer to the attached movies of the mosaic animations described in Section 6 and some frames of the resulting animation are shown in Figure 9. Though it is hard to say that each frame well expresses the features of the input image, the changes through out the original image sequence are roughly expressed in the animation created by the proposed method. 8. Conclusion We have proposed a method for creating mosaic images, or stained-glass-style images as a non-photorealistic rendering technique. By using Voronoi diagrams, our method can generate the image that capture the features of the input image. Our method works as follows. 1. Given an input image, the pattern of the mosaic (Voronoi regions determined by optimal sites) is automatically determined. This decreases the user’s efforts since the user does not have to specify information such as the edges of the input image. 2. The user can add various effects interactively such as contours and materials. The resulting image is interesting, and it approximates the input image very well. 3. To decrease the difference between the Voronoi image and the reference image, the optimal positions of the sites are efficiently computed in two steps, the global step and the local step. In the global step, the Voronoi image is scanned only once by using a 3×3 window. Then, directions for site movements are determined such that the difference between the reference image and Voronoi image is decreased. In the local step, graphics hardware is utilized for the efficient computation. The depth and stencil buffers are used to accelerate the computation of the shape of each Voronoi region according to the position of each site. This reduces the computation time since the number of data transfers between the buffers and main memory is minimized.
References 1. M. Woo, J. Neider, T. Davis,"OpenGL Programming Guide - The Official Guide to Learning OpenGL, Release 1," Addison Wesley. 2. K. E. Hoff III, T. Culver, J. Keyser,M. Lin, D. Manocha, "Fast Computation of Generalized Voronoi Diagrams Using Graphics Hardware," Proc. SIGGRAPH’99. 1999, pp. 277-286.
Dobashi, Haga, Johan, Nishita / Mosaic Images Using Voronoi Diagrams
3. A. Hausner, "Simulating Decorative Mosaics," SIGGRAPH 2001, 2001, pp. 573-580.
Proc.
4. F. Aurenhammer, "Voronoi Diagrams: A Survey of a Fundamental Geometric Data Structure," ACM Computing Surveys 23, 1991, pp. 345-405. 5. S. Green, D. Salesin, S. Schofield, A. Hertzmann, P. Litwindowicz, A.A. Gooch, C. Curtis, B. Cooch "NonPhotorealistic Rendering," Course Note #17 of SIGGRAPH’99, 1999. 6. K. Miyata, T. Itoh, K. Shimada "Organic Texture with Controlled Anisotropy and Directionality," SIGGRAPH 2001, Technical Sketch, 2001, pp. 240. 7. P. Haeberli, "Paint by Numbers," Proc. SIGGRAPH’90, 1990, pp. 207-214. 8. L. Darsa, B. Costa, "Multiresolution Representation and Reconstruction of Adaptively Sampled Images," Proc. SIGGRAPH’96, 1996, pp. 321-328.
(a)
(b)
(c)
(d)
(e)
(f)
9. http://www.adobe.com/products/photoshop/ 10.http://www.gimp.org/
(a)
(b)
(c)
(d)
(e)
(f)
Figure 9: The key frame sequence of the morphing animation.
Figure 8: The results of the proposed method: the input images (left) and the result images (right).
c The Eurographics Association 2002. �