1944
IEEE TRANSACTIONS ON INSTRUMENTATION AND MEASUREMENT, VOL. 55, NO. 6, DECEMBER 2006
A Modular Software System to Assist Interpretation of Medical Images—Application to Vascular Ultrasound Images John Stoitsis, Student Member, IEEE, Spyretta Golemati, Member, IEEE, and Konstantina S. Nikita, Senior Member, IEEE
Abstract—Improvements in medical imaging technology have greatly contributed to early disease detection and diagnosis. However, the accuracy of an examination depends on both the quality of the images and the ability of the physician to interpret those images. Use of output from computerized analysis of an image may facilitate the diagnostic tasks and, potentially improve the overall interpretation of images and the subsequent patient care. In this paper, ANALYSIS, a modular software system designed to assist interpretation of medical images, is described in detail. ANALYSIS allows texture and motion estimation of selected regions of interest (ROIs). Texture features can be estimated using first-order statistics, second-order statistics, Laws’ texture energy, neighborhood gray-tone difference matrix, gray level difference statistics, and the fractal dimension. Motion can be estimated from temporal image sequences using block matching or optical flow. Image preprocessing, manual and automatic definition of ROIs, and dimensionality reduction and clustering using fuzzy c-means, are also possible within ANALYSIS. An important feature of ANALYSIS is the possibility for online telecollaboration between health care professionals under a secure framework. To demonstrate the applicability and usefulness of the system in clinical practice, ANALYSIS was applied to B-mode ultrasound images of the carotid artery. Diagnostic tasks included automatic segmentation of the arterial wall in transverse sections, selection of wall and plaque ROIs in longitudinal sections, estimation of texture features in different image areas, motion analysis of tissue ROIs, and clustering of the extracted features. It is concluded that ANALYSIS can provide a useful platform for computerized analysis of medical images and support of diagnosis. Index Terms—Computer-aided diagnosis (CAD), medical image analysis, motion estimation, texture analysis, ultrasound imaging, vascular disease.
I. I NTRODUCTION
I
NTERPRETATION of medical images, usually performed by radiologists, is often limited due to the nonsystematic search patterns of humans, the presence of structure noise (camouflaging normal anatomical background) in the image, and the presentation of complex disease states requiring the integration of vast amounts of image data and clinical information. Computerized analysis, using advanced image-processing tools, is expected to improve medical image interpretation, because it may serve as a “second opinion” in detecting lesions, assessing disease severity, and making diagnostic decisions.
The main steps in the diagnosis process include lesion detection, characterization, and assessment. Lesion detection refers to the definition of possible pathological structures from image data. Lesion characterization involves the assessment of the status of the lesion, e.g., the likelihood that the lesion (e.g., a tumor, a plaque) is malignant or symptomatic. Features that characterize normal and pathological tissue may be extracted from the medical images. These include measurements of size and shape of regions of interest (ROIs) within the tissue, texture features [8], [17], and elasticity indexes estimated from sequences of images [12]. Lesion assessment refers to assigning a lesion to a class among a predefined set of classes. Symptomatic or asymptomatic plaques, and benign or malignant tumors would be candidate classes in the case of arterial wall disease and cancer, respectively. Previous work in computer-aided diagnosis (CAD) of vascular disease from B-mode ultrasound includes the estimation of gray-scale median [22], image texture analysis [1], [28], automatic classification into symptomatic or asymptomatic [5], and estimation of motion from sequences of images [9], [20]. In addition to this, analysis of image texture has been used to characterize coronary plaques from intravascular ultrasound images [26]. These studies have shown that quantitative information extracted from ultrasound images can be useful in the diagnosis of atherosclerosis and enable decision making about disease management. Moreover, the continuous advances in telecommunications allow an exchange of information not only throughout but also beyond the hospital as well as real-time collaboration between remote users [4]. Thus, with the introduction of CAD, a wide area of possible telematics applications for vascular disease can be identified. These include support of the diagnosis procedure [6], [23] and continuous medical education in arterial wall disease [23]. In this paper, ANALYSIS, a CAD system, is presented. ANALYSIS can be used to perform a number of imageprocessing tasks useful in medical image interpretation. Preliminary results are reported from the application of the system to B-mode ultrasound images of the carotid artery. II. D ESCRIPTION OF S YSTEM A RCHITECTURE
Manuscript received August 15, 2005; revised August 6, 2006. The authors are with the Biomedical Simulations and Imaging Laboratory, School of Electrical and Computer Engineering, National Technical University of Athens, 15773 Athens, Greece (e-mail:
[email protected]). Digital Object Identifier 10.1109/TIM.2006.884348
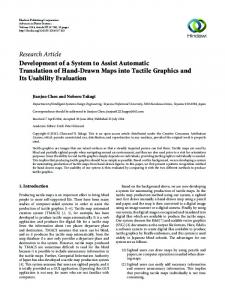
The typical structure of a CAD procedure is shown in Fig. 1. Imaging tests, including MRI, CT, and US, are determined by clinical protocols. The output of the imaging examination, consisting of a digital or digitized image, can provide input to
0018-9456/$20.00 © 2006 IEEE
STOITSIS et al.: MODULAR SOFTWARE SYSTEM TO ASSIST INTERPRETATION OF MEDICAL IMAGES
1945
of ultrasound images. Histogram equalization modifies the dynamic range and contrast of an image by altering that image such that its intensity histogram has a desired shape [11]. ANALYSIS allows the calculation and display of the histograms of the original and the preprocessed images. C. Definition of ROIs
Fig. 1.
Main steps for CAD.
a CAD system, such as ANALYSIS. The overall architecture of ANALYSIS is presented in Fig. 2. The system allows the estimation of texture and motion of selected ROIs in the image and the extraction of characteristic features. Dimensionality reduction may be applied if the dimension of the feature vector is high. Image preprocessing is also possible in an attempt to improve the image quality and enhance the visualization of structures of interest. Segmentation of anatomical structures of interest can be performed manually or automatically using the Hough transform. Clustering of estimated features into predefined classes may be performed using fuzzy c-means. The software system is complemented by the necessary datamanagement modules and the telematics services. The main functions of the modules of the system are described below. A. Data Management The data managed by ANALYSIS include imported data and system-generated data. Imported data can be medical images (e.g., ultrasound, CT, mammograms, etc.) of various formats (e.g., TIFF, JPEG, DICOM). System-generated data include: 1) images showing segmented anatomical structures, 2) waveforms showing tissue displacements, velocities, and accelerations, and 3) numerical data corresponding to motion and texture features. The system-generated data can be stored either in a file system or in a database. The access to the database was carried out using a standard Structured Query Language, and the connection to the database was performed via an Open Database Connectivity (ODBC) driver. A set of specialized functions was implemented in order to perform queries related to patients’ clinical and demographic information as well as to the results of image analysis. Digital Imaging and Communications in Medicine (DICOM) standard is often used for the acquisition and storage of image data. DICOM data can be managed within ANALYSIS using the DICOM data hierarchy, considering the patient at its root.
Within this module, ROIs corresponding to possible pathological structures appearing in medical images (e.g., tumors, plaques) as well as regions of normal tissue can be defined. Definition of ROIs can be performed manually or automatically. 1) Manual ROI Definition: The shape of the selected ROIs may be: 1) random or 2) rectangular—The coordinates of the center of the region as well as its length and width are given by the user. 2) Automatic ROI Definition: To automatically extract features in an image, an implementation of the Hough transform [11] is incorporated in ANALYSIS. The Hough transform is a standard tool in image analysis that allows recognition of global patterns in an image space by recognition of local patterns (ideally a point) in a transformed parameter space. It is particularly useful when the patterns are sparsely digitized, have “holes,” and/or the images are noisy. The basic idea of this technique is to find curves that can be parameterized like straight lines, polynomials, circles, etc., in a suitable parameter space. Although the transform can be used in higher dimensions, the main use is in two dimensions to find, e.g., straight lines, centers of circles with a fixed radius, parabolas y = ax2 + bx + c with constant c, etc. The extraction of straight line involves the determination of two parameters for each segment. Using a two-dimensional accumulator array, the algorithm examines each pixel and its neighborhood in the image. It determines whether there is enough evidence of an edge at that pixel, and if so, the parameters of the straight line that passes through the pixel are calculated and the corresponding element of the accumulator array is increased by one. After all the pixels of the image have been processed, the accumulator array is searched for peaks. The peaks indicate the most likely lines in the image. To segment circles, the algorithm uses a three-dimensional accumulator array, each dimension corresponding to one of the parameters of the circle, i.e., its radius and the coordinates of its center. With the use of a Canny edge detection method [3], edge pixels are isolated, the parameters of the circle passing through these pixels are calculated, and the corresponding element of the accumulator array is increased by one. The elements of the accumulator array, having a final value that is larger than a predefined threshold, denote the circles that are present in the binary image. D. Texture Analysis
B. Image Preprocessing To improve the image quality, linear or nonlinear filters can be applied to the image. Image filtering is particularly important in the case of noisy images such as ultrasound images. Histogram equalization is often used to enhance the appearance
Image texture may be defined as a function of the spatial variation in pixel intensities (gray values), which are generally due to some underlying physical variation in the scene. In medical image analysis, automatic extraction of texture features can be used for a variety of classification tasks such as distinguishing
1946
IEEE TRANSACTIONS ON INSTRUMENTATION AND MEASUREMENT, VOL. 55, NO. 6, DECEMBER 2006
Fig. 2. Architecture of ANALYSIS.
normal from abnormal tissue or classifying different types of abnormal tissues. Within the texture analysis module, texture features may be estimated for selected image ROIs using the following techniques. 1) First-Order Statistics: First-order statistics measure the likelihood of observing a gray value at a randomly chosen location in the image. First-order statistics can be computed from the histogram of pixel intensities in the image. These depend only on individual pixel values and not on the interaction or cooccurrence of the neighboring pixel values. A total of 16 first-order statistical features can be estimated from the normalized gray-level histogram of the selected region of the image, including minimal gray level, maximal gray level, median gray level, mean gray level, standard deviation of gray levels, coefficient of variation, gray-level skewness, gray-level kurtosis, gray-level energy, gray-level entropy, 10 percentile, 25 percentile, 50 percentile, 75 percentile, 90 percentile, and histogram width [10]. 2) Second-Order Statistics: Second-order statistics are defined as the likelihood of observing a pair of gray values occurring at endpoints of a dipole (or needle) of random length placed in the image at a random location and orientation. These are properties of pairs of pixels. Second-order statistics are derived from angular nearest neighbor spatial-dependence matrices, also known as cooccurrence matrices [14]. The relative frequencies P (i, j, d, θ) with which two neighboring pixels with gray levels i and j at a given distance d and orientation θ occur on the image, are used to construct the cooccurrence matrices. A total of 14 textural measures can be estimated from the cooccurrence matrix, including angular second moment, contrast, correlation, variance, inverse difference moment, sum average, sum variance, sum entropy, entropy, difference variance, difference entropy, information measures of correlation (two features), and maximum correlation coefficient. 3) Neighborhood Gray-Tone Difference Matrix: For each ROI, information about spatial changes in intensity can be obtained by looking at the difference between each pixel and the gray tones of its surrounding neighbors. A one-dimensional (1-D) matrix can be estimated for each ROI, in which the ith entry corresponds to the summation of the differences between the gray level of all pixels with gray level i and the average
gray level of their surrounding neighbors. The size of the neighborhood depends on the selected distance, i.e., a distance equal to one results in a 3 × 3 neighborhood. Five features are derived from this 1-D matrix, namely coarseness, busyness, contrast, complexity, and texture strength. 4) Gray-Level Difference Statistics: First-order statistics of the local property values can be obtained using the gray-level difference statistics method [27]. The computation of the local properties is based on the absolute difference between pairs of gray levels or of the average gray levels. For any given displacement δ = (∆x, ∆y), the following four texture measures can be estimated: contrast, angular second moment, entropy, and mean. 5) Laws’ Texture Energy: Laws’ texture energy measures [18] are derived from three simple vectors of length 3, L3 ≡ (1, 2, 1), E3 ≡ (−1, 0, 1), and S3 ≡ (−1, 2, −1), which represent the 1-D operations of center-weighted local averaging, symmetric first differencing for edge detection, and second differencing for spot detection. If these vectors are convolved with themselves or with each other, five vectors of length 5 are obtained, L5 ≡ (1, 4, 6, 4, 1), S5 ≡ (−1, 0, 2, 2, −1), R5 ≡ (1, −4, 6, −4, 1), E5 ≡ (−1, −2, 0, 2, 1), and W 5 ≡ (−1, 2, 0, −2, 1). If the column vectors of length 5 are multiplied by row vectors of the same length, then Laws’ 5 × 5 masks are obtained. To describe the texture in an image using the obtained masks, the masks are convolved with the image and statistics (e.g., energy) of the results are used as texture properties. Four 5 × 5 Laws’ masks are used in ANALYSIS, namely L5T E5, L5T S5, E5T S5, and R5T R5, where the superscript T denotes matrix transposition. After convolution with each of the masks, the sum of absolute values normalized by the number of pixels and the previously mentioned 16 firstorder statistical features are calculated, resulting in a total of 64 energy features. 6) Fractal Dimension (FD): Many natural surfaces have a statistical quality of roughness and self-similarity at different scales. Fractals, first proposed by Mandelbrot and Van Ness [19], are very useful in modeling these properties in image processing. The definition of the FD is based on the concept of self-similarity. Given a bounded set A in a Euclidean n-space, the set A is said to be self-similar when A is the union of N distinct (nonoverlapping) copies of itself, each of which
STOITSIS et al.: MODULAR SOFTWARE SYSTEM TO ASSIST INTERPRETATION OF MEDICAL IMAGES
has been scaled down by a ratio of r. The FD D is related to the number N and the ratio r as follows: D=
log N . log(1/r)
The FD gives a measure of the roughness of a surface. For an image, the FD is a noninteger number between two and three. Intuitively, the larger the FD, the rougher the texture. There are a number of methods for estimating the FD. In this paper, the FD was estimated using the differential box counting (DBC) method, a modification of the traditional box counting method [24]. E. Motion Analysis Motion analysis from sequences of images allows the estimation of mechanical strain experienced by the tissue. In the cardiovascular system, there is inherent tissue motion and strain is due to stresses caused by blood pressure, blood flow, and tethering to surrounding tissue. Strain in tissues with no inherent motion (e.g., breast, prostate) can be estimated if external forces are applied. To estimate motion, temporal sequences of images need to be recorded at high frame rates. The system allows the image sequence to be played back in the form of a movie. Within ANALYSIS, motion can be estimated using the following techniques. 1) Region Tracking and Block Matching: The method is described in detail in [9]. Briefly, a ROI can be selected in the first frame of the sequence, and its position is automatically tracked in subsequent frames. Automatic tracking is based on matching ROI pixel intensities in each frame with those in the first frame. Rectangular ROIs can be tracked whose coordinates and dimensions are given by the user or can be defined using the mouse. The result of the motion analysis consists in waveforms showing radial and axial displacements, velocities and accelerations of the selected ROIs as well as correlation coefficients. The difference waveforms for the radial and axial displacement can be used to analyze the relative motion between selected sites. The vectors of maximum displacements for each ROI can be displayed superimposed on the image. 2) Optical Flow: The calculation of the apparent velocity field, i.e., optical flow, relies on the estimation of the spatiotemporal changes in pixel intensities throughout an image sequence. An implementation of a validated motion-estimation algorithm [15], using a minimization of sum-of-squared differences between images, was used in this paper to estimate optical flow. Results of motion estimation between consecutive frames are propagated, i.e., vector endpoints are used as the starting coordinates for the next frame evaluation. The final result is a dense vector map where each pixel is represented by a vector corresponding to its velocity between two frames. F. Dimensionality Reduction To reduce the dimensionality of the texture feature vector, ANalysis of VAriance (ANOVA) statistics may be applied [7].
1947
The “f-ratio” of the class-to-class variance over the within-class variance is estimated to select features significantly different between tissue types, e.g., between normal and diseased tissue or between different types of diseased tissue. Features that produce an “f-ratio” greater than a set threshold are retained to the feature vector while the remaining are discarded.
G. Clustering Using Fuzzy C-Means Motion and texture features can be organized into a predefined number of clusters using fuzzy c-means. More specifically, for a given set of features, a matrix is created with rows corresponding to subjects and columns to features. The fuzzy c-means algorithm [2], an unsupervised classification method, assigns data points (matrix rows) with similar characteristics to a predefined number of classes (clusters). An iteration scheme based on the minimization of the distance of each data point from the cluster center, weighted by the membership grade of the data points, is used to update the clusters’ centers and the membership grades for each point. Each matrix is assigned to the cluster corresponding to the maximum of its membership function values. The output of the algorithm consists in the centers of the clusters and the values of the membership functions for each vector.
H. Collaborative Environment The collaborative environment of ANALYSIS extends the capabilities of the stand-alone CAD system, giving local and remote health care professionals the opportunity to cooperate for the delineation and image analysis of ROIs in ultrasound images. The implementation is based on a point-to-point communication scheme following the “What You See Is What I See” (WYSIWIS) paradigm. To support the collaborative environment, both asynchronous (off-line transfer of data sets) and synchronous (online collaboration) data exchange schemes are employed. The term “off-line” indicates the absence of the user’s interaction with ANALYSIS and involves the transfer of large datasets. A sequence of B-mode ultrasound images after lossless compression requires 5 to 20 MB of storage depending on the number of images. The main concept of the collaborating environment relies on the synchronization of the two ANALYSIS applications (local and remote) in order to provide the collaborating parties with the same view of the application. A master/slave control relationship is employed, where the party having the role of the master is able to perform all actions of the CAD while the “slave” participant can only view the results of the master’s actions [21]. The common synchronized operation of the two ANALYSIS applications is achieved by transferring the codified commands corresponding to the user-interface actions, from the master side to the slave side. To deal with security issues raised by the introduction of telecollaboration functionalities, user access to ANALYSIS is password protected and the transfer of data is performed using encryption techniques.
1948
IEEE TRANSACTIONS ON INSTRUMENTATION AND MEASUREMENT, VOL. 55, NO. 6, DECEMBER 2006
Fig. 3. User interface of ANALYSIS.
III. R ESULTS A. Implementation Issues ANALYSIS package was developed in the Biomedical Simulations and Imaging Laboratory of the National Technical University of Athens and is not a commercial package. The ANALYSIS package was mainly developed in MATLAB (The MathWorks, Natick, MA), while some motion analysis procedures were developed using Visual C++. ANALYSIS can be installed on PC-based platforms operating under Microsoft Windows operating system. Minimum requirements in processor speed and RAM are 600 MHz and 256 MB, respectively. The main user interface of ANALYSIS is shown in Fig. 3. The two main windows of the interface are designed to support the motion and texture analysis. Tools buttons and menu bars allow the user to select the parameters of the analysis, e.g., the number of investigated ROIs, the size and shape of ROIs, the interpixel distance for the calculation of second-order statistics and neighborhood gray-tone difference matrix, etc. The system includes a friendly wizard for importing results files, which can be subsequently analyzed using ANOVA statistics and clustered into predefined groups using fuzzy c-means.
B. Application to Vascular Ultrasound Images To show the applicability and usefulness of ANALYSIS in supporting medical diagnosis tasks, B-mode ultrasound images of carotid arteries were used. Severity of carotid atherosclerosis, which may be responsible for cerebral events, e.g., strokes, is currently based on a previous occurrence of clinical symptoms and the degree of stenosis caused by the plaque. However, there is evidence that atheromatous plaques with relatively low stenosis degree may produce symptoms, and that the majority of asymptomatic patients with highly stenotic atherosclerotic plaques remain asymptomatic. Automatic segmentation of the arterial wall, motion analysis of the wall and plaque surface during the cardiac cycle, and texture analysis of the atheromatous plaque are believed to provide valuable tools for the early and accurate diagnosis of carotid atherosclerosis.
Fig. 4. Examples of image preprocessing and definition of ROIs. (a) Original B-mode ultrasound image of a diseased carotid artery. (b) Histogram equalized image. Selected ROIs correspond to plaque, blood, and sternocleidomastoid muscle tissue.
The output of a typical vascular ultrasound examination consists of 1) sequences of B-mode images in longitudinal and/or transverse sections and 2) static images in M-mode, and/or Doppler mode, etc. A single B-mode ultrasound image has a size of approximately 0.4 MB, so a typical set of 100 frames is 40 MB. This is too large to store directly in the system database. Therefore, only the location of the entire image file was stored in the database, while the actual files were stored in a dedicated server. Fig. 4 shows an example of a B-mode ultrasound image of the carotid artery and its contrast enhanced version using histogram equalization. The histogram-equalized image [Fig. 4(b)] allows better visualization of the plaque and the surrounding tissue. Fig. 4(b) shows examples of selected ROIs in an ultrasound image of a diseased carotid artery; ROIs may include the plaque as well as regions in the sternocleidomastoid muscle and in the blood. ROIs corresponding to plaque are usually interrogated to support the diagnosis of disease. Tissue ROIs may also be investigated to compare the echogenicity of plaque with that of the surrounding tissue and to study the echogenicity of different types of sternocleidomastoid muscle [10]. Examples of automatic segmentation of the carotid artery wall using the Hough transform are shown in Fig. 5. Sequences of images of transverse sections of normal (nonatherosclerotic) carotid arteries were used, where the boundaries of the vessels are close to circular. As we can see, a circle of larger diameter was found during systole. The validity of the segmentation technique was investigated by comparing the automatically
STOITSIS et al.: MODULAR SOFTWARE SYSTEM TO ASSIST INTERPRETATION OF MEDICAL IMAGES
1949
Fig. 6. Examples of displacements using block matching in (a) an asymptomatic and (b) a symptomatic subject. The vectors show maximal displacements throughout the image sequence. The vectors have been magnified (×6) for better visualization.
Fig. 5. Examples of automatic segmentation of the carotid artery wall using Hough transform. (a) Diastole. (b) Systole.
defined boundaries with boundaries defined manually by an experienced physician. Specifically, the match ratio, defined as the common area enclosed by automatic and manual segmentation divided by the area enclosed by the manual segmentation, was estimated. In six young adults, the mean value (±std) of this ratio was reasonably high (0.86 ± 0.06). We also investigated the validity of the segmentation technique by estimating arterial diameters in image sequences. In this case, diastolic (Dd ) and systolic (Ds ) diameters as well as the relative diameter changes (∆D/Dd ), where ∆D = Ds − Dd , were estimated from circle diameters. In six young adults with normal (nonatherosclerotic) carotid vessels, we found the following diameter values (average ± std): Dd = 6.14 ± 0.06 mm, Ds = 6.90 ± 0.05 mm, and ∆D/Dd = 13.10 ± 8.76%. These have been reported as reasonable carotid artery diameter values [13]. Texture features may be used to characterize different types of biological tissue. The estimation of echogenicity descriptors for regions in the following three distinct areas of a typical B-mode ultrasound image of a diseased carotid artery, namely plaque, blood, and surrounding tissue showed different distributions of gray levels in different anatomical areas.
To estimate the motion of the luminal surface of the plaque using block matching, six ROIs of size 3.2 × 2.5 mm2 were selected on the plaque surface. Fig. 6 shows examples of maximal displacements using block matching in a symptomatic and an asymptomatic plaque. As we can see, the motion field appeared to be more uniform in the asymptomatic plaque, suggesting greater stability during the cardiac cycle. Furthermore, the motion field of the plaque surface can be estimated using the optical flow. Fig. 7 shows examples of motion fields in axial direction in a symptomatic and an asymptomatic plaque. Using either block matching or optical flow, the following indexes of motion can be estimated for a plaque: 1) maximal surface velocity (MSV) and 2) maximal relative surface velocity (MRSV), defined as the maximum of differences between maximal and minimal surface velocities throughout the sequence. Table I shows their average values (±std) for ten symptomatic and nine asymptomatic carotid atheromatous plaques. Differences between the two results may be due to differences in the basic principles of the two techniques. Block matching estimates the motion of a pixel as an average of the motion of a group of pixels around it; as a result of this, a noise is usually smoothed out. Optical flow, on the other hand, estimates motion of individual pixels; some of these may represent noise (e.g., speckle) instead of real movement. A further in-depth study of the differences between the two techniques is currently underway by our group [25]. Clustering using fuzzy c-means can be performed for various combinations of features pairs. Fig. 8 shows an example of clustering for two texture features, namely information measure of correlation (IMC) and FD, for a group of 29 symptomatic and 30 asymptomatic plaques. A preliminary application of the telematics capabilities of ANALYSIS included the demonstration of the functionalities of the CAD system for educational purposes. More specifically, ANALYSIS was installed in two remote workstations, one situated in the Biomedical Simulations and Imaging Laboratory and the other in a clinical setting, where an experienced physician (vascular surgeon) could use it. Similar hardware platforms were used for both participating sites consisting of dual Pentium 4 2.8-GHz workstations with 512 MB of RAM. According to the demonstration scenario, a number of clinical cases consisting of ultrasound image sequences were selected, and the corresponding datasets were transferred between the
1950
IEEE TRANSACTIONS ON INSTRUMENTATION AND MEASUREMENT, VOL. 55, NO. 6, DECEMBER 2006
Fig. 7. Examples of axial velocity fields using the optical flow in (a) an asymptomatic and in (b) a symptomatic subject. The vectors show maximal velocities along the luminal surface of the plaque throughout the image sequence. The vectors have been magnified (×40) for better visualization.
collaborating sites. After a successful completion of the offline dataset exchange, the users can collaborate on a number of diagnostic tasks. As an example, to perform texture analysis, the boundary of the plaque needs to be outlined. In this case, the user can be assisted by the experienced physician who can draw it online. The classification and statistical results of the texture analysis procedure can be sent to the physician for clinical validation. The telecollaboration was conducted as part of the demonstration of ANALYSIS to graduate students; it was not used for clinical purposes. IV. D ISCUSSION ANALYSIS, the modular software system presented in this paper, is expected to be a useful tool in medical diagnosis, because it can assist interpretation of medical images through a user-friendly interface. The individual modules of the system
offer the possibility to define ROIs in the image, extract useful image information, including motion and texture features, and analyze the results either through statistical analysis or by clustering using fuzzy c-means. Compared with other medical image analysis software, ANALYSIS can be used to assist diagnosis of carotid atherosclerosis from the ultrasound images. This is a challenging task because 1) ultrasound images are noisy and, therefore, difficult to interpret and 2) diagnosis-based treatment of the disease may reduce the possibility of occurrence of clinical manifestations such as strokes. A majority of similar software address diagnostic tasks in the areas of breast cancer, mainly from mammograms and liver disease. Furthermore, the possibility to measure tissue motion within ANALYSIS, not commonly found in similar software, can be very useful in the study of tissue elasticity, which is crucial in medical diagnosis. It should be pointed out that carotid plaque motion is becoming a powerful tool in the diagnosis of carotid atherosclerosis; it is also important for the characterization of other tissue lesions. ANALYSIS can be extended to assist the interpretation of images from various modalities and, thus, enable diagnosis and management of a number of diseases, e.g., diagnosis of coronary atherosclerosis from vascular ultrasound images, diagnosis of liver disease from ultrasound or CT images, diagnosis of breast cancer from mammograms or ultrasound images, etc. Because ANALYSIS allows the estimation of image features using a number of techniques, it is possible to study the relative performance of various techniques. This can be particularly useful when the validity of a given technique is investigated. Currently, ANALYSIS is used mainly in research. However, because it addresses significant clinical issues, ANALYSIS can be readily used in clinical practice. In addition to this, ANALYSIS can be used for educational purposes. The applicability and usefulness of the system can be further extended by enhancing the functions of the individual modules. More specifically, 1) automatic segmentation techniques based on active contours and 2) shape analysis can be incorporated in the system. Finally, the creation of links to patient electronic medical records, in conjunction with the system’s telematics capabilities, would produce an integrated CAD system and enable decision making. The ultimate acceptance of ANALYSIS will depend not only on the performance of the computerized method alone, but also on how well the clinician performs the task when the computer output is used as an aid and on the ability to integrate the computerized analysis method into routine clinical practice [16]. Issues, such as a friendly user interface, a short system response time, and low cost, are critical for the daily routine use of ANALYSIS. V. C ONCLUSION ANALYSIS, a modular software system designed to assist the interpretation of medical images, has been presented, and it is expected to provide a valuable tool in clinical practices. The applicability and usefulness of ANALYSIS were demonstrated in the case of interpretation of vascular B-mode ultrasound images.
STOITSIS et al.: MODULAR SOFTWARE SYSTEM TO ASSIST INTERPRETATION OF MEDICAL IMAGES
1951
TABLE I INDEXES OF MOTION OF SYMPTOMATIC AND ASYMPTOMATIC CAROTID PLAQUES. MSV: MAXIMAL SURFACE VELOCITY, MRSV: MAXIMAL RELATIVE SURFACE VELOCITY
Fig. 8. Example of clustering using fuzzy c-means for two texture features, namely IMC and FD. In the graphs, the values of the features have been normalized to better illustrate their distribution in the feature space.
ACKNOWLEDGMENT The authors would like to thank Prof. A. N. Nicolaides and the staff of the Irvine Laboratory, St. Mary’s Hospital, London, U.K., for their contributions in the recording of the image sequences, and also A. K. Dimopoulos for the contribution in the implementation of the optical-flow method. R EFERENCES [1] P. Asvestas, S. Golemati, G. K. Matsopoulos, K. S. Nikita, and A. N. Nicolaides, “Fractal dimension estimation of carotid atherosclerotic plaques from B-mode ultrasound: A pilot study,” Ultrasound Med. Biol., vol. 28, no. 9, pp. 1129–1136, Sep. 2002. [2] J. C. Bezdek, Pattern Recognition With Fuzzy Objective Function Algorithms. New York: Plenum, 1981. [3] J. Canny, “A computational approach to edge detection,” IEEE Trans. Pattern Anal. Mach. Intell., vol. PAMI-8, no. 6, pp. 679–698, Nov. 1986. [4] D. Caramella, J. Reponen, F. Fabbrini, and C. Bartolozzi, “Teleradiology in Europe,” Eur. J. Radiol., vol. 33, no. 1, pp. 2–7, Jan. 2000. [5] C. I. Christodoulou, C. S. Pattichis, M. Pantziaris, and A. Nicolaides, “Texture-based classification of atherosclerotic carotid plaques,” IEEE Trans. Med. Imag., vol. 22, no. 7, pp. 902–912, Jul. 2003.
[6] E. D. Endean, L. I. Mallon, D. J. Minion, C. J. Kwolek, and T. H. Schwarcz, “Telemedicine in vascular surgery: Does it work?,” Amer. Surgeon, vol. 67, no. 4, pp. 334–340, Apr. 2001. [7] N. Furlong, E. Lovelace, and K. Lovelace, Research Methods and Statistics: An Integrated Approach. Orlando, FL: Harcourt Brace, 2000. [8] M. J. Gangeh, M. Hanmandlu, and M. Bister, “A fuzzy-based texture analysis for tissue characterization of diffused liver diseases on B-scan images,” Biomed. Sci. Instrum., vol. 38, pp. 369–374, 2002. [9] S. Golemati, A. Sassano, M. J. Lever, A. A. Bharath, S. Dhanjil, and A. N. Nicolaides, “Carotid artery wall motion estimated from B-mode ultrasound using region tracking and block-matching,” Ultrasound Med. Biol., vol. 29, no. 3, pp. 387–399, Mar. 2003. [10] S. Golemati, T. J. Tegos, A. Sassano, K. S. Nikita, and A. N. Nicolaides, “Echogenicity of B-mode sonographic images of the carotid artery—Work-in-progress,” J. Ultrasound Med., vol. 23, no. 5, pp. 659–669, May 2004. [11] R. C. Gonzalez and R. E. Woods, Digital Image Processing. Reading, MA: Addison-Wesley, 1993. [12] J. F. Greenleaf, M. Fatemi, and M. Insana, “Selected methods for imaging elastic properties of biological tissues,” Annu. Rev. Biomed. Eng., vol. 5, pp. 57–78, 2003. [13] F. Hansen, P. Mangell, B. Sonesson, and T. Länne, “Diameter and compliance in the human common carotid artery—Variations with age and sex,” Ultrasound Med. Biol., vol. 21, no. 1, pp. 1–9, 1995. [14] R. M. Haralick, K. Shanmugam, and I. Dinstein, “Textural features for image classification,” IEEE Trans. Syst., Man, Cybern., vol. SMC-3, no. 6, pp. 610–621, Nov. 1973. [15] B. K. P. Horn and B. G. Schunck, “Determining optical flow,” Artif. Intell., vol. 17, no. 1–3, pp. 185–203, Aug. 1981. [16] D. Hunt, R. B. Haynes, S. Hanna, and K. Smith, “Effects of computerbased clinical decision support systems on physician performance and patient outcomes,” J. Amer. Med. Assoc., vol. 280, no. 15, pp. 1339–1346, Oct. 1998. [17] E. K. Kerut, M. Given, and T. D. Giles, “Review of methods for texture analysis of myocardium from echocardiographic images: A means of tissue characterization,” Echocardiography, vol. 20, no. 8, pp. 727–736, Nov. 2003. [18] K. I. Laws, “Rapid texture identification,” in Proc. SPIE Conf. Missile Guid., 1980, vol. 238, pp. 376–380. [19] B. B. Mandelbrot and J. W. Van Ness, “Fractional brownian motion, fractional noises and applications,” SIAM Rev., vol. 10, no. 4, pp. 422–438, 1968. [20] S. Meairs and M. Hennerici, “Four-dimensional ultrasonographic characterization of plaque surface motion in patients with symptomatic and asymptomatic carotid artery stenosis,” Stroke, vol. 30, no. 9, pp. 1807–1813, Sep. 1999. [21] E. Ntasis, M. Gletsos, M. A. Mouravliansky, E. I. Zacharaki, C. E. Vasios, S. Golemati, T. A. Maniatis, and K. S. Nikita, “Telematics enabled virtual simulation system for radiation treatment planning,” Comput. Biol. Med., vol. 35, no. 9, pp. 765–781, Nov. 2005. [22] L. M. Pedro, M. M. Pedro, I. Gonçalves, T. F. Carneiro, C. Balsinha, R. Fernandes e Fernandes, and J. Fernandes e Fernandes, “Computerassisted carotid plaque analysis: Characteristics of plaques associated
1952
[23] [24] [25]
[26]
[27] [28]
IEEE TRANSACTIONS ON INSTRUMENTATION AND MEASUREMENT, VOL. 55, NO. 6, DECEMBER 2006
with cerebrovascular symptoms and cerebral infarction,” Eur. J. Vasc. Endovasc. Surg., vol. 19, no. 2, pp. 118–123, Feb. 2000. M. A. Ricci, S. J. Knight, B. Nutter, and P. W. Callas, “Desktop telemedicine in vascular surgery: Some preliminary findings,” Telemed. J., vol. 4, no. 4, pp. 279–285, 1998. N. Sarkar and B. B. Chaudhuri, “An efficient differential box-counting approach to compute fractal dimension of image,” IEEE Trans. Syst., Man, Cybern., vol. 24, no. 1, pp. 115–120, Jan. 1994. J. Stoitsis, S. Golemati, A. K. Dimopoulos, and K. S. Nikita, “Analysis and quantification of arterial wall motion from B-mode ultrasound images: Comparison of block-matching and optical flow,” in Proc. 27th Annu. Int. Conf. IEEE Eng. Med. and Biol. Soc., Shanghai, China, Sep. 1–4, 2005, pp. 4469–4472. D. G. Vince, K. J. Dixon, R. M. Cothren, and J. F. Cornhill, “Comparison of texture analysis methods for the characterization of coronary plaques in intravascular ultrasound images,” Comput. Med. Imaging Graph., vol. 24, no. 4, pp. 221–229, 2000. J. S. Weszka, C. R. Dyer, and A. Rosenfeld, “A comparative study of texture measures for terrain classification,” IEEE Trans. Syst., Man, Cybern., vol. SMC-6, no. 4, pp. 269–285, Apr. 1976. J. E. Wilhjelm, M. L. M. Grønholdt, B. Wiebe, S. K. Jespersen, L. K. Hansen, and H. Sillesen, “Quantitative analysis of ultrasound B-mode images of carotid atherosclerotic plaque: Correlation with visual classification and histological examination,” IEEE Trans. Med. Imag., vol. 17, no. 6, pp. 910–922, Dec. 1998.
John Stoitsis (S’05) was born in Poland in 1977. He received the Diploma of electrical and computer engineering from Aristotle University of Thessaloniki, Greece, and the M.Sc. degree in biomedical engineering from University of Patras, Greece, in 2002 and 2004, respectively. His research interests include biomedical image and signal processing, medical informatics, health telematics, computer-aided diagnosis and neuroscience. He has coauthored more than ten papers in international conferences and journals. Mr. Stoitsis is a member of the Technical Chamber of Greece.
Spyretta Golemati (M’01) received the Diploma in mechanical engineering from National Technical University of Athens, Greece, and the M.Sc. and Ph.D. degrees in bioengineering from Imperial College of Science, Technology and Medicine, University of London, U.K., in 1994, 1995, and 2000, respectively. She then was a Postdoctoral fellow with the Department of Electrical and Computer Engineering, National Technical University of Athens. She is currently a Lecturer in biomedical engineering with the National Kapodistrian University of Athens. Her research interests include medical imaging, image and signal processing, computational fluid mechanics, and respiratory mechanics. Dr. Golemati is a member of the Technical Chamber of Greece.
Konstantina S. Nikita (M’96–SM’00) received the Diploma degree in electrical engineering and the Ph.D. degree from National Technical University of Athens (NTUA), Greece, in 1986 and 1990, respectively, and the M.D. degree from the Medical School, University of Athens, in 1993. Since 1990, she has been working as a Researcher with the Institute of Communication and Computer Systems, NTUA. In 1996, she joined the Department of Electrical and Computer Engineering, NTUA, where she is currently a Professor. Her current research interests include medical imaging, biomedical signal and image processing and analysis, biomedical informatics, health telematics, simulation of physiological systems, computational bioelectromagnetics, biological effects, and medical applications of electromagnetic waves. She has authored or coauthored 90 papers in refereed international journals and chapters in books, and more than 150 papers in international conference proceedings. She was the coauthor of one book in Greek and the coeditor of one book in English published by Springer. She holds two Greek patents. She has been the Technical Manager with several European and National Research and Development Projects in the field of biomedical engineering. Dr. Nikita is a member of the Technical Chamber of Greece, the Athens Medical Association, and the Hellenic Society of Biomedical Engineering. She was the recipient of the 2003 Bodossakis Foundation Academic Prize for exceptional achievements in “Theory and Applications of Information Technology in Medicine.”