Intelligent Information Management, 2014, 6, 196-210 Published Online July 2014 in SciRes. http://www.scirp.org/journal/iim http://dx.doi.org/10.4236/iim.2014.64020
A Multi-Agent School Simulation Based on Hierarchical Social Networks Yu Zhang1, Jiang Wu2, Lizhu Ma3 1
Department of Computer Science, College of St. Benedict and St. John’s University, Collegeville, MN, USA School of Information Management, Wuhan University, Wuhan, China 3 Department of Computer Science, Baylor University, Waco, TX, USA Email:
[email protected],
[email protected],
[email protected] 2
Received 8 April 2014; revised 7 May 2014; accepted 6 June 2014 Copyright © 2014 by authors and Scientific Research Publishing Inc. This work is licensed under the Creative Commons Attribution International License (CC BY). http://creativecommons.org/licenses/by/4.0/
Abstract The quality of K-12 education has been a very big concern for years. Previous methods studied only one or two factors, such as school choice, or teacher quality, on school performance. Therefore the results they provide can be limited. We propose a multi-agent approach to integrate multiple actors in a school system. These actors include teachers, students, supporting staffs and administrators. The interactions among these actors compose a hierarchical school social network. We first detect the hierarchical community structure in this school network by using an agglomerative hierarchical algorithm. Existing agglomerative hierarchical algorithms usually calculate similarity or dissimilarity between two clusters by using some measure of distance between pairs of observations. We, however, develop a method that calculates similarity based on social interactions between interactions is essential in multi-agent systems. Our algorithm is applied to 15 school districts in Bexar County, Texas, and it provides satisfying results on generating the hierarchical structure of all school districts. We then use the detected structure of the social network to evaluate the school system’s organization performance. We design and implement a funding evaluation model to decompose the funding policy task into subtasks and then evaluate these subtasks by using funding distribution policies from past years and looking for possible relationships between student performances and funding policies. Experiments in the 15 school districts in Bexar County show no significant correlation between student performance and the amount of the funding a school district received.
Keywords Hierarchical Clustering, K-12 Education, Multi-Agent Systems, Social Network Analysis
How to cite this paper: Zhang, Y., Wu, J. and Ma, L.Z. (2014) A Multi-Agent School Simulation Based on Hierarchical Social Networks. Intelligent Information Management, 6, 196-210. http://dx.doi.org/10.4236/iim.2014.64020
Y. Zhang et al.
1. Introduction
Social network analysis has been an emerging field in recent years. It views social relationships in terms of nodes (agents) and edges (ties). Research has shown that social networks play a critical role in determining the way problems are solved, organizations are run, etc. [1]. For a survey on networks, see [2]. A multi-agent system (MAS) is a set of autonomous and interactive entities called agents [3]. Multi-agent system and social network analysis share some similarities (e.g. agents, relationships, etc.). Much research has successfully combined these two together [4] [5]. In multi-agent simulations, when agents communicate with each other or work together on a common goal, agents are often organized into networks. In this paper, we focus on school networks that contain many actors or agents interacting with each other in school systems. The quality of K-12 education has been a very big concern for years. Many studies have been conducted in the field. There are also many factors that have been studied, such as, school choice [6] [7], school size [8], teacher quality [9] [10], school/school district administrator quality [11] [12], funding [13] [14], etc. Because previous research in this field mostly studied the impact of one or two of those factors on school performance, the results they provide can be limited. We propose an approach to integrate multiple factors in a multi-agent school system and show how it can help in school network structure detection and how the detected structure can utilize school policy evaluations. According to [15], social networks often have an underlying hierarchical community structure, and finding these community structures is very important for understanding inherent structures for complex social networks [16]. Thus hierarchical clustering algorithms can be useful and appropriate methods to detect multilevel structures of networks [15]. The first step for any hierarchical clustering algorithm is to decide the similarity between two agents or clusters. Because a school system consists of many interacting agents, for example, students and students, students and teachers, regular education teachers and special education teachers, teachers and administration staff, etc., it is regarded as an interaction-based system. Therefore we use the interaction level between two agents or clusters as the similarity measure. Once the hierarchical structure of the school system is detected, it can be used to evaluate policies that may affect school performance. The purpose of this work is to study structures of social networks with a focus on social interactions by detecting underlying hierarchical structures. The detected structure of social networks is then used to help evaluate their organization performance. There are mainly two steps. The first step is to detect hierarchical community structure in school networks by using an agglomerative hierarchical algorithm. Agglomerative or bottom-up algorithms start with each node in its own singleton cluster, and at each step merge these clusters into larger ones until all clusters are merged into one big cluster [9]. Existing agglomerative hierarchical algorithms usually calculate similarity or dissimilarity between two clusters by using some measure of distance between pairs of observations. We, however, develop a method that calculating similarity based on social interactions between interactions is essential in multi-agent systems. Our algorithm is applied to 15 school districts in Bexar County, Texas, and it provides satisfying results on generating the hierarchical structure of all school districts. The second goal is to study multiple factors that affect organization performance with the help of organization structure. In the school system network, how funding is distributed in the school system is a very important matter; however, research in the field has not been able to draw any sound conclusions yet. We design and implement a funding evaluation model, which is based on the MAXQ algorithm [17], to decompose the funding policy task into subtasks and then evaluate these subtasks by using funding distribution policies from past years and looking for possible relationships between student performances and funding policies. We study funding policies for 15 Bexar county school districts in three years and evaluate these policies. This model first decomposes the whole funding distribution task into several subtasks. Then, for each school district, we evaluate its funding policy from 2008-2011 by evaluating its performance in these three years. We conclude that increasing funding does not necessarily have a positive impact on student performance and it is generally not the case that the more is spent, the better.
2. School System Evaluation Different actors/agents in a school system may play different roles and have different impact on school performance. In the followings, we review the literatures that discuss the roles of superintendent, principal and teacher and how school quality and student performance might be affected by them.
197
Y. Zhang et al.
2.1. Funding
School funding is an important and highly contested matter surrounding education. There is conflicting evidence on whether or not an increase in school funding will truly produce an increase in student achievement or whether it is not the amount of funding but how funding is spent that is truly important. Various research papers and programs provide general data on school funding. Reference [18] indicated that half of all property taxes go to funding public schools. Despite concerns that this figure is too high, it has proven difficult to lower property taxes and improve school performance. The 2008 PBS program Where We Stand: America’s Schools in the 21st Century indicated that 10% of school funding comes from federal sources, with the majority coming from state and local sources. The general consensus is that schools are underfunded and require more funding in order to function properly. Reference [14] indicated this when he stated that investment in the human, social, and physical capital of a school can have a strong positive impact on student achievement. However, [13] indicated that the effects of increasing per-pupil spending on student achievement are not necessarily positive. Although school funding has been steadily increasing since 1970, American schools are still falling behind schools in other countries. There are a number of concerns regarding these figures. For one, although funding has increased overall, there are concerns that there is a large funding gap between schools, with some schools receiving insufficient funding and other schools receiving too much funding. Also, there are concerns that money is not being spent in ways that have a significant impact on student achievement. Overall, schools require funding to be effective in increasing student achievement, but too much funding produces diminishing returns. Schools must therefore be able to spend money intelligently. Anderson recommended a targeted approach, identifying the schools and programs that must be invested in to increase student achievement and then applying funding to those areas to achieve the desired result.
2.2. Superintendent Report from [12] found that superintendent quality does affect school performance. They believed that superintendent can affect school quality in a variety of ways (for example, recruiting, training, and rewarding highquality principals and occasionally teachers). They also suggested that the quality of a superintendent can be measured as the additional salary paid to school superintendents over and above the normal determinants of salary. The McREL (Mid-continent Research for Eudcation and Learning) research team found a statistically significant relationship between district leadership and student achievement [19]. They also identified five district responsibilities that are significant to student achievement, such as non-negotiable goals for achievement and instruction, board alignment and support of district goals, etc.
2.3. Principal Reference [11] found a positive relationship between principal experience and school performance, but they found little evidence of any relationship between school performance and principal education. Reference [20] study several types of principal leadership. They suggested that transformational and shared instructional leadership coexisting in an integrated form of leadership is the best for improving school performance.
2.4. Teacher Teachers are directly involved with students in everyday school life. It is very obvious that they have a substantial impact on student achievement. Teacher’s ability is the key to student achievement, as discussed in [21]. Reference [22] argued that only true way for schools to improve student achievement is through knowledgeable and skilled teachers. Even if schools have large amounts of funding, they may still have low student achievement because they don’t invest in high-quality teachers and instead devote money to “fad” programs which don’t have any effect on student achievement. Exactly what makes a high-quality teacher is a topic that is still up for debate. For instance, the most common measures used to gauge a teacher quality and in determining a teacher’s salary are the teacher’s education and experience. Reference [23] argued that teachers who have advanced degrees in their field produce higher achievement gains in students than teachers who do not. However, [10] [24] reported that there is no evidence or common consensus that teachers with high scholastic aptitude really do produce significant achievement gains
198
Y. Zhang et al.
in students. But they do believe that that some forms of training can help improve teacher ability. Reference [21] reported that teacher experience produces significant gains in student test scores. Hanushek, however, stated that the connection between teacher experience and student achievement is actually very weak. Teacher salary is another area that could potentially have a positive impact on student achievement. Reference [25] found no clear link between teacher performance pay and student achievement, although he remarked that an association between these two factors may appear in countries where teacher salaries are relatively low. Reference [24], however, stated that teacher salary may be an indicator of student achievement, but only if it is linked to teacher qualities that are associated with improved student achievement. For instance, salary may not be linked to achievement if it is determined by education and experience, but a connection may appear if salary is determined by student test score gains.
2.5. Student A very important, if not the most important goal of schools is to increase the academic achievement of students. When “achievement” is mentioned it is generally implied to mean the performance of a student in school, measured using the student’s scores on standardized tests and/or the student’s educational growth over time. Researchers believed that there are factors and policies that may affect student performance. References [26] [27] indicated that the socioeconomic background of a student plays a major role in his/her achievement. Families from high socioeconomic strata tend to be more involved in the educational system and take a more active role in helping the student perform better. The people that students interact with, and not just their teachers, can affect their achievement. Reference [27] indicated that students with high educational ability can increase not just their own achievement but the achievement of their peers. Reference [28] indicated that student achievement can also be improved by strong support from the student’s parents and the community he/she lives in. Even students who are at risk for low achievement can show significant improvement with strong parental support. The effects of specific educational policies on student achievement have also been studied. Reference [29] examined the effects of public monitoring of public schools on student achievement. Because the effort that a school makes in improving student achievement is not perfectly observable by parents, schools have an incentive to under-provide effort. [29] reported that better and more direct monitoring of public schools will cause them to provide more educational effort, which in turn increases student achievement. Reference [30] examined the effect of high school graduation requirements on student achievement and found that few students are affected by them. Most students tend to either take more courses than are required or else take courses that don’t affect their achievement. School bureaucracy was studied by [26], who concluded that the relationships between bureaucracy and student performance is negative.
3. The Model 3.1. Overall Algorithm The overall system run, see Algorithm 1, is that it first takes the graph G, policy such as the funding policy, and the reward for the policy, as the input. First, the similarity matrix is generated (introduced in Section 3.2). Then by calling the hierarchical clustering algorithm (also introduced in Section 3.2), the hierarchical structure of the network is detected. Finally, the funding evaluation algorithm is called (introduced in Section 3.3) to decompose funding distribution task into subtasks and study policies for each subtask by calculating the reward for each subtask. Algorithm 1. Hierarchical structure detection and analysis. run(G, policy, reward) s_m = similarity_matrix(G) cluster = hierarchical_clustering(s_m) policy_evaluation(policy, cluster, reward)
199
Y. Zhang et al.
3.2. Interaction-Based Similarity Measure Algorithm
Suppose there is a set of S of N nodes. The input to the clustering algorithm can be defined as a similarity ma N trix. If the set S has N nodes, there should be pairwise similarities. 2
Definition 1 Similarity Matrix. A d × d similarity matrix D on a set S is d ( a, b ) where a, b ∈ S. d ( a, b ) is a quantitative measure of the similarity between two nodes a and b. d ( a, b ) is both reflexive and symmetric, i.e. we have d ( a, a ) = 0 and d ( a, b ) = d ( b, a ) for all a, b ∈ S . The network is essentially built up by a multi-agent system, where agents interact with each other and these interactions have different levels because some agents interact more closely while others have more loose interactions. The first step of the interaction-based similarity measure algorithm is to calculate similarity between each pair of nodes. This similarity measure depends on the specific problem. For instance, in biological studies, it could be real physical distance between two nodes. In film actors’ collaboration networks, the similarity could be calculated by how many film actors have appeared in together [31]. In interaction-based social networks, it would be different because there is no real physical distance measure in the system. Therefore we propose a way to define similarity (a, b). Because nodes in our system are agents and agents have interactions with each other, we use their interaction level to be the similarity measure. Agents (nodes) that share more frequent interaction have higher similarity while agents that share less frequent interaction have lower similarity. For instance, in our school system, student-teacher pair should have higher similarity than student-principal pair because students interact more often with their teachers than that of the principle. Definition 2 Social Interaction [32]. Social interaction between two agents a and b occurs usually either when 1) a initiates it by performing a social action intended to influence b, then b “reacts”, i.e., performs an action in consequence of a’s action, or when 2) each of them independently starts a social action bearing upon the other, and each reacts to the other’s action. Definition 3 Similarity Measure. The similarity d ( a, b ) between nodes a and b is the interaction level between a and b. The interaction level is essentially domain dependent. For example, in our school systems, the interaction level is evaluated based on the actual interaction time length between students and teachers, students and other staffs, students and the principle, etc. The output of a hierarchical clustering procedure is a dendrogram. Definition 4 Dendrogram [33]. Given a finite set S0 (initial set) with cardinality N= S0 , a dendrogram is a list of N − 1 triples (ai, bi, δi), i = 0, … , N – 2, such that δi ∈ [0, ∞) is the distance between ai and bi and ai, bi ∈ Si, where Si+1 is recursively defined as (Si\{ai, bi}) ∪ ni, and ni ∉ (Si\{ai, bi}) is a label for a new cluster. The set S0 are the initial data points. In each step, ni is the new cluster which is formed by joining the clusters ai and bi at the distance δi. The order of the clusters within each pair (ai, bi) does not matter. “\” represents relative complement. Si\{ai, bi} is the set of elements in Si but not in {ai, bi}. The procedure contains N – 1 steps, so that the final state is a single cluster which contains all N initial nodes. The dengrogram represents a recursive procedure where at each step a new cluster ni is formed from two clusters ai and bi based on their distance δi. In every step, a new cluster is added to the set and the previous two individual nodes that formed the cluster are eliminated from the set. See Algorithm 2. Algorithm 2. Hierarchical clustering algorithm. hierarchical_lustering(s_m) S0 = φ initialize each node a, b, … in its own cluster ai, bi, … Do until Si is the only cluster left merge two clusters, say ai and bi with highest similarity d, into ni (Si\{ai, bi}) ∪ ni//add ni to Si and delete ai and bi
return Si
200
Y. Zhang et al.
After the step where nodes are clustered into their first cluster, which uses node similarity d, we deal with clusters directly. We use average linkage, which is the average similarity between all pairs of nodes in the two clusters, to calculate cluster similarity:
δ ( a i , bi ) =
∑a ∈ a i , ∑b ∈ bi , d ( a, b ) a i × bi
(1)
where a i and bi are the cluster pair and a and b are nodes within them.
3.3. Funding Evaluation Some of the problems of reinforcement learning tend to be very large in scale. Thus the hierarchical approach to reinforcement learning has been developed to decompose complex problems by using temporal abstraction and hierarchical control [34]. Among hierarchical reinforcement learning algorithms, the MAXQ approach is considered one of the most effective methods [35]. The MAXQ approach starts with a decomposition of a core MDP into a set of subtasks. All the tasks form a task graph hierarchically. As the task graph decomposes the action space of the problem, the MAXQ graph decomposes the value function of the problem [8]. We build a funding policy evaluation system by using the MAXQ decomposition. Funding is usually distributed into several areas such as teachers, staffs, administrators, regular education students, special education students, gifted education students, ESL students (English as Second Language), and career education students. Therefore, the model breaks the major task into several subtasks. Then each subtask can be accomplished by one or more primitive actions. Subtasks could be different funding distribution areas, which can be accomplished by different primitive actions (i.e. funding distribution methods). A reward that is evaluated by student performance is returned to each finished action. Then once different funding policies are inputted into the model, it will evaluate them, compare the rewards, and finally return the one with highest reward. Definition 5 MAXQ Task. The overall MAXQ task is to find an optimal funding policy M, which is defined over a set of states S (i.e. the funding amount received by each type of the agents such as teacher, student, and administrator) and actions A (i.e. giving an amount of funding to each type of the agents) with reward function R ( s ′ | s, a ) (the reward received upon entering a new state s ′ after receiving a funding amount in the state s) and transition probability function R ( s ′ | s, a ) (the probability of entering state s ′ as a result of receiving a funding amount in s). The basic idea of the MAXQ approach is that it decomposes the whole task into a set of subtasks, which may further be decomposed into smaller subtasks [35]. This structure forms a hierarchy tree whose leaves are primitive actions. Primitive actions return the rewards for performing the actions. Each subtask has some termination conditions, which are the conditions that once fulfilled the control of program returns to the parent subtask. We say that hierarchical policy for a MAXQ graph is a set of funding policies, π = (π 1 , π 2 , , π n ) one for each subtask. As the action space of the problem is decomposed by the task graph, we decompose the actionvalue function Qπ ( p, s, a ) , i.e. the total expected reward of performing action a in subtask p and then following the hierarchical policy π = (π 1 , π 2 , , π n ) into two components, see Equation (2). The first component V π ( a, s ) , see Equation (3), is the expected total reward received while executing action a in state 𝑠𝑠following policy π , and the second componentin Equation (4), which is called as the completion function, C π ( p, s, a ) is the expected total reward of completing parent task p following policy π after a has returned. Thus we have the MAXQ decomposition equations: Qπ (= p, s, a ) V π ( a, s ) + C π ( p, s, a )
(2)
Qπ ( a, s, π i ( s ′ ) ) if i is composite subtask V π ( a, s ) = P ( s ′|s, i ) R ( s ′|s, i ) if i is a primitive action ∑ s′
(3)
C π ( p, s, a ) = ∑ s′, n P ( s ′, n s, a ) γ n Qπ ( p, s ′, π ( s ′ ) )
(4)
where
and
Note: n here stands for time steps and γ is the time discount factor which determines the importance of fu-
201
Y. Zhang et al.
ture rewards. s ′ is the new state that is entered after performing action a instate s.
4. Experiment We implement a school system network by using real school data provided by the Texas Education Agency1. Bexar County in Texas is the geographical area we focus on. There are 15 public school districts in Bexar as of 2011 (see Table 1). Bexar County is used because it consists of mixed type school districts. In 2011, among the 15 school districts, 11 were rated as “academically acceptable” and 4 were rated as “recognized”. There are many factors that may affect school performance. Previous research in this field mostly studied the impact of one or two of those factors. We observe the emergence of school system performance based on a comprehensive list of agents/factors and the interactions between them. School funding is a very important matter surrounding education. There is conflicting evidence on whether or not an increase in school funding will truly produce an increase in student achievement or whether it is not the amount of funding but how funding is spent that is truly important [13] [14] [18]. We design a model that analyzes funding distribution records and their relations to student performance in the past year based on a hierarchical decomposition.
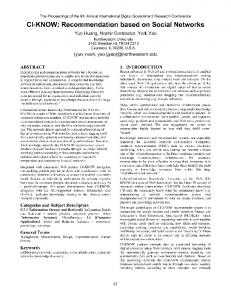
4.1. School System Structure Most of the school districts in the United States are composed of public schools, private schools, and charter schools. For each school district, there is a school board, which appoints a superintendent. Each school has its own principal and teachers. We design a multi-agent system to model a school district system. Our system includes many actors/agents such as students, teachers, principals, superintendent, etc. Our method is different from existing ones because ours observes the emergence of school system performance based on a comprehensive list of agents and the interactions between them. An abstract representation of a single school is presented Figure 1. Each node in the graph represents one type of agent. Edges represent interaction between nodes. Students are the largest group in the school system. They interact with each other. They also learn from the teachers. Teachers teach students and report to school administrative staffs (e.g. principal). School administrative staffs report to central administrative staffs (e.g. superintendent). The simulation grounds on individual agents. The actual size of our system is presented in previous Table 1. To give readers a sense of complexity, Figure 1 visualizes a graph of a small sample school district, where there are only 10 students, 2 teachers, 1 other staff, 1 central administrative staff, and 1 school administrative staff. The graph is generated by a free and open-source application called NodeXL2.
4.2. Experiment Settings I: Clustering The experiment is composed of two parts: hierarchical structure detection and funding policy evaluation. In the first part, we use a hierarchical clustering algorithm to detect hierarchical structure in the network. Then, in the second part, we use the structure detected to help to evaluate previous funding policies. As shown in Figure 2, the system has many agents connecting with each other. However, the structure of the network cannot be seen directly from the graph visualization, so it needs to be found. Therefore, here we use the agglomerative hierarchical clustering algorithm to detect underlying hierarchical community structure in the school system. Students and teachers are further divided into 10 groups: regular education students, special education students, ESL (English as Second Language) education students, career education students (CES), gifted education students (GES), regular education teachers (RET), special education teachers (SET), ESL education teachers (EET), career education teachers (CET), and gifted education teachers (GET). Table 2(a) and Table 2(b) show the number of agents in each group. Before we start, similarity between each pair of nodes must be calculated. Because nodes in the system are agents, and agents have interactions with each other, the similarity measure is set to be their interaction levels. The higher the interaction level, the higher the similarity. We define the interaction level as a function of the time 1 2
http://ritter.tea.state.tx.us/perfreport/snapshot/ http://nodexl.codeplex.com/
202
Y. Zhang et al.
Table 1. School district profiles 2011. District name
# of Schools
Total Students
Total Teachers Total Central Admin
Total School Admin
Total Other Staffs
Total Agents
Alamo Heights
6
4744
335
6.04
12.08
253.68
5350.8
Harlandale
30
14,846
970
20.86
62.58
1022.14
16921.58 13632.14
Edgewood
22
11,904
788
0
34.82
905.32
Randolph Field
3
1167
86
5.04
3.36
72.24
1333.64
San Antonio
99
54,894
3437
76.31
152.62
3968.12
62528.05
South San Antonio
18
9860
687
29.36
44.04
719.32
11339.72
Somerset
7
3779
258
5.89
17.67
318.06
4378.62
North East
73
66,364
4377
0
171.14
3936.22
74848.36
East Central
15
9571
573
12.06
24.12
603
10783.18
Southwest
14
11,779
735
15.02
45.06
720.96
13295.04
Lackland
2
985
80
1.68
3.36
80.64
1150.68
Ft. Sam Houston
2
1427
118
2.31
6.93
103.95
1658.19
Northside
107
94,632
6117
0
255.5
6387.5
107392
Judson
30
22,016
1437
0
89.37
1459.71
25002.08
Southside
9
5310
375
7.49
22.47
352.03
6066.99
Figure 1. School organization. Note: This graph only presents one school as an example of the organization because of space limit in this paper. Our datasets contains 15 school districts and in each district, there are 10 - 20 schools that are all connected to the central administrative staff in the graph.
length of agents’ interactions, as shown in Equation (5): interaction _ level = f ( time _ length )
(5)
The more time the two agents spend on interaction, the higher the interaction level. Central and school administrative staffs generally do not interact with students directly very often, but they can still have an effect on student performance and school quality [11] [12]. However, they should work with each other and teachers more directly (through recruiting, training, and rewarding high-quality principals and teachers) [12]. All students should receive regular education from regular education teachers, so they interact with each other frequently. There are also 4 other kinds of education: special, ESL, gifted, and career education. Students who also receive these four kinds of education interact with teachers of these four kinds directly. Although these students spend less time with them than with regular teachers, in order to distinguish these students from regular students, we set these interaction levels higher than the interaction levels of these students with regular teachers.
203
Y. Zhang et al.
Figure 2. School district agents and interactions figure.
Table 3(a) shows interaction levels between all kinds of agents except interactions within and between students and teachers, which are specified by groups in Table 3(b). Interaction levels are determined by the actual interaction time lengths between agents, such as students and teachers, students and staffs, etc. We normalize the actual time lengths to a scale of 0 - 9. 0 means the least interaction, while 9 means the highest interaction. The above tables are the input matrix for the clustering algorithm. The output is a dendrogram that shows out the underlying structure. We write the simulation code in Python and use the fast cluster library and its interface to Python to accomplish the clustering process because it has proven to perform well in terms of complexity3. Because fast cluster uses dissimilarity rather than similarity between nodes as the input, the matrix for the simulation program is calculated by 9 − d where d is the similarity measure presented in Table 3(a) and Table 3(b).
4.3. Experiment Settings II: Funding Policy Evaluation The second setting part of the experiment focuses on evaluating funding policy. In our experiment, the task (i.e. the funding) is decomposed into several subtasks, which are the regular education area, special education area, bilingual education area, career and technical education area, and gifted education area, as shown in Figure 3. The “primitive actions” are the actual funding distributions shown in Table 4. We collect the data for consecutive three years from 2008-2010. Table 3 shows the 2010 data. After each subtask chooses an action, the reward for that action is returned. Each subtask will iterate over all actions and rewards will be compared in the end, and the action that returns highest reward will be chosen. The reward that is returned for each action is a function of student performance. reward = f ( student _ performance )
(6)
where student_ performance is evaluated by the TAKS (Texas Assessment of Knowledge and Skills) test passing rates each year (also see Table 4). 3
http://math.stanford.edu/~muellner/fastcluster.html
204
Y. Zhang et al.
Table 2. (a) Student groups data; (b) Teacher groups data. (a) District Name
Total Students
Special Student
ESL Student
Career Student Gifted Student Regular Student
Alamo Heights
4744
284.64
237.2
284.64
759.04
3178.48
Harlandale
14,846
1336.14
2375.36
3711.5
890.76
6532.24
Edgewood
11,904
1190.4
2261.76
2261.76
952.32
5237.76
Randolph Field
1167
81.69
0
93.36
93.36
898.59
San Antonio
54,894
5489.4
8783.04
10978.8
3293.64
26349.12
South San Antonio
9860
788.8
1479
1972
394.4
5225.8
Somerset
3779
340.11
377.9
718.01
151.16
2191.82
North East
66,364
6636.4
5972.76
9954.6
4645.48
39154.76
East Central
9571
1052.81
861.39
1627.07
574.26
5455.47
Southwest
11,779
1295.69
1413.48
2473.59
471.16
6125.08
Lackland
985
98.5
19.7
157.6
49.25
659.95
Ft. Sam Houston
1427
171.24
57.08
199.78
85.62
913.28
Northside
94,632
11355.84
6624.24
17033.76
9463.2
50154.96
Judson
22,016
2201.6
1541.12
5504
1761.28
11008
Southside
5310
531
637.2
318.6
318.6
2548.8
(b) District Name
Total Teachers
Alamo Heights
335
Harlandale Edgewood
Regular Teacher Special Teacher
ESL Teacher 16.75
Career Teacher Gifted Teacher
234.5
30.15
3.35
33.5
970
727.5
116.4
58.2
38.8
29.1
788
543.72
94.56
94.56
23.64
23.64
Randolph Field
86
72.24
6.02
0
0.86
4.3
San Antonio
3437
2199.68
378.07
343.7
137.48
240.59
South San Antonio
687
377.85
68.7
116.79
27.48
68.7
Somerset
258
196.08
25.8
20.64
10.32
5.16 393.93
North East
4377
3107.67
437.7
218.85
131.31
East Central
573
338.07
63.03
40.11
17.19
40.11
Southwest
735
536.55
73.5
73.5
29.4
22.05 0.8
Lackland
80
61.6
6.4
0.8
3.2
Ft. Sam Houston
118
92.04
12.98
2.36
2.36
5.9
Northside
6117
3914.88
795.21
489.36
183.51
428.19
Judson
1437
1120.86
129.33
28.74
71.85
57.48
Southside
375
258.75
41.25
18.75
15
18.75
4.4. Results 4.4.1. Hierarchical Clustering The interaction-based clustering algorithm works for all 15 school districts. As an example, the output dendrogram for Lackland school district is shown in Figure 4. We choose this school district to present because it is one of the best-performing school districts in Bexar County. The dendrogram is generated by Python’s matplotlib library. Students and teachers are first clustered into each subgroup. Then it is clustered together with other staffs (these are shown on the bottom of Figure 4). School and school district staffs are clustered together as shown on the left. Then, they are clustered into one final cluster, as shown on top. The number on the y axis shows the distance of the two clusters that are formed together. 4.4.2. Funding Evaluation Figure 5 represents the relations between the TAKS passing rates and expenditure per student of all three years. We observe mixed-up correlations between two data. For example, for some school districts, when expenditure
205
Y. Zhang et al.
Table 3. Interaction levels a & b. (a) Student
Teacher
Other staff
School admin staff
Student
/
/
5
2
Central admin staff 0
Teacher
/
/
5
4
2
Other staff
5
5
9
4
2
School admin staff
2
4
4
9
8
Central admin staff
0
2
2
8
9
(b) RES
SES
EES
GES
CES
RET
SET
EET
GET
CET
Regular education student (RES)
9
7
7
7
7
9
6
6
6
6
Special education student (SES)
7
9
7
7
7
8
9
6
6
6
ESL education student (EES)
7
7
9
7
7
8
6
9
6
6
Gifted education student (GES)
7
7
7
9
9
8
6
6
9
6
Career education student (CES)
7
7
7
7
9
8
6
6
6
9
Regular education teacher (RET)
9
8
8
8
8
9
7
7
7
7
Special education teacher (SET)
6
9
6
6
6
7
9
7
7
7
ESL education teacher (EET)
6
6
9
6
6
7
7
9
7
7
Gifted education teacher (GET)
6
6
6
9
6
7
7
7
9
7
Career education teacher (CET)
6
6
6
6
9
7
7
7
7
9
Figure 3. Funding decomposition.
per pupil increases, student performance decreases (e.g. Northside and Southwest), or when expenditure per pupil decreases, student performance increases (e.g. Alamo Heights and Ft Sam Houston), or students perform better while their expenditures increase (e.g. Somerset and Southside), or students do not performance significantly differently no matter if the funding is increased or decreased (e.g. Randolph Field and Lackland). Therefore, we conclude that it is not necessarily the case that the more spend the better. The data on Bexar County do not show a consistent relation between changes in funding and student performance. Figure 6 shows our results of comparing all school districts together with their most effective-policy year. For school districts that have their total expenditure per student under 10,000, more funding does not seem to make them perform better than other schools. These districts are shown without labels in the figure. However, Ft Sam Houston, Lackland and Randolph Field districts (shown in the figure with labels) have relatively high expenditure
206
Y. Zhang et al.
Table 4. Funding data and TASK passing rates for the year of 2010. District Name
TAKS
Total Expenditure
Regular Education
Special Education
Alamo Heights Harlandale
ESL Education
Career Education
Gifted Education
87
43,715,556
29726578.08
71
127,324,400
68,755,176
6994488.08
0
437155.56
874311.12
16,552,172
8,912,708
3,819,732
Edgewood
59
111,248,406
0
50061783.7
13349808.72
7787388.42
3337452.18
0
Randolph Field
91
12,701,043
9525782.25
1397114.73
0
127010.43
508041.72
San Antonio
62
504,207,177
226893229.7
South San Antonio
63
93,898,291
41315248.04
90757291.86
40336574.16
15126215.31
5042071.11
14084743.65
11267794.92
3755931.64
1877965.82
Somerset
65
33,487,386
15739071.42
4688234.04
1674369.3
1339495.44
669747.72
North East
81
559,721,134
347027103.1
123138649.5
5597211.34
16791634.02
5597211.34
East Central
70
74,311,079
4161204.24
14862215.8
2229332.37
2229332.37
1486221.58
Southwest
67
99,087,846
59452707.6
14863176.9
990878.46
3963513.84
0
Lackland
87
11,806,204
7674032.6
2361240.8
118062.04
236124.08
118062.04
Ft. Sam Houston
75
19,322,253
11013684.21
6376343.49
0
386445.06
193222.53 7616304.71
Northside
80
761,630,471
472,210,892
167558703.6
0
22848914.13
Judson
69
174,658,801
104795280.6
33185172.19
5239764.03
6986352.04
0
Southside
68
46,849,510
26704220.3
6090436.3
2810970.6
1873980.4
0
Figure 4. The dendrogram for Lackland.
per pupil, and they do seem to perform a lot better. Most of their expenditures are above $11,000 per student. Randolph field, which is the best performing district, even has expenditure per pupil above $14,000. However, these three are all military base school districts, which might be the reason for their possibility of high expenditure. For other school districts, they might not be able to get such high funding, so these three might just be special cases. Therefore, we conclude that our model shows that increasing funding does not necessarily have a positive impact on student performance, and there is not a very consistent relationship between student performance and increasing funding. However, three school districts show that when the expenditure per pupil reaches a certain high level, it does appear to have a very positive impact on student performance.
207
Y. Zhang et al.
Figure 5. Relations between the TAKS passing rates and expenditure per student of all three years. Note: the three points on each line represents the three years: Left point—2008, middle point—2009, right point—2010.
Figure 6. Relations between best TAKS passing rate among three consecutive years and expenditure per student.
5 Conclusions This work contributes to both social network analysis and multi-agent system. We propose to model social networks using multi-agent systems where agents frequently interact with each other. By implementing real school networks, even with the limited data, this work has shown some promising results. With the hierarchical structure generated, we are able to evaluate funding polices for past three years for Bexar County school districts and conclude that increasing funding does not necessarily have a positive impact on student performance. However for some special types of school districts (such as military based Ft Sam Houston, Lackland and Randolph field), when the expenditure per pupil reaches a certain high level, it does appear to have a positive impact on student performance. We use the real data of 15 school districts in Bexar County, Texas. The publicly available data has some limitations that consequently narrow our evaluations. First our current experiment only contains major actors relevant to funding, such as students, teachers and administrators. It does not include many other effective actors such as parents, vendors, etc. Also our evaluations are only among public schools because of the availability of their data. It will be more interested if the comparisons can be extended to public schools, private schools and
208
Y. Zhang et al.
charter schools, and so the decision model is not only be used to evaluate funding policies but also school choices among the three types of schools. In the funding policy evaluation part, the current reward function is unified for all sub-tasks because we only have data for student performance of the whole school district. The ideal situation would be to have performance data on each sub-task, e.g. regular education, career, special education, ESL (English as Second Language), and gifted education. Therefore the funding policy evaluation could be used to analyze the impact to each sub-group rather than just to the whole. Last but not least, the reward function could be re-designed to cover more comprehensive evaluations to school quality. The current policy evaluation model is just based on student scores. Several researchers and organizations have published papers and reports regarding factors or indicators related to school quality (US Department of Education; The Organization for Economic Co-operation and Development). Many of them suggested that besides student scores on standardized achievement tests, there are many other performance measures should also be considered, such as teacher retention, teacher transfer rate, school safety, financial investments, school climate, etc. [36]. And in addition to using quantitative measures, [36] also recommends using educational experts to make qualitative assessments of a school.
Acknowledgements Jiang Wu is supported by The Fundamental Funds for Central Universities, China.
References [1]
Andrighetto, G., Boella, G., Sichman, G. and Verhagen, H. (2009) Social Networks and Multi-Agent Systems Symposium (SNAMAS-09) Introduction. Proceedings of the SNAMAS Symposium, Edinburgh, 6-9 April 2009, 1-3.
[2]
Newman, M.E. (2003) The Structure and Function of Complex Networks. SIAM Review, 45, 167-256. http://dx.doi.org/10.1137/S003614450342480
[3]
Guessoum, Z. (2003) Dynamic and Adaptive Replication for Large-Scale Reliable Multi-Agent Systems. In: Garcia, A., Lucena, C., Zambonelli, F., Omicini, A. and Castro, J., Eds., Software Engineering for Large-Scale Multi-Agent Systems, Springer, Berlin, 182-198. http://dx.doi.org/10.1007/3-540-35828-5_12
[4]
Grant, T. (2009) Modeling Network-Enabled C2 Using Multiple Agents and Social Networks. Social Networks and Multi-Agent Systems Symposium (SNAMAS), 6-9 April 2009, Edinburgh, 30-35.
[5]
Ma, J., Guo, D.W., Wang, K.P., Liu, M. and Chen, S. (2009) Colony Evolution in Social Networks Based on MultiAgent Systems. IEEE International Conference on Natural Computation, 4, 594-597.
[6]
Bettinger, E. (2005) The Effect of Charter Schools on Charter Students and Public Schools. Economics of Education Review, 24, 133-147. http://dx.doi.org/10.1016/j.econedurev.2004.04.009
[7]
Lubienski, C. and Lubienski, S.T. (2006) Charter, Private, Public Schools and Academic Achievement: New Evidence from NAEP Mathematics Data. Occasional Paper, A12.
[8]
Slate, J.R. and Jones, C.H. (2005) Effects of School Size: A Review of the Literature with Recommendations. Essays in Education, 13, 1-22.
[9]
Schaeffer, S.E. (2007) Graph Clustering. Computer Science Review, 1, 27-64. http://dx.doi.org/10.1016/j.cosrev.2007.05.001
[10] Harris, D.N. and Sass, T.R. (2011) Teacher Training, Teacher Quality and Student Achievement. Journal of Public Economics, 95, 798-812. http://dx.doi.org/10.1016/j.jpubeco.2010.11.009 [11] Clark, D., Martorell, P. and Rockoff, J. (2010) School Principals and School Performance. National Center for Analysis of Longitudinal Data in Education Research, Technical Report, Columbia University, New York. [12] Meier, K.J., O’Toole Jr., L.J. and Goerdel, H.T. (2003) School Superintendents and School Performance: Quality Matters. Texas Educational Excellence Project, Technical Report. [13] Anderson, N. (2011) Per Pupil Spending: How Much Difference Does a Dollar Make? All Graduate Plan B and other Reports, Paper 20. http://digitalcommons.usu.edu/gradreports/20 [14] Crampton, F.E. (2009) Spending on School Infrastructure: Does Money Matter? Journal of Educational Administration, 47, 305-322. http://dx.doi.org/10.1108/09578230910955755 [15] Fortunato, S. (2010) Community Detection in Graphs. Physics Reports, 486, 75-174. http://dx.doi.org/10.1016/j.physrep.2009.11.002 [16] Wakita, K. and Tsurumi, T. (2007) Finding Community Structure in Mega-Scale Social Networks. Proceedings of the
209
Y. Zhang et al.
16th International Conference on World Wide Web, Banff, 8-12 May 2007, 1275-1276. http://dx.doi.org/10.1145/1242572.1242805
[17] Dietterich, T.G. (2000) An Overview of MAXQ Hierarchical Reinforcement Learning. In: Koenig, S. and Holte, R., Eds., Abstraction, Reformulation, and Approximation Anonymous, Springer, Berlin, 26-44. http://dx.doi.org/10.1007/3-540-44914-0_2 [18] Kenyon, D.A. (2007) The Property Tax-School Funding Dilemma. Lincoln Institute of Land Policy, Cambridge. [19] Waters, J.T. and Marzano, R.J. (2006) School District Leadership That Works: The Effect of Superintendent Leadership on Student Achievement. Mid-Continent Research for Education and Learning. [20] Dhuey, E. and Smith, J. (2011) How Important Are School Principals in the Production of Student Achievement? Working Paper, University of Toronto, Toronto. http://homes.chass.utoronto.ca/~edhuey/datastore/files/docs/dhuey_smith_princ_nov2011.pdf [21] Rockoff, J.E. (2004) The Impact of Individual Teachers on Student Achievement: Evidence from Panel Data. American Economic Review, 94, 247-252. http://dx.doi.org/10.1257/0002828041302244 [22] Wong, K.K. (1989) Fiscal Support for Education in American States: The “Parity-to-Dominance” View Examined. American Journal of Education, 97, 329-357. http://dx.doi.org/10.1086/443933 [23] Zhang, D. (2008) The Effects of Teacher Education Level, Teaching Experience, and Teaching Behaviors on Student Science Achievement. Graduate Thesis, Utah State University, Logan. [24] Hanushek, E. and Rivkin, S. (2007) Pay, Working Conditions, and Teacher Quality. The Future of Children, 17, 69-86. http://dx.doi.org/10.1353/foc.2007.0002 [25] Croenweth, S. (2012) Does Teacher Performance Pay Improve Student Achievement? http://blog.socrato.com/does-teacher-performance-pay-improve-student-achievement/ [26] Bohte, J. (2002) School Bureaucracy and Student Performance at the Local Level. Public Administration Review, 61, 92-99. http://dx.doi.org/10.1111/0033-3352.00008 [27] Epple, D. and Romano, R.E. (1998) Competition between Private and Public Schools, Vouchers, and Peer-Group Effects. The American Economic Review, 88, 33-62. [28] Henderson, A. (2002) A New Wave of Evidence: The Impact of School, Family, and Community Connections on Student Achievement. Southwest Educational Development Laboratory, Annual Synthesis. [29] Ferreyra, M. and Liang, P. (2011) Information Asymmetry and Equilibrium Monitoring in Education. Journal of Public Economics, 96, 237-254. http://dx.doi.org/10.1016/j.jpubeco.2011.07.012 [30] Chaney, B., Burgdorf, K. and Atash, N. (1997) Influencing Achievement Through high School Graduation Requirements. Educational Evaluation and Policy Analysis, 19, 229-244. http://dx.doi.org/10.3102/01623737019003229 [31] Marchiori, M. and Latora, V. (2000) Harmony in the Small-World. Physica A: Statistical Mechanics and Its Applications, 285, 539-546. [32] Znaniecki, F. (1986) Social Relations and Social Roles. Irvington Publishing, Manchester. [33] Müllner, D. (2011) Modern Hierarchical, Agglomerative Clustering Algorithms. ArXiv Organization, Technical Report. [34] Barto, A. and Mahadevan, S. (2003) Recent Advances in Hierarchical Reinforcement Learning. Discrete Event Dynamic Systems, 13, 341-379. http://dx.doi.org/10.1023/A:1025696116075 [35] Mirzazadeh, F., Behsaz, B. and Beigy, H. (2007) A New Learning Algorithm for the maxq Hierarchical Reinforcement Learning Method. International Conference on Information and Communication Technology (ICICT’07), Dhaka, 7-9 March 2007, 105-108. [36] Pinkus, L. (2009) Moving Beyond AYP: High School Performance Indicators. Alliance for Excellent Education. Policy Brief, Washington DC.
210
Scientific Research Publishing (SCIRP) is one of the largest Open Access journal publishers. It is currently publishing more than 200 open access, online, peer-reviewed journals covering a wide range of academic disciplines. SCIRP serves the worldwide academic communities and contributes to the progress and application of science with its publication. Other selected journals from SCIRP are listed as below. Submit your manuscript to us via either
[email protected] or Online Submission Portal.